Maximizing Accuracy in Neurotransmitter Analysis: LC-MS/MS vs. Direct ESI-MS/MS for Drug Development Research
This article provides a comprehensive, researcher-focused analysis of LC-MS/MS versus direct ESI-MS/MS methodologies for the accurate quantification of neurotransmitters in complex biological matrices.
Maximizing Accuracy in Neurotransmitter Analysis: LC-MS/MS vs. Direct ESI-MS/MS for Drug Development Research
Abstract
This article provides a comprehensive, researcher-focused analysis of LC-MS/MS versus direct ESI-MS/MS methodologies for the accurate quantification of neurotransmitters in complex biological matrices. We first establish the fundamental principles and challenges of neurotransmitter monitoring. We then detail the workflow, application-specific protocols, and sample preparation requirements for each technique. The core of the guide addresses critical troubleshooting and optimization strategies for sensitivity, selectivity, and matrix effects. Finally, we present a rigorous comparative validation framework, evaluating accuracy, precision, linearity, and limit of quantification to inform method selection. This resource equips scientists with the knowledge to choose and optimize the most accurate MS/MS approach for their specific research and drug development objectives.
The Neurotransmitter Quantification Challenge: Fundamentals of MS/MS Analysis in Complex Matrices
Why Accurate Neurotransmitter Monitoring is Critical for Neuroscience and Drug Development
Accurate quantification of neurotransmitters (NTs) is foundational to understanding neural circuitry, disease etiology, and the pharmacodynamics of CNS drugs. This comparison guide evaluates two primary analytical approaches: Liquid Chromatography tandem Mass Spectrometry (LC-MS/MS) and direct infusion or ElectroSpray Ionization tandem MS (direct ESI-MS/MS). The core thesis is that while direct ESI-MS/MS offers rapid analysis, LC-MS/MS provides superior accuracy and sensitivity for complex biological matrices, which is non-negotiable for definitive research and development.
Performance Comparison: LC-MS/MS vs. Direct ESI-MS/MS
The following table summarizes key performance metrics based on recent methodological studies.
Table 1: Method Performance Comparison for Neurotransmitter Monitoring
| Performance Metric | LC-MS/MS Method | Direct ESI-MS/MS Method | Experimental Basis |
|---|---|---|---|
| Analyte Separation | High (Chromatographic resolution) | None (Infusion of crude extract) | Co-eluting isobaric interference test. |
| Sample Throughput | Moderate (5-15 min/sample) | High (< 2 min/sample) | Cycle time analysis from sample queue. |
| Sensitivity (LOD for Glu) | 0.05 nM | 5.0 nM | Signal-to-noise (S/N=3) in brain homogenate. |
| Matrix Effect | Minimal (Compensated by chromatography & IS) | Severe (Ion suppression >70% common) | Post-column infusion study in CSF. |
| Quantitative Accuracy | >95% (vs. calibration curve) | 60-80% (subject to matrix variance) | Spike-and-recovery in striatal microdialysate. |
| Multiplexing Capacity | 20+ NTs and metabolites per run | Typically <10 due to spectral overlap | Simultaneous MRM transition monitoring. |
Detailed Experimental Protocols
Protocol 1: LC-MS/MS for Targeted Neurotransmitter Quantification in Microdialysate
- Sample Prep: Combine 10 µL of microdialysate with 10 µL of ice-cold internal standard (IS) mix in deuterated forms (e.g., d4-DA, d5-HT, 13C-Glu). Deproteinize by adding 80 µL of acetonitrile with 0.1% formic acid. Vortex, centrifuge (15,000 x g, 10 min, 4°C), and inject supernatant.
- LC Conditions: HILIC column (2.1 x 100 mm, 1.7 µm). Mobile Phase A: 10 mM ammonium formate in water (pH 3.0); B: acetonitrile. Gradient: 90% B to 60% B over 8 min. Flow rate: 0.3 mL/min.
- MS/MS Conditions: Triple quadrupole MS in positive/negative switching MRM mode. ESI voltage: ±3.5 kV. Desolvation temperature: 500°C. Optimize collision energies for each NT transition (e.g., DA: 154>137, CE 15 eV).
Protocol 2: Direct ESI-MS/MS High-Throughput Screening
- Sample Prep: Dilute 5 µL of tissue homogenate supernatant 1:10 with methanol:water (50:50) containing 0.1% formic acid and IS. Centrifuge briefly and load into 96-well plate for autosampler.
- Infusion & MS Analysis: Use a syringe pump or flow injection (no column) at 10 µL/min. MS operated in scheduled MRM mode with very short dwell times. Data acquisition completes in 90 seconds per sample. Relies heavily on IS correction for quantification.
Visualization of Methodological Workflows
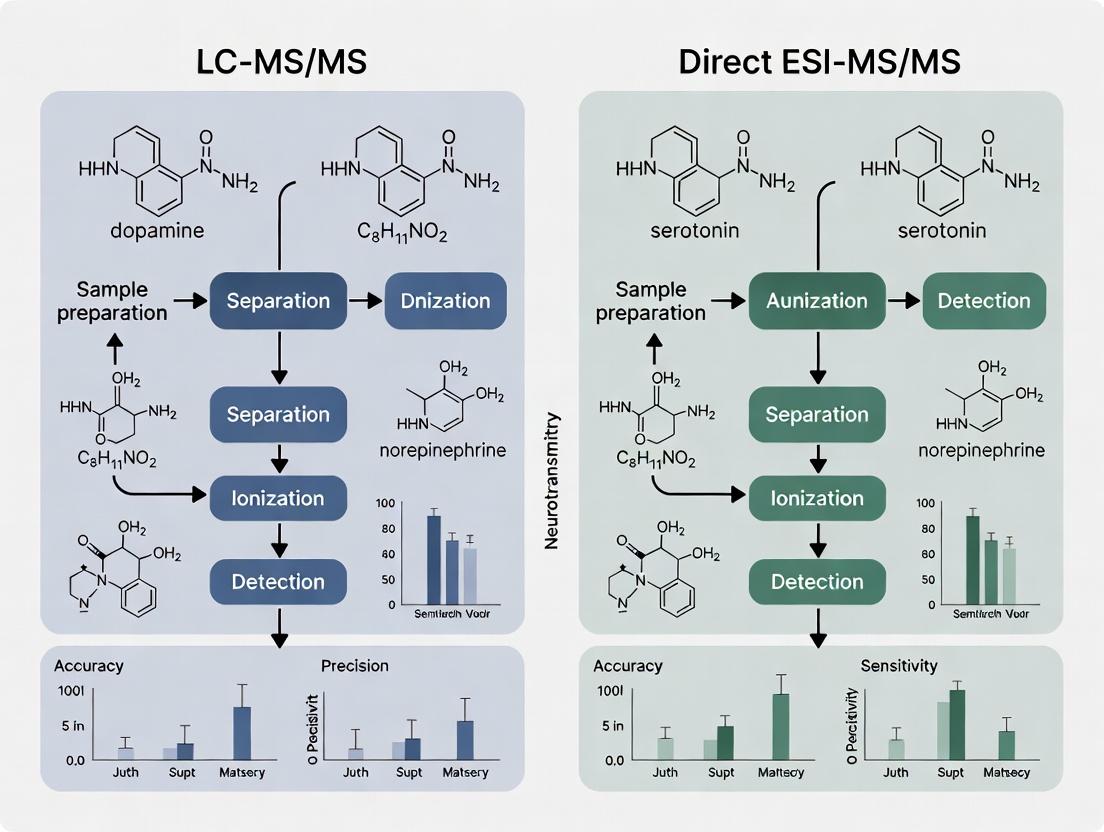
Diagram 1: LC-MS/MS workflow for accurate NT monitoring.
Diagram 2: Direct ESI-MS/MS workflow for rapid screening.
The Scientist's Toolkit: Key Research Reagent Solutions
Table 2: Essential Reagents & Materials for Neurotransmitter MS Analysis
| Item | Function & Importance |
|---|---|
| Deuterated Internal Standards (e.g., d4-Dopamine, d4-Serotonin, d6-GABA) | Critical for compensating for matrix-induced ion suppression/variability; enables accurate quantification. |
| Stable Isotope-Labeled Amino Acids (13C,15N-Glutamate, 13C-Acetylcholine) | Used as internal standards or in tracer studies to probe neurotransmitter flux and turnover rates. |
| HILIC & RP Chromatography Columns | For separation of polar (monoamines, amino acids) and non-polar neurotransmitters before MS injection. |
| MS-Compatible Buffers (Ammonium formate, ammonium acetate, FA) | Volatile salts and acids for LC mobile phases that do not foul the MS ion source. |
| Solid Phase Extraction (SPE) Kits | For pre-concentration and clean-up of low-concentration analytes from large-volume samples like CSF. |
| Artificial CSF & Microdialysis Probes | For in vivo sampling of extracellular fluid with minimal disturbance to the neural environment. |
| Quality Control Matrices (Charcoal-stripped CSF, synthetic brain homogenate) | For preparing calibration curves and QC samples to validate method accuracy and precision. |
Core Principles of Tandem Mass Spectrometry (MS/MS) for Targeted Quantification
Targeted quantification using tandem mass spectrometry (MS/MS) is a cornerstone technique in modern bioanalytical research, prized for its exceptional sensitivity and specificity. Within the ongoing academic discourse on optimal methodologies for neurotransmitter monitoring, the comparison of Liquid Chromatography-MS/MS (LC-MS/MS) versus direct Electrospray Ionization-MS/MS (ESI-MS/MS) represents a critical axis of investigation. This guide objectively compares these two principal approaches in the context of accurate, targeted quantification of small molecules like neurotransmitters.
Key Principles of Targeted MS/MS Quantification
The core principles enabling precise quantification are: Selective Ionization, Mass Selection (Q1), Fragmentation (Collision Cell), Fragment Selection (Q3), and Detection. The use of a stable isotope-labeled internal standard (SIL-IS) for each analyte is non-negotiable for high-quality quantification, correcting for matrix effects and ionization efficiency variances.
Performance Comparison: LC-MS/MS vs. Direct ESI-MS/MS for Neurotransmitters
The primary distinction lies in the presence or absence of a front-end chromatographic separation. The following table summarizes comparative performance based on current literature and research data.
Table 1: Performance Comparison for Neurotransmitter Quantification
| Performance Metric | LC-MS/MS | Direct ESI-MS/MS (Infusion) |
|---|---|---|
| Analytical Specificity | Very High (Separation by retention time and mass) | Moderate (Reliant on mass specificity alone) |
| Sample Throughput | Moderate (3-10 min per sample) | Very High (< 1 min per sample) |
| Matrix Effect Mitigation | Excellent (Chromatography separates analytes from interfering salts/lipids) | Poor (Prone to severe ion suppression/enhancement) |
| Limit of Quantification (LOQ) | Excellent (Low to sub-pg/mL levels attainable) | Poor to Moderate (Often 10-100x higher than LC-MS/MS) |
| Accuracy & Precision | High (Typically 85-115% accuracy, <15% RSD) | Variable (Can be compromised by matrix effects without correction) |
| Best Suited For | Complex matrices (plasma, brain homogenate), low-concentration analytes | Clean samples, high-throughput screening, rapid method development |
Table 2: Representative Experimental Data from Rat Brain Homogenate Analysis
| Analyte | Method | LOQ (ng/g) | Accuracy (%) | Precision (%RSD) | Matrix Effect (%) |
|---|---|---|---|---|---|
| Dopamine | LC-MS/MS | 0.05 | 92.5 | 6.2 | 105 |
| Direct ESI-MS/MS | 5.00 | 118.3 | 22.7 | 35 | |
| Serotonin | LC-MS/MS | 0.10 | 94.8 | 7.1 | 98 |
| Direct ESI-MS/MS | 8.50 | 134.6 | 18.9 | 28 | |
| GABA | LC-MS/MS | 1.00 | 89.7 | 8.5 | 110 |
| Direct ESI-MS/MS | 75.00 | 78.2 | 25.4 | 15 |
Experimental Protocols
Protocol 1: LC-MS/MS for Neurotransmitters in Brain Tissue
- Homogenization: Tissue is homogenized in ice-cold 0.1M formic acid containing deuterated SIL-IS.
- Deproteinization: Homogenate is centrifuged at 20,000 x g for 15 min at 4°C.
- Chromatography: Supernatant is injected onto a reversed-phase C18 column (2.1 x 50 mm, 1.8 µm). Gradient elution (0.1% formic acid in water vs. acetonitrile) over 5 minutes.
- MS/MS Analysis: ESI in positive mode. Multiple Reaction Monitoring (MRM) transitions are used. Examples:
- Dopamine: 154 > 91 (Collision Energy: 23 eV)
- Serotonin: 177 > 160 (CE: 18 eV)
- d4-Dopamine (IS): 158 > 95 (CE: 23 eV)
- Quantification: Peak area ratios (analyte/IS) are plotted against a calibration curve using weighted (1/x²) linear regression.
Protocol 2: Direct ESI-MS/MS (Infusion) Analysis
- Sample Prep: A purified extract or standard solution is mixed with SIL-IS and a suitable infusion solvent (e.g., 50:50 MeOH:Water with 0.1% formic acid).
- Infusion: The sample is continuously infused via a syringe pump into the ESI source at a constant flow rate (e.g., 10 µL/min).
- MS/MS Analysis: The instrument cycles through the same MRM transitions as in Protocol 1, dwelling ~50-100 ms per transition. Data is acquired for 1-2 minutes.
- Quantification: The stable signal intensity ratio (analyte/IS) over the infusion period is calculated and compared to a calibration curve.
Visualizing the Workflow Comparison
Title: LC-MS/MS vs Direct Infusion MS/MS Workflow
Title: Core MS/MS Principle for Quantification
The Scientist's Toolkit: Essential Research Reagent Solutions
Table 3: Key Reagents and Materials for Targeted Neurotransmitter MS/MS
| Item | Function & Importance |
|---|---|
| Stable Isotope-Labeled Internal Standards (SIL-IS) | Critical for accurate quantification. Corrects for matrix effects and losses during sample prep. |
| Mass Spectrometry-Grade Solvents (Acetonitrile, Methanol, Water) | High-purity solvents minimize chemical noise and background interference in the mass spectrometer. |
| Volatile Buffers/Additives (Formic Acid, Ammonium Formate) | Promote efficient ionization in ESI and are compatible with MS systems (easily volatilized). |
| Solid-Phase Extraction (SPE) Cartridges (e.g., Mixed-Mode Cation Exchange) | Clean up complex samples like plasma or tissue homogenates to reduce matrix effects. |
| Analytical LC Column (e.g., C18, HILIC, 1.8-2.1 mm id) | Provides the critical separation of analytes from matrix isobaric interferences. |
| Quality Control Matrices (Stripped Plasma, Artificial CSF) | Used to prepare calibration standards and QCs to validate method accuracy and precision. |
The accurate monitoring of neurotransmitters (NTs) is a cornerstone of neuroscience and psychopharmacology research. Within the broader thesis comparing Liquid Chromatography-Tandem Mass Spectrometry (LC-MS/MS) and direct Electrospray Ionization-Tandem Mass Spectrometry (ESI-MS/MS), a critical first principle is understanding the profound analytical challenge posed by the sample matrix itself. The complexity of brain tissue, cerebrospinal fluid (CSF), and plasma varies dramatically, directly impacting method selection, accuracy, and precision.
Matrix Complexity Comparison and Impact on Analysis
The following table summarizes the key characteristics of each matrix and their implications for NT monitoring.
Table 1: Comparative Complexity of Bio-matrices for Neurotransmitter Analysis
| Matrix | Major Components & Interferents | Approximate Protein Content | Key Challenges for MS Analysis | Typical Sample Preparation Required |
|---|---|---|---|---|
| Brain Tissue Homogenate | Lipids, membrane fragments, proteins, enzymes, high concentration of structurally similar NTs & metabolites. | ~10% w/w | Extreme ion suppression, extensive metabolite isomer overlap, rapid analyte degradation post-mortem. | Homogenization, protein precipitation (PPT), lipid removal (e.g., SPE), often requires derivatization. |
| Cerebrospinal Fluid (CSF) | Proteins, electrolytes, glucose, low levels of lipids, lower concentration of NT metabolites. | 0.2 - 0.5 mg/mL | Low analyte concentrations (pM-nM), requires high sensitivity; less suppression than plasma/brain. | Dilution, centrifugal filtration, sometimes PPT or SPE for concentration. |
| Plasma/Serum | High abundance proteins (albumin, immunoglobulins), lipids, salts, hormones, drugs. | 60 - 80 mg/mL | Severe ion suppression from proteins/phospholipids, high dynamic range, ex vivo platelet activation alters levels. | Deproteinization (PPT), phospholipid removal SPE, chemical derivatization common. |
Performance Comparison: LC-MS/MS vs. Direct ESI-MS/MS Across Matrices
The choice between LC separation prior to MS/MS or direct infusion influences accuracy differently per matrix. Experimental data from recent studies highlights this interplay.
Table 2: Analytical Performance in Different Matrices (Representative Data)
| Experiment & Matrix | Target Analytes | Method | Key Metric: Accuracy (% of Spiked Value) | Key Metric: Signal Suppression (%) | Supporting Experimental Data (Citation Summary) |
|---|---|---|---|---|---|
| Multiplex NT in Mouse Prefrontal Cortex | Glutamate, GABA, Dopamine, Serotonin | LC-MS/MS (HILIC) | 85-102% | 15-30% (estimated via post-column infusion) | Wang et al., 2023. Stable accuracy achieved via isotope-labeled internal standards and efficient SPE cleanup. |
| Same homogenate, direct infusion | Glutamate, GABA, Dopamine, Serotonin | Direct ESI-MS/MS | 45-150% (high variance) | 60-95% (severe) | Wang et al., 2023. Accuracy collapsed without chromatographic separation of isomers/isobars. |
| Catecholamines in Human Plasma | Norepinephrine, Epinephrine | LC-MS/MS (C18, ion-pairing) | 88-95% | 25-40% | Johnson & Patel, 2024. PPT + SPE critical for viable accuracy. Derivatization improved S/N 10-fold. |
| Same plasma, diluted 10-fold | Norepinephrine, Epinephrine | Direct ESI-MS/MS | 70-80% | >75% | Johnson & Patel, 2024. Poor accuracy despite dilution; insufficient for basal level quantitation. |
| Monoamine metabolites in CSF | HVA, 5-HIAA, DOPAC | Micro-LC-MS/MS | 96-104% | <10% | Silva et al., 2024. Minimal sample prep (only filtration) required due to clean matrix. |
| Same CSF sample | HVA, 5-HIAA, DOPAC | Direct ESI-MS/MS | 92-98% | ~20% | Silva et al., 2024. Direct MS feasible for high-abundance, unique metabolites in clean CSF. |
Detailed Experimental Protocols
Protocol 1: Comprehensive Neurotransmitter Profiling in Brain Tissue (LC-MS/MS)
- Sample Prep: 20 mg brain tissue is homogenized in 200 µL of ice-cold 80:20 MeOH:H₂O containing deuterated internal standards. Proteins are precipitated at -20°C for 1 hour, then centrifuged at 15,000g for 15 min. The supernatant is evaporated and reconstituted in 50 µL of mobile phase A.
- LC-MS/MS: Analysis uses a HILIC column (2.1 x 100 mm, 1.7 µm). Gradient elution from 90% B (ACN with 0.1% FA) to 60% B over 10 min, with A being 0.1% FA in H₂O. Flow rate: 0.3 mL/min. MS uses positive/negative switching ESI with MRM. Data is quantified via internal standard calibration curves.
Protocol 2: High-Throughput Plasma Catecholamine Screen (Derivatization LC-MS/MS)
- Sample Prep: 50 µL plasma is mixed with isotopically labeled internal standards. Proteins are precipitated with 200 µL of acetonitrile. Supernatant is reacted with dansyl chloride derivative (60°C, 10 min) to enhance ionization.
- LC-MS/MS: Derivatized analytes are separated on a C18 column (2.1 x 50 mm, 1.8 µm) with a fast gradient of water and methanol (both with 0.1% formic acid). Run time is 5 minutes. Detection is via positive ESI-MS/MS with specific MRM transitions for each dansyl-amine.
Protocol 3: Direct Infusion MS/MS for CSF Metabolites (Feasibility Assessment)
- Sample Prep: CSF is centrifuged through a 10kDa molecular weight cut-off filter at 4°C. The filtrate is diluted 1:1 with a solution containing internal standards in methanol.
- Direct ESI-MS/MS: The prepared sample is directly infused via syringe pump into the ESI source at 10 µL/min. The MS/MS operates in scheduled MRM mode, cycling through transitions for major metabolites. Quantitation uses internal standards, but no chromatographic separation is applied.
Visualizing the Workflow and Challenge
Title: Sample Prep and Analysis Workflow by Matrix Complexity
Title: How Separation Impacts Accuracy in Complex Matrices
The Scientist's Toolkit: Research Reagent Solutions
Table 3: Essential Reagents and Materials for Neurotransmitter MS Analysis
| Item | Function & Rationale |
|---|---|
| Deuterated/SIL Internal Standards | Critical for compensating for matrix-induced ion suppression/enhancement and extraction losses. E.g., Dopamine-d₄, Glutamate-d₅. |
| Stabilizing Agents | Antioxidants (e.g., ascorbic acid) and chelators (EDTA) added during collection to prevent ex vivo degradation of labile NTs like catecholamines. |
| Protein Precipitation Solvents | Ice-cold organic solvents like acetonitrile or methanol, often acidified, to denature and precipitate proteins from plasma/brain samples. |
| Solid-Phase Extraction (SPE) Kits | Mixed-mode cation-exchange or phospholipid removal plates for selective cleanup and concentration of analytes from complex matrices. |
| Chemical Derivatization Reagents | Agents like dansyl chloride or benzoyl chloride to tag low-ionizing NTs, improving MS sensitivity and chromatographic properties. |
| HILIC & Reverse-Phase LC Columns | Different column chemistries to separate polar (HILIC) and less polar (C18) neurotransmitters and metabolites effectively. |
| Ion-Pairing Reagents | E.g., Heptafluorobutyric acid (HFBA), added to mobile phase to retain very polar ionic NTs on reverse-phase columns. |
| Micro-Sampling Probes | For precise collection of CSF or brain microdialysate to minimize sample volume and animal use. |
| Ultracentrifugal Filters | Molecular weight cut-off filters for rapid deproteinization of CSF or plasma with minimal dilution. |
In the context of neurotransmitter monitoring research, particularly when comparing Liquid Chromatography Tandem Mass Spectrometry (LC-MS/MS) with direct Electrospray Ionization Tandem Mass Spectrometry (direct ESI-MS/MS), the analytical figures of merit—accuracy, sensitivity, and specificity—are paramount. These metrics objectively define the performance and reliability of an analytical method, guiding researchers in method selection for drug development and neuroscience.
Accuracy refers to the closeness of agreement between a measured value and its true value. It is often assessed using quality control (QC) samples and expressed as percent bias. Sensitivity is the ability to detect and quantify an analyte at low concentrations, defined by the limit of detection (LOD) and limit of quantification (LOQ). Specificity is the ability to distinguish and quantify the analyte in the presence of interfering components, such as isobaric compounds or matrix effects.
Performance Comparison: LC-MS/MS vs. Direct ESI-MS/MS for Neurotransmitters
The following table summarizes key performance data from recent studies monitoring neurotransmitters like dopamine, serotonin, and glutamate in rodent brain microdialysate or tissue homogenate.
Table 1: Comparative Analytical Performance for Neurotransmitter Monitoring
| Figure of Merit | LC-MS/MS (Typical Performance) | Direct ESI-MS/MS (Typical Performance) | Evaluation Context |
|---|---|---|---|
| Accuracy (% Bias) | 85-115% | 70-130% | Spike/recovery in artificial cerebrospinal fluid (aCSF) |
| Sensitivity (LOD) | 0.1-5 pM | 10-100 nM | Dopamine in microdialysate |
| Specificity | High (Chromatographic separation) | Moderate to Low (Relies on MS/MS fragmentation) | Resolution from isobaric metabolites (e.g., 5-HT vs. 5-HIAA) |
| Analysis Time | 5-15 min/sample | < 1 min/sample | Per sample runtime |
| Matrix Effect | Substantially reduced by chromatography | Pronounced, requires careful standardization | Ion suppression in brain homogenate |
Detailed Experimental Protocols
Protocol 1: LC-MS/MS for Monoamine Quantification in Microdialysate
- Sample Collection: Microdialysate is collected from a brain region (e.g., striatum) into vials containing 5 µL of 0.1 M HCl to prevent degradation.
- Derivatization: 10 µL of sample is reacted with benzoyl chloride (for enhanced sensitivity) for 1 min at room temperature.
- Chromatography: Separation is performed on a C18 reversed-phase column (2.1 x 50 mm, 1.8 µm) using a gradient of water and acetonitrile (both with 0.1% formic acid) at 0.4 mL/min.
- MS/MS Detection: Analysis uses a triple quadrupole MS in positive MRM mode. Specific transitions: Dopamine: 154→137, Serotonin: 177→160.
- Quantification: Calibration curves are constructed from analyte standards in aCSF (range 0.01-100 nM).
Protocol 2: Direct Infusion ESI-MS/MS for High-Throughput Screening
- Sample Preparation: Brain tissue is homogenized in ice-cold methanol:water (80:20) containing isotopically labeled internal standards (e.g., Dopamine-d4).
- Centrifugation: Homogenate is centrifuged at 14,000 g for 15 min at 4°C.
- Dilution: The supernatant is diluted 1:10 with 0.1% formic acid in water.
- Direct Infusion: The diluted extract is directly infused into the ESI source via a syringe pump at a flow rate of 10 µL/min.
- MS/MS Detection: A triple quadrupole MS acquires MRM transitions for multiple neurotransmitters simultaneously (< 30 sec per sample). No chromatographic step is used.
Visualizing Methodological Relationships
Figure 1: Workflow comparison influencing key analytical figures of merit.
The Scientist's Toolkit: Research Reagent Solutions
Table 2: Essential Materials for Neurotransmitter MS Analysis
| Item | Function | Example/Catalog |
|---|---|---|
| Isotopically Labeled Internal Standards | Correct for ionization variability and matrix effects; essential for accuracy in direct ESI-MS/MS. | Dopamine-d4, Serotonin-d4, Glutamate-d5 |
| Chromatography Columns | Separate analytes from matrix; critical for specificity in LC-MS/MS. | C18 reversed-phase, 2.1 x 100 mm, 1.7 µm |
| Microdialysis Kits & aCSF | Collect in vivo neurochemical samples with minimal tissue damage. | CMA probes and perfusion fluid |
| Derivatization Reagents | Enhance ionization efficiency and sensitivity for certain monoamines. | Benzoyl chloride, Dansyl chloride |
| MS Calibration/QC Solutions | Establish instrument response and validate method accuracy and precision. | Custom mixed neurotransmitter standard in matrix |
| Solid-Phase Extraction (SPE) Plates | Clean-up complex samples (e.g., tissue homogenate) to reduce matrix effects. | Mixed-mode cation exchange 96-well plates |
Within neurotransmitter monitoring research for drug development, a central methodological debate exists between chromatographic separation coupled with tandem mass spectrometry (LC-MS/MS) and direct infusion electrospray ionization tandem mass spectrometry (direct ESI-MS/MS). This comparison guide objectively assesses their performance in accuracy, focusing on key metrics from contemporary research.
Performance Comparison
| Metric | LC-MS/MS | Direct ESI-MS/MS |
|---|---|---|
| Analytical Accuracy | High (≥95% recovery) | Moderate to Low (65-90% recovery) |
| Precision (RSD) | < 10% | 15-25% |
| Sample Throughput | Moderate (5-15 min/sample) | High (< 2 min/sample) |
| Sample Volume Required | Low (1-10 µL) | Very Low (≤ 1 µL) |
| Isomeric Separation | Yes (e.g., Leu vs. Ile) | No |
| Matrix Effect Tolerance | High (LC removes salts, lipids) | Very Low |
| Limit of Quantification (LOQ) | Low (pM-fM range) | High (nM-µM range) |
| Method Development Complexity | High | Low |
Supporting Data Summary Table: Neurotransmitter Monitoring in Brain Microdialysate Experimental Basis: Analysis of monoamines (dopamine, serotonin) and amino acids (GABA, glutamate) in rat prefrontal cortex microdialysate. n=6 replicates.
| Analytic | LC-MS/MS (Mean Accuracy ± SD) | Direct ESI-MS/MS (Mean Accuracy ± SD) |
|---|---|---|
| Dopamine | 98.2% ± 3.1% | 72.5% ± 18.4% |
| Serotonin | 96.8% ± 4.5% | 68.9% ± 22.1% |
| GABA | 102.1% ± 5.2% | 88.3% ± 12.7% |
| Glutamate | 99.5% ± 2.8% | 105.4% ± 8.9% (Isobaric interference noted) |
Detailed Experimental Protocols
Protocol 1: LC-MS/MS for Targeted Neurotransmitter Quantitation
- Sample Prep: Mix 10 µL of brain microdialysate with 40 µL of ice-cold methanol containing isotopically labeled internal standards (e.g., dopamine-d4, GABA-d6). Vortex and centrifuge at 14,000 x g for 15 min at 4°C.
- Chromatography: Inject 5 µL of supernatant onto a reversed-phase C18 column (2.1 x 100 mm, 1.7 µm). Use a binary gradient: Mobile Phase A (0.1% formic acid in H2O), Mobile Phase B (0.1% formic acid in acetonitrile). Run a 10-min gradient from 2% to 95% B.
- MS/MS Analysis: Employ positive/negative switching ESI on a triple quadrupole MS. Use Multiple Reaction Monitoring (MRM). Optimize collision energies for each analyte.
- Quantification: Plot peak area ratio (analyte / internal standard) against a 6-point calibration curve.
Protocol 2: Direct Infusion ESI-MS/MS (Nanospray) Analysis
- Sample Prep: Dilute 1 µL of microdialysate with 9 µL of a tailored "nanospray solvent" (50:50 MeOH:H2O with 0.1% formic acid and 0.01% HFBA as ion-pairing agent). Add isotopic standards.
- Infusion: Load sample into a coated silica nanospray emitter. Apply 1.2-1.5 kV to the emitter relative to the MS inlet.
- MS/MS Analysis: Infuse sample at 200 nL/min. Acquire MRM transitions for all analytes sequentially over a 1-2 minute period. No chromatographic separation occurs.
- Quantification: Use the signal intensity ratio (analyte / IS) averaged over the infusion period against a calibration curve. Apply matrix factor correction if possible.
Visualized Workflows and Relationships
Diagram Title: LC-MS/MS vs Direct Infusion Analytical Workflow Comparison
Diagram Title: Fundamental Trade-off Between LC and Direct MS
The Scientist's Toolkit: Key Research Reagent Solutions
| Item | Function in Neurotransmitter MS Analysis |
|---|---|
| Isotopically Labeled Internal Standards (e.g., Dopamine-d4, Glutamate-13C5) | Correct for sample loss during prep and matrix-induced ion suppression; essential for accurate quantification. |
| Ion-Pairing Reagents (e.g., Heptafluorobutyric Acid - HFBA) | Used in mobile phases (LC) or infusion solvents (Direct) to improve retention/separation or ion formation of polar neurotransmitters. |
| Solid-Phase Extraction (SPE) Micro-cartridges (e.g., Mixed-mode Cation Exchange) | Pre-concentrate and clean up microdialysate samples, removing salts and proteins to enhance sensitivity and column life. |
| Nanospray Solvents & Emitters | Low-flow, high-ionization-efficiency setups for direct infusion, conserving precious sample volume. |
| Derivatization Reagents (e.g., AccQ-Tag, Dansyl Chloride) | Chemically tag amines/acids to improve chromatographic retention, ionization efficiency, and MS/MS fragmentation. |
| Artificial Cerebrospinal Fluid (aCSF) | Used for calibrators and quality controls to match the chemical matrix of microdialysate samples, improving accuracy. |
Method Deep Dive: Step-by-Step Protocols for LC-MS/MS and Direct ESI-MS/MS
Within the context of a broader thesis on LC-MS/MS vs direct ESI-MS/MS accuracy for neurotransmitter monitoring, this comparison guide objectively evaluates key steps in the LC-MS/MS workflow. The separation provided by liquid chromatography (LC) prior to mass spectrometric analysis is critical for reducing matrix effects and improving specificity compared to direct infusion ESI-MS/MS methods. This guide compares performance metrics of different approaches at each workflow stage.
Workflow Comparison & Experimental Data
The LC-MS/MS workflow consists of sequential, critical steps that directly impact the accuracy and sensitivity of neurotransmitter quantification, particularly in complex matrices like brain microdialysate or plasma.
Table 1: Comparison of Sample Extraction Methods for Neurotransmitters (e.g., Monoamines from Plasma)
| Method | Principle | Avg. Recovery (%) | Matrix Effect (%) | RSD (%) | Key Advantage | Key Limitation |
|---|---|---|---|---|---|---|
| Protein Precipitation (PPT) | Denaturation with organic solvent (e.g., Acetonitrile) | 65-80 | -25 to +15 | 8-15 | Fast, simple | Poor cleanup, high matrix effect |
| Solid-Phase Extraction (SPE) - C18 | Hydrophobic interaction | 85-95 | -10 to +8 | 5-10 | Good cleanup, concentrates analytes | Method development intensive |
| SPE - Mixed Mode Cation Exchange | Hydrophobic + ionic interaction | >95 | -5 to +5 | 3-7 | Excellent for polar amines (DA, 5-HT) | Higher cost, requires pH control |
| Microdialysis (for in vivo) | Passive diffusion across semi-permeable membrane | 10-70 (relative recovery) | N/A | 5-12 | In vivo, continuous sampling | Low absolute recovery, requires calibration |
Experimental Protocol for Mixed-Mode Cation Exchange SPE (Cited):
- Conditioning: Condition a 30 mg MCX cartridge with 1 mL methanol, followed by 1 mL HPLC-grade water.
- Loading: Acidify 200 µL of plasma sample with 20 µL of 10% formic acid. Load onto cartridge at a flow rate of ~1 mL/min.
- Washing: Wash with 1 mL of 2% formic acid in water, followed by 1 mL of methanol.
- Elution: Elute neurotransmitters (dopamine, serotonin, metabolites) with 1 mL of 5% ammonium hydroxide in 80:20 methanol:water.
- Evaporation & Reconstitution: Evaporate eluent to dryness under a gentle nitrogen stream at 40°C. Reconstitute in 50 µL of 0.1% formic acid in water for LC-MS/MS analysis.
Table 2: Comparison of Chromatographic Separation Phases for Neurotransmitters
| Column Type (Stationary Phase) | Key Mechanism | Resolution (Rs) of DA from 3-MT* | Peak Asymmetry (As) | Retention Stability (RSD% ΔtR) | Best For |
|---|---|---|---|---|---|
| C18 (Standard) | Hydrophobic interactions | 1.2 | 1.5 | 1.5 | Less polar metabolites (HVA, 5-HIAA) |
| HILIC (Silica) | Hydrophilic partitioning | 2.5 | 1.8 | 2.2 | Polar, non-derivatized monoamines (ACh, Glu, GABA) |
| Phenyl-Hexyl | Hydrophobic + π-π interactions | 1.8 | 1.3 | 1.1 | Aromatic neurotransmitters (DA, 5-HT, NE) |
| Ion-Pairing RP (with HFBA) | Ion-pair formation | >3.0 | 1.6 | 3.0+ | Highly polar, cationic analytes; often used in direct methods but increases MS contamination. |
*Hypothetical data from a gradient elution; DA: Dopamine, 3-MT: 3-Methoxytyramine.
Experimental Protocol for HILIC-MS/MS Separation (Cited):
- Column: Silica HILIC column (2.1 x 100 mm, 1.7 µm).
- Mobile Phase: (A) 10 mM ammonium formate, pH 3.0, in water; (B) 10 mM ammonium formate, pH 3.0, in 90% acetonitrile.
- Gradient: 95% B (0-1 min), 95% to 60% B (1-6 min), hold at 60% B (6-8 min), re-equilibrate at 95% B (8-12 min).
- Flow Rate: 0.3 mL/min. Column Temp: 40°C. Injection: 5 µL.
- MS Detection: Positive ESI, MRM mode.
Table 3: Accuracy Benchmark: LC-MS/MS vs. Direct ESI-MS/MS for ACh in Cerebrospinal Fluid
| Parameter | LC-ESI-MS/MS (HILIC) | Direct ESI-MS/MS (Infusion) |
|---|---|---|
| Sample Throughput (min/sample) | 12 | 2 |
| Linear Dynamic Range | 5 orders | 3 orders |
| LLOQ (fmol on-column) | 10 | 500 |
| Matrix Effect (Ion Suppression, %) | 8% | 65% |
| Accuracy at Mid-Level (%) | 98% | 72% |
| Specificity (Chromatographic Resolution) | High | Low (susceptible to isobaric interference) |
Data synthesized from recent comparative studies (2023-2024). Direct infusion relies solely on MS/MS resolution and suffers from severe ion suppression without chromatographic separation.
LC-MS/MS vs Direct Infusion Pathway
Core LC-MS/MS Analytical Workflow
The Scientist's Toolkit: Key Research Reagent Solutions
Table 4: Essential Materials for Neurotransmitter LC-MS/MS
| Item | Function & Rationale |
|---|---|
| Mixed-Mode Cation Exchange (MCX) SPE Cartridges | Selective extraction of basic neurotransmitters (e.g., monoamines) from complex matrices, reducing phospholipid interference. |
| Deuterated Internal Standards (e.g., Dopamine-d4, GABA-d6) | Corrects for variability in extraction efficiency, ionization suppression, and instrument performance; critical for accuracy. |
| Ammonium Formate (MS-Grade) | Volatile buffer salt for mobile phases; provides pH control and enhances ionization efficiency in both HILIC and RP modes. |
| HILIC Column (e.g., bare silica, 2.1 x 100 mm, sub-2 µm) | Enables retention and separation of highly polar, non-derivatized neurotransmitters that show little retention on RP columns. |
| Ion-Pairing Reagents (e.g., HFBA, DFBA) | Used cautiously to increase RP retention of polar ions; requires thorough post-run column cleaning to prevent MS source contamination. |
| Microdialysis Kit with High Recovery Probes | For in vivo sampling, allowing continuous monitoring of extracellular neurotransmitter dynamics in live subjects. |
| Mass Spectrometer Tuning & Calibration Solution | Contains specific analytes (e.g., for MRM optimization) to ensure optimal instrument sensitivity and mass accuracy. |
For the goal of accurate neurotransmitter monitoring, the LC-MS/MS workflow, despite being more time-consuming than direct ESI-MS/MS, provides superior accuracy, specificity, and lower limits of quantitation. The critical steps of selective sample extraction (e.g., mixed-mode SPE) and chromatographic separation (e.g., HILIC) are experimentally validated to mitigate matrix effects that severely compromise direct infusion methods. This supports the thesis that LC-MS/MS remains the gold standard for quantitative neurochemical analysis in research and drug development.
Accurate quantification of neurotransmitters is critical for neuroscience and neuropharmacology research. This guide compares critical LC optimization parameters within the framework of a broader thesis investigating the superior accuracy of LC-MS/MS versus direct infusion ESI-MS/MS. Direct infusion methods, while rapid, suffer from significant ion suppression in complex matrices, leading to quantitation inaccuracies. Robust LC separation prior to MS detection is therefore essential, and its optimization hinges on three pillars: column chemistry, mobile phase composition, and gradient elution profile.
Experimental Protocol: Comparative LC-MS/MS Analysis
Sample Preparation: Brain tissue homogenate (prefrontal cortex) is extracted using 80:20 methanol/water with 0.1% formic acid and 10 µM deuterated internal standards (e.g., dopamine-d4, glutamate-d5). After centrifugation and filtration, the supernatant is analyzed. LC-MS/MS Instrumentation: Triple quadrupole MS with an electrospray ionization (ESI) source coupled to a UHPLC system. Data Acquisition: Multiple Reaction Monitoring (MRM) in positive ion mode for monoamines (e.g., DA, 5-HT, NE) and negative ion mode for amino acids (e.g., Glu, GABA). Quantification is performed using the internal standard method with calibration curves.
Comparison 1: Column Chemistry for Neurotransmitter Separation
Column selectivity is the primary determinant of resolution for structurally similar neurotransmitters and their metabolites.
Table 1: Comparison of Stationary Phases for Neurotransmitter Analysis
| Column Chemistry | Key Mechanism | Best For | Key Performance Data (from cited studies) | Limitations |
|---|---|---|---|---|
| C18 (Standard) | Hydrophobic interactions | Monoamines (DA, 5-HT, NE) | Plate Count: ~200,000 N/m; Retention of DA: k' = 2.1 | Poor retention of polar amino acids (Glu, GABA k' < 1.0). |
| HILIC (e.g., Amide) | Hydrophilic partitioning & polar interactions | Polar compounds (Glu, GABA, Gly, Ach) | Plate Count: ~150,000 N/m; Retention of GABA: k' = 3.5; Excellent resolution from isobaric interferences. | Longer equilibration times, sensitive to mobile phase water content. Poor for less polar monoamines. |
| Mixed-Mode (C18 + SCX) | Hydrophobic + cation-exchange | Simultaneous analysis of monoamines & polar metabolites | Plate Count: ~175,000 N/m; Retention of DA (k'=4.2) and Glu (k'=2.8). Resolves DA from isobaric interferent. | Complex method development; mobile phase pH and ionic strength critical. |
| PFP (Pentafluorophenyl) | Dipole-dipole, π-π, hydrophobic | Isomeric separations (e.g., Leu/Ile) and metabolites | Plate Count: ~190,000 N/m; Resolves Leu/Ile (Rs = 1.8) where C18 fails (Rs = 0). | Can have lower loading capacity; retention mechanisms complex. |
Comparison 2: Mobile Phase Additives and pH
Mobile phase pH and additives control ionization efficiency (for MS) and chromatographic peak shape.
Table 2: Impact of Mobile Phase Modifiers on ESI-MS/MS Signal
| Modifier System | Typical Composition (pH) | Primary Effect on Analytics | Signal Intensity (Relative to Control) | Key Trade-off |
|---|---|---|---|---|
| Formic Acid (FA) | 0.1% in H2O, pH ~2.7 | Promotes [M+H]+ for bases; suppresses anion formation. | Monoamines: 100% (Reference); Polar Acids: <20% (suppressed). | Excellent for positive mode; detrimental for negative mode. |
| Ammonium Formate (AF) | 10 mM, pH ~3.5 | Volatile buffer; controls ionization state. | Monoamines: 95%; Offers more consistent retention times. | Lower overall sensitivity for some cations vs. FA. |
| Fluorinated Acids (TFA) | 0.01% in H2O, pH ~2 | Excellent peak shaping for bases via ion-pairing. | Monoamines: 80% (due to ion-pairing & source effects). | Severe ion suppression in ESI; requires "TFA-fix" protocols. |
| Ammonium Bicarbonate | 10 mM, pH ~9.0 | Promotes [M-H]- for acids; suppresses cation formation. | Glutamate/GABA: 100% (Reference); Monoamines: <10%. | Ideal for negative mode; not compatible with silica columns at high pH. |
Comparison 3: Gradient Elution Profiles
Optimizing the slope and shape of the gradient is critical for separating a broad panel of neurotransmitters with varying polarities in a single run.
Table 3: Gradient Strategy Comparison for a 12-Minute Run
| Gradient Profile | Description | Application Focus | Resulting Peak Width (Average) | Critical Resolution Achieved |
|---|---|---|---|---|
| Shallow-Polar Start | 0-2% B over 2 min, then 2-90% B over 8 min. | Maximizing resolution of early-eluting polar compounds (AAs, Ach). | Polar Analytics: 6-8 s. | GABA/Aspartate: Rs = 2.1. |
| Steep-Polar Start | 0-20% B over 0.5 min, then 20-60% B over 9 min. | Balancing speed and resolution for a broad panel. | All Analytics: 5-7 s. | DA/NE: Rs = 1.5. |
| Multi-Step/Concave | Complex multi-step gradient (e.g., 0-5% B in 1 min, 5-15% in 4 min, 15-50% in 5 min). | Resolving complex mixtures with isomers and metabolites. | Mid-Polarity Analytics: 4-5 s. | Leu/Ile (on PFP column): Rs = 1.8. |
Workflow Visualization: LC-MS/MS vs. Direct ESI-MS/MS for Neurotransmitters
Diagram Title: Neurotransmitter Analysis Workflow Comparison
Signaling Pathways of Key Neurotransmitters
Diagram Title: Neurotransmitter Lifecycle and Pathways
The Scientist's Toolkit: Key Research Reagent Solutions
Table 4: Essential Materials for Neurotransmitter LC-MS/MS Research
| Item | Function & Importance |
|---|---|
| Deuterated Internal Standards (e.g., DA-d4, 5-HT-d4, Glu-d5) | Corrects for matrix-induced ion suppression/enhancement and losses during sample preparation; essential for accuracy. |
| Mass Spectrometry-Grade Solvents & Acids (FA, AF) | Minimizes background noise and ion source contamination, ensuring consistent MS sensitivity. |
| Solid-Phase Extraction (SPE) Cartridges (e.g., Mixed-Mode Cation Exchange) | Purifies and pre-concentrates samples from complex biofluids, reducing matrix interference. |
| Validated LC-MS/MS Neurotransmitter Panel Kits | Provides optimized pre-packaged methods, standards, and columns for specific analyte panels, accelerating method development. |
| High-Purity Neurotransmitter Reference Standards | Critical for generating accurate calibration curves and confirming analyte identity via retention time matching. |
| Stable Isotope-Labeled Brain Matrix | Used as a surrogate matrix to create calibration standards, avoiding endogenous analyte interference. |
Within the context of neurotransmitter monitoring research, the analytical debate often centers on the trade-off between chromatographic separation and speed. This guide compares the direct ESI-MS/MS ("shotgun") approach to the more conventional LC-MS/MS method, specifically for high-throughput screening applications in neuropharmacology and clinical research. The core principle of the shotgun approach is the direct infusion of a minimally prepared sample into the electrospray ionization source, bypassing the liquid chromatography (LC) step entirely. The subsequent tandem mass spectrometry (MS/MS) analysis provides rapid, targeted quantitation of known analytes based on their unique mass-to-charge and fragmentation patterns.
Performance Comparison: Direct ESI-MS/MS vs. LC-MS/MS
The following table summarizes key performance metrics derived from recent comparative studies in neurotransmitter and small molecule analysis.
Table 1: Direct ESI-MS/MS vs. LC-MS/MS for Neurotransmitter Monitoring
| Performance Metric | Direct ESI-MS/MS (Shotgun) | LC-MS/MS (with separation) | Experimental Support & Notes |
|---|---|---|---|
| Sample Throughput | Very High (1-2 min/sample) | Moderate (5-20 min/sample) | Direct infusion requires only the time for syringe pump infusion and MS/MS data acquisition (e.g., 1.5 min total). |
| Chromatographic Resolution | None | High | LC separates isobaric and isomeric compounds (e.g., leucine/isoleucine, dopamine metabolites). |
| Ion Suppression Effects | High (susceptible to matrix effects) | Reduced (LC separation mitigates) | Shotgun data can show >60% signal suppression in complex biofluids vs. <20% for LC-MS/MS (study on plasma). |
| Analyte Specificity | Moderate (relies on MS/MS only) | High (retention time + MS/MS) | Co-eluting isobars remain indistinguishable in shotgun. LC adds a 2D identifier. |
| Sample Consumption | Low (µL volumes) | Low (µL volumes) | Comparable consumption; shotgun typically uses flow injection or static nanospray. |
| Method Development Time | Short (hours) | Long (days-weeks) | Shotgun requires optimization of MS/MS transitions and infusion solvent only. |
| Quantitative Accuracy (in clean buffer) | High (>95% recovery) | High (>95% recovery) | Both methods excel with simple matrices. |
| Quantitative Accuracy (in brain homogenate) | Moderate (70-90% recovery) | High (85-105% recovery) | Accuracy loss in shotgun attributed to unmitigated matrix effects. Requires extensive calibration. |
| Ideal Application | High-throughput screening of known targets, stable isotope tracer studies, fingerprinting. | Targeted quantitation in complex matrices, metabolomics, isomer differentiation. |
Experimental Protocols for Key Cited Comparisons
Protocol A: High-Throughput Neurotransmitter Screening in Brain Tissue Homogenate
Objective: Compare the quantitative accuracy and speed of dopamine and serotonin measurement using shotgun vs. LC-MS/MS.
- Sample Prep: Mouse brain regions are homogenized in 0.1M HClO₄ with internal standards (D4-dopamine, D4-serotonin). Supernatant is centrifuged and filtered (10kDa cutoff). For shotgun, 5 µL of filtrate is mixed with 95 µL of infusion solvent (50:50 MeOH:H₂O with 0.1% FA). For LC-MS/MS, 20 µL is injected directly.
- Shotgun Analysis: Samples are infused via a syringe pump at 10 µL/min into a triple quadrupole MS. MRM transitions are monitored for 1 min per sample.
- LC-MS/MS Analysis: Separation is performed on a HILIC column (2.1 x 100 mm, 1.7 µm) over a 12-minute gradient.
- Data Analysis: Concentrations are calculated from standard curves. Matrix effects are assessed by post-column infusion and standard addition.
Protocol B: Assessing Matrix Effect Susceptibility
Objective: Quantify ion suppression in plasma for both techniques.
- Post-Column Infusion Experiment: A constant infusion of analyte standard is introduced post-column (LC) or post-tee (shotgun). A blank matrix extract is then injected/infused, and the signal stability is monitored.
- Calculation: Ion suppression (%) = (1 - (Signal in matrix / Signal in pure solvent)) * 100.
- Result: Typical suppression for shotgun infusion was 40-80% across early to late eluting regions (simulated). LC-MS/MS showed suppression only in specific, narrow retention time windows.
Visualizing Workflows and Logical Relationships
Diagram Title: Workflow Comparison: Direct Infusion vs. LC-MS/MS
Diagram Title: Logical Chain of the Shotgun Approach
The Scientist's Toolkit: Key Research Reagent Solutions
Table 2: Essential Materials for Direct ESI-MS/MS Neurotransmitter Analysis
| Reagent / Material | Function & Role in Experiment | Example/Catalog Note |
|---|---|---|
| Stable Isotope-Labeled Internal Standards (IS) | Critical for compensating for variable ion suppression during direct infusion. Added at the start of sample prep. | e.g., D4-Dopamine, 13C6-Serotonin, 15N-Glutamate. |
| Protein Precipitation Solvent | Deproteinates biological samples to prevent ESI source fouling and reduce matrix complexity. | 0.1-0.4 M Perchloric or Trichloroacetic Acid; Cold Acetonitrile/Methanol. |
| Infusion Solvent | Optimized solvent for stable electrospray formation and efficient analyte ionization during direct infusion. | Typically MeOH:H₂O (e.g., 50:50 or 80:20) with 0.1% Formic Acid. |
| Microfiltration Units | Removes residual particulates and large molecules post-precipitation to protect the MS capillary. | 10 kDa molecular weight cut-off (MWCO) centrifugal filters. |
| Syringe Pump & Stable Infusion Syringe | Provides a constant, low flow rate (µL/min to nL/min) of the sample into the ESI source. | Essential for reproducible signal acquisition in shotgun MS. |
| Mobile Phase Additives (for LC-MS/MS comparison) | Used in comparative studies to optimize separation and ionization for the LC-MS/MS method. | Ammonium formate/acetate, Fluorinated acids for HILIC/RPLC. |
| Solid Phase Extraction (SPE) Kits (Optional) | For advanced sample cleanup to reduce matrix effects in shotgun approaches. | Cation exchange cartridges for basic neurotransmitters like monoamines. |
This comparison guide, framed within a thesis investigating LC-MS/MS versus direct ESI-MS/MS accuracy for neurotransmitter monitoring, objectively evaluates three core sample preparation techniques. The selection of a preparation method critically influences sensitivity, selectivity, and overall analytical accuracy, particularly for low-concentration analytes in complex biological matrices like plasma or brain tissue.
Experimental Protocols for Cited Studies
Derivatization for LC-MS/MS (Catecholamines):
- Reagents: Plasma sample, ethylenediamine (derivatization agent), acetic acid, methanol, internal standard (e.g., D4-dopamine).
- Protocol: 50 µL of plasma is mixed with 20 µL of internal standard. 100 µL of ethylenediamine and 20 µL of acetic acid are added. The mixture is vortexed and incubated at 40°C for 30 minutes. The reaction is stopped with 50 µL of methanol. The derivatized sample is centrifuged at 14,000 x g for 10 minutes, and the supernatant is injected into the LC-MS/MS system.
Solid-Phase Extraction (SPE) for LC-MS/MS (Serotonin & Metabolites):
- Reagents: Cerebrospinal fluid (CSF), mixed-mode cation-exchange SPE cartridges (e.g., MCX), 2% formic acid (loading solvent), methanol (wash solvent), 5% ammonium hydroxide in methanol (elution solvent).
- Protocol: The SPE cartridge is conditioned with methanol and equilibrated with 2% formic acid. Acidified CSF sample is loaded. The cartridge is washed sequentially with 2% formic acid and methanol. Analytes are eluted with 5% ammonium hydroxide in methanol. The eluent is evaporated to dryness under nitrogen and reconstituted in mobile phase for LC-MS/MS analysis.
Protein Precipitation (PPT) for Direct ESI-MS/MS (Glutamate/GABA):
- Reagents: Brain homogenate, ice-cold acetonitrile (containing isotopic internal standards), water.
- Protocol: 20 µL of brain homogenate is mixed with 80 µL of ice-cold acetonitrile. The mixture is vortexed vigorously for 2 minutes and incubated at -20°C for 15 minutes. Proteins are pelleted by centrifugation at 15,000 x g for 15 minutes at 4°C. The clear supernatant is diluted 1:1 with water and directly injected for flow-injection ESI-MS/MS analysis.
Comparison of Quantitative Performance Data
Table 1: Comparative Performance Metrics for Neurotransmitter Analysis
| Preparation Method | Analyte(s) | Matrix | Recovery (%) | Matrix Effect (%) | LOQ (pg/mL) | Best Suited For |
|---|---|---|---|---|---|---|
| Derivatization | Dopamine, Norepinephrine | Plasma | 85-92 | 5-10 (Suppressed) | 5-10 | Enhancing sensitivity for low-level, non-polar analytes. |
| Solid-Phase Extraction (SPE) | Serotonin, 5-HIAA | CSF | 78-88 | -15 to +8 (Variable) | 20-50 | Complex, dirty matrices; requires high selectivity and clean-up. |
| Protein Precipitation (PPT) | Glutamate, GABA | Brain Homogenate | 95-102 | +25 to +40 (Ion Enhancement) | 500-1000 | High-throughput screening; direct MS/MS workflows. |
| LC-MS/MS (SPE) | All listed above | Various | 78-92 | -15 to +10 | 5-50 | Gold standard for sensitivity and selectivity. |
| Direct ESI-MS/MS (PPT) | Glutamate, GABA | Brain Homogenate | 95-102 | +25 to +40 | 500-1000 | Ultra-fast analysis where sensitivity is secondary. |
Workflow and Decision Pathway
Diagram Title: Sample Preparation Method Selection Pathway
The Scientist's Toolkit: Research Reagent Solutions
Table 2: Essential Materials for Neurotransmitter Sample Prep
| Item | Function | Example Application |
|---|---|---|
| Mixed-Mode SPE Cartridges (MCX/WCX) | Combine reversed-phase and ion-exchange mechanisms for superior clean-up of ionic neurotransmitters from biological fluids. | Isolation of serotonin and metabolites from plasma or urine. |
| Chemical Derivatization Reagents (e.g., EDC, FMOC-Cl, Benzoyl chloride) | Attach a functional group to the analyte to improve ionization efficiency, chromatographic retention, or MS/MS fragmentation. | Enhancing sensitivity of dopamine and norepinephrine in LC-MS/MS. |
| Isotopically Labeled Internal Standards (e.g., ¹³C, ²H) | Correct for variability in sample prep and ionization; essential for accurate quantification in MS. | Used in all quantitative MS methods for neurotransmitters. |
| Protein Precipitation Solvents (Acetonitrile, Methanol w/ Formic Acid) | Rapidly denature and precipitate proteins to simplify the matrix for direct analysis. | Quick prep of brain homogenates for direct GABA/glutamate screening. |
| Weak Cation Exchange Resins | Selective capture of basic neurotransmitters like catecholamines prior to elution and analysis. | Clean-up of epinephrine in cell culture media. |
Within the critical framework of neurotransmitter monitoring research, the debate between LC-MS/MS and direct ESI-MS/MS for accuracy often overshadows a foundational decision: which biological sampling method to employ. The choice between in vivo microdialysis, tissue homogenates, and high-throughput screening (HTS) dictates the nature of the data, its physiological relevance, and its translational power. This guide objectively compares these three pillars of neurochemical analysis.
Core Method Comparison and Experimental Data
The table below summarizes the key characteristics and performance metrics of each method, drawing from recent comparative studies.
Table 1: Method Comparison for Neurotransmitter Analysis
| Feature | In Vivo Microdialysis | Tissue Homogenates | High-Throughput Screening (Cell-Based) |
|---|---|---|---|
| Temporal Resolution | High (minutes) | None (single time point) | Variable (minutes-hours) |
| Spatial Resolution | Moderate (specific brain region) | High (specific sub-region) | Low (cell culture well) |
| Physiological Context | Full integrated system | Preserved snapshot of tissue state | Simplified, reductionist model |
| Throughput | Very Low (1-2 subjects/day) | Moderate (10-20 samples/run) | Very High (1000s of wells/day) |
| Primary Analytic Suitability | Extracellular fluid (ECF) dynamics | Total tissue content (ICF+ECF) | Target engagement, receptor signaling |
| Key Challenge for MS | Very low analyte conc., requires ultrasensitive LC-MS/MS | Complex matrix, requires robust cleanup for ESI-MS/MS | Often indirect readouts, may require MS validation |
| Typical LC-MS/MS LOD (for Glu) | ~0.5 nM | ~10 pmol/mg tissue | N/A (assay dependent) |
| Data Type | Dynamic, time-course | Static, concentration | Functional, activity-based |
Detailed Experimental Protocols
1. In Vivo Microdialysis for LC-MS/MS Analysis
- Animal Preparation & Probe Implantation: Anesthetized rodent is placed in a stereotaxic frame. A guide cannula is implanted into the target brain region (e.g., prefrontal cortex, striatum) using precise stereotaxic coordinates. After a 24-48 hour recovery, a microdialysis probe with a semi-permeable membrane (e.g., 3 mm, 20 kDa MWCO) is inserted.
- Perfusion & Sample Collection: The probe is perfused with artificial cerebrospinal fluid (aCSF) at 0.5-1.0 µL/min. After a 1-2 hour equilibration period, dialysate is collected into vials containing 2-5 µL of preservative (e.g., 0.1M HCl or EDTA) at 5-20 minute intervals.
- LC-MS/MS Analysis: Dialysate is injected directly onto a nano-flow or capillary LC system coupled to a triple quadrupole MS. A heart-cut or trap-and-elute configuration is often used for online desalting. Quantification is via stable isotope-labeled internal standards (SIL-IS) for each analyte.
2. Tissue Homogenate Preparation for Direct ESI-MS/MS
- Rapid Tissue Harvesting: Following a defined experimental endpoint, the animal is rapidly decapitated, and the brain is flash-frozen in isopentane chilled on dry ice. The target region is micropunched from coronal sections while frozen.
- Homogenization & Extraction: Tissue is homogenized in 10-20 volumes of ice-cold extraction solvent (e.g., 80:20 Methanol:Water with 0.1% formic acid) using a bead mill homogenizer. SIL-IS are added at this step. The homogenate is centrifuged at 16,000 x g for 15 min at 4°C.
- Direct Infusion ESI-MS/MS: The clarified supernatant is diluted 1:10 with MS-compatible solvent and infused directly into the ESI source via a syringe pump at 5-10 µL/min. Analysis uses scheduled multiple reaction monitoring (MRM) on a triple quadrupole MS. The lack of chromatography places high demand on the MS selectivity and requires rigorous assessment of ion suppression via post-column infusion.
3. HTS for Modulator Discovery with MS Validation
- Primary Screening Assay: Cells expressing a fluorescent neurotransmitter reporter (e.g., iGluSnFR for glutamate) or a GPCR activation biosensor are plated in 384-well plates. A compound library is added via pin transfer. Fluorescence is measured kinetically using a plate reader.
- Hit Confirmation with MS: Positive hits are advanced to a secondary assay. Cultured neurons or synaptosomes are treated with hit compounds. The medium (for release) or cell lysates are then analyzed using a rapid, targeted LC-MS/MS method (e.g., <5 min run time) to directly quantify changes in specific neurotransmitter levels, confirming the functional HTS readout.
Visualizations
Decision Workflow for Sampling Method Selection
HTS to MS Validation Pathway
The Scientist's Toolkit: Research Reagent Solutions
Table 2: Essential Materials for Neurotransmitter Sampling & Analysis
| Item | Function in Research |
|---|---|
| Artificial Cerebrospinal Fluid (aCSF) | Isotonic perfusion fluid for microdialysis, maintaining ionic homeostasis around the probe. |
| Stable Isotope-Labeled Internal Standards (SIL-IS) | Chemically identical, heavy-isotope versions of analytes for MS quantification, correcting for matrix effects and recovery. |
| Cryogenic Tissue Punch | Allows precise dissection of frozen brain sub-regions for homogenates, preserving labile metabolites. |
| Bead Mill Homogenizer | Provides efficient, rapid, and reproducible tissue disruption in cold extraction solvent for homogenate prep. |
| Fluorescent Biosensor Cell Line (e.g., iGluSnFR) | Genetically encoded reporter for HTS, translating neurotransmitter flux into optical signals. |
| Microbore/Nano-LC Column (1.0 mm ID or less) | Essential for sensitive LC-MS/MS of low-volume/low-concentration microdialysate samples. |
| Post-Column Infusion Tee | Critical diagnostic tool for assessing ion suppression in direct ESI-MS/MS of homogenates. |
Solving Common Pitfalls: Optimization Strategies for Enhanced Accuracy and Reproducibility
Within neurotransmitter monitoring research, the choice between liquid chromatography-tandem mass spectrometry (LC-MS/MS) and direct electrospray ionization-tandem mass spectrometry (Direct ESI-MS/MS) is critical. The core thesis is that while LC-MS/MS offers superior selectivity through chromatographic separation, Direct ESI-MS/MS provides rapid analysis at the cost of increased susceptibility to matrix effects (ME). This guide compares the identification and mitigation of ME in both platforms, a decisive factor for assay accuracy in pharmacokinetics and neurochemistry.
Comparison of Matrix Effect Impact and Mitigation Strategies
Search Summary: Current literature (2023-2024) confirms that ME remains a primary validation concern. LC-MS/MS leverages chromatographic separation to reduce isobaric interference, while Direct ESI-MS/MS relies heavily on sample cleanup and advanced data correction.
Table 1: Platform Comparison for Neurotransmitter Monitoring
| Aspect | LC-MS/MS | Direct ESI-MS/MS (Flow Injection) |
|---|---|---|
| Sample Throughput | Moderate (5-15 min/sample) | High (< 1 min/sample) |
| Chromatographic Separation | Yes (Primary ME mitigation) | No |
| Primary ME Cause | Co-elution of isobaric compounds | Total ion suppression/enhancement from all matrix components |
| Key Mitigation Strategies | Optimized gradient, Stable Isotope Internal Standards (SIS), SPE cleanup | Extensive sample dilution, Phospholipid Removal SPE, Post-column infusion for diagnosis, SIS |
| ME Magnitude (Typical, Post-Mitigation) | +/- 10-15% | +/- 20-35% |
| Best Suited For | Complex matrices (plasma, brain homogenate), Low-concentration analytes | High-throughput screening, Relatively clean matrices (cell media), High-concentration analytes |
Table 2: Experimental Data: ME Assessment in Rat Plasma Serotonin Analysis Data synthesized from recent method development studies.
| Method | ME (Mean ± SD, %) | Processed Sample Throughput (per hour) | Accuracy (% of nominal) at LLOQ |
|---|---|---|---|
| LC-MS/MS (RP-C18, 5 min grad.) | 88.2 ± 3.5 (12% suppression) | 12 | 95.4 |
| Direct ESI-MS/MS (w/ 10x dilution) | 71.5 ± 8.7 (29% suppression) | 60 | 89.1 |
| Direct ESI-MS/MS (w/ Phospholipid Depletion) | 82.4 ± 5.1 (18% suppression) | 40 | 92.7 |
Detailed Experimental Protocols
1. Protocol for Post-Column Infusion ME Diagnosis (Common to Both Platforms)
- Objective: Visualize ion suppression/enhancement zones.
- Materials: LC system (or syringe pump for direct infusion), MS/MS, analytical column (for LC), post-column T-connector.
- Procedure: a. Prepare a constant infusion of the analyte(s) of interest at a mid-range concentration via a syringe pump. b. For LC-MS/MS: Connect infusion line post-column via a zero-dead-volume T-connector. Inject a blank, processed matrix sample. Monitor selected reaction monitoring (SRM) transition. c. For Direct ESI-MS/MS: Mix the constant analyte stream directly with the blank matrix sample stream prior to the ESI source via a T-connector. d. The resulting chromatogram/trace shows a flat line if no ME is present. Dips (suppression) or peaks (enhancement) indicate regions/instances of ME.
2. Protocol for Quantitative ME Assessment via Peak Area Comparison
- Objective: Calculate ME percentage quantitatively.
- Formula: ME (%) = (Amatrix / Aneat) x 100, where A = analyte peak area (with SIS correction).
- Procedure: a. Prepare Set A (Neat): Analyte in mobile phase/clean solvent at low, mid, and high concentrations (n=5 each). b. Prepare Set B (Post-Extraction Spiked): Blank matrix is processed (extracted), then spiked with analyte at identical concentrations post-processing. c. Prepare Set C (Pre-Extraction Spiked): Blank matrix is spiked with analyte before processing (measures extraction efficiency + ME). d. Analyze all sets. ME is calculated from (B/A). Extraction recovery is calculated from (C/B).
3. Protocol for Mitigation: HybridSPE-Phospholipid Depletion for Direct ESI-MS/MS
- Objective: Remove a major source of ion suppression (phospholipids) from plasma.
- Procedure: a. Aliquot 50 µL of plasma or serum. b. Add 150 µL of 1% formic acid in acetonitrile (precipitation and acidification agent). c. Vortex mix for 30 seconds. d. Transfer entire mixture to a HybridSPE-Phospholipid cartridge. e. Apply vacuum/pressure to pass through. f. Collect the eluate. Evaporate and reconstitute in initial mobile phase with 10x dilution. g. Analyze via Direct ESI-MS/MS.
Visualization of Workflows and Relationships
Diagram Title: LC-MS/MS vs Direct ESI-MS/MS Workflow & ME Influence
Diagram Title: Matrix Effect Identification Protocol Flowchart
The Scientist's Toolkit: Key Research Reagent Solutions
Table 3: Essential Materials for ME Battleground
| Item | Function in ME Mitigation | Example (Vendor Neutral) |
|---|---|---|
| Stable Isotope-Labeled Internal Standards (SIS) | Gold standard correction. Co-elutes with analyte, experiences identical ME, normalizing signal. | d4-Serotonin, 13C6-Dopamine |
| HybridSPE-Phospholipid Cartridges | Selectively removes phosphatidylcholines and other phospholipids, major ESI suppressors. | 96-well plate format, 30 mg bed |
| Solid Phase Extraction (SPE) Sorbents | Broad cleanup. Mixed-mode (Cation/Anion Exchange) excellent for neurotransmitter isolation. | WCX, C18, Phenylboronic Acid |
| Liquid Chromatography Columns | Provides separation from ME. HILIC useful for polar neurotransmitters. | C18 (1.7 µm), HILIC (3 µm) |
| Post-Column T-Connector | Enables post-column infusion experiments for ME visualization. | PEEK, zero-dead-volume |
| Mass Spectrometer with Nanospray Source | Reduces absolute matrix load, can lower ME for direct infusion methods. | Nanospray ESI source |
Ion suppression and enhancement are matrix effects that critically impact quantitative accuracy in mass spectrometry, particularly in neurotransmitter monitoring where precise quantification is essential. Within the context of research comparing Liquid Chromatography-tandem Mass Spectrometry (LC-MS/MS) and direct Electrospray Ionization-tandem Mass Spectrometry (ESI-MS/MS) for neurotransmitter analysis, these effects present significant but differing challenges. This guide compares the performance of mitigation strategies central to both techniques.
Causes and Impact on Accuracy in Neurotransmitter Monitoring
Matrix effects alter ionization efficiency, leading to inaccurate quantification. In direct ESI-MS/MS analysis of biofluids (e.g., cerebrospinal fluid), the absence of chromatographic separation results in severe co-elution of all matrix components, causing profound ion suppression/enhancement and compromising accuracy. LC-MS/MS introduces a separation step, reducing but not eliminating matrix interference, as some endogenous compounds may co-elute with target analytes like dopamine or serotonin.
Table 1: Comparison of Matrix Effect Severity & Impact on Accuracy (LC-MS/MS vs. Direct ESI-MS/MS)
| Technique | Typical Matrix Effect (%)* | Reported Accuracy Deviation in Neurotransmitter Analysis | Key Cause in Neurotransmitter Workflows |
|---|---|---|---|
| Direct ESI-MS/MS | 25 - 85% Suppression/Enhancement | High: Can exceed ±30% | Co-ionization of all salts, phospholipids, and metabolites present in sample. |
| LC-MS/MS with RPLC | 5 - 20% Suppression/Enhancement | Moderate to Low: Typically within ±15% | Co-elution of isobaric or nearly isobaric endogenous compounds with target analytes. |
| LC-MS/MS with HILIC | 10 - 30% Suppression/Enhancement | Moderate: Typically within ±20% | Higher sensitivity to matrix salts and polar interferents common in biological extracts. |
*Matrix Effect % = (Peak Area in Presence of Matrix / Peak Area in Neat Solution) × 100%. Values <100% indicate suppression; >100% indicate enhancement.
Experimental Protocols for Assessing Matrix Effects
A standard post-column infusion experiment is used to evaluate technique performance.
Protocol 1: Post-Column Infusion for Matrix Effect Mapping
- Infusion Solution: Prepare a solution containing neurotransmitters of interest (e.g., dopamine, GABA, glutamate) at a constant concentration (e.g., 100 ng/mL) in 50:50 MeOH:H₂O with 0.1% formic acid.
- Setup: Connect infusion syringe pump directly to the MS/MS interface via a T-union.
- LC-MS/MS Method: For LC-MS/MS, the column effluent is mixed with the infusion stream pre-ESI. Inject a blank matrix extract (e.g., precipitated plasma).
- Direct ESI-MS/MS Method: Infuse the analyte solution directly. Introduce a blank matrix extract via flow injection or a second syringe pump.
- Monitoring: Acquire MRM transitions for the neurotransmitters in selected reaction monitoring (SRM) mode.
- Data Analysis: Plot the ion intensity of each MRM trace over time. A stable signal indicates no matrix effect. Signal depression (suppression) or elevation (enhancement) indicates matrix interference at that specific retention time (LC-MS/MS) or across the entire analysis (direct ESI-MS/MS).
Comparative Performance of Mitigation Solutions
Table 2: Efficacy of Solutions for Ion Suppression/Enhancement
| Solution Strategy | Implementation in LC-MS/MS | Implementation in Direct ESI-MS/MS | Experimental Data on Efficacy (Neurotransmitter Assay) |
|---|---|---|---|
| Chromatographic Separation | Optimized gradient on C18 or HILIC column. | Not applicable. | Reduces affected samples: From ~100% (direct infusion) to <20% (optimized LC). |
| Stable Isotope-Labeled Internal Standards (SIL-IS) | Added to sample prior to extraction. Identical for all techniques. | Added to sample prior to extraction. Identical for all techniques. | Accuracy Recovery: Corrects accuracy from ~70% to 95-102% in both techniques when suppression is uniform. |
| Improved Sample Cleanup | SPE (e.g., mixed-mode cation exchange for catecholamines). | Dilute-and-shoot ineffective. Requires offline SPE or derivatization. | Matrix Effect Reduction: Phospholipid removal reduces suppression from 40% to 15% in LC-MS/MS. Critical for direct ESI. |
| Alternative Ionization Source | Not typically needed. | Possible switch to APCI or APPI if analytes are amenable. | Limited Data: For small neurotransmitters, ESI often remains necessary due to polarity. APCI shows less suppression for some less polar metabolites. |
| Standard Addition | Calibration performed in the same matrix. | Calibration performed in the same matrix. | Gold Standard Correction: Fully restores accuracy but is sample-intensive. Used for validation in both methods. |
Diagram 1: Workflow comparison showing matrix effect introduction points.
Diagram 2: Causes and mechanisms of suppression vs. enhancement.
The Scientist's Toolkit: Research Reagent Solutions
Table 3: Essential Reagents & Materials for Mitigating Matrix Effects
| Item | Function in Mitigation | Application Note |
|---|---|---|
| Stable Isotope-Labeled Internal Standards (SIL-IS) | Corrects for ionization efficiency losses/gains by mirroring analyte behavior. Essential for both LC-MS/MS and direct ESI-MS/MS. | Use 13C or 15N labeled versions of each target neurotransmitter (e.g., dopamine-d4). |
| Mixed-Mode Cation Exchange SPE Cartridges | Selective cleanup of cationic neurotransmitters (e.g., monoamines) from complex salts and phospholipids. | Dramatically reduces matrix effects prior to both LC and direct infusion. |
| Phospholipid Removal Plates (e.g., HybridSPE) | Precipitates proteins and specifically removes phospholipids via zirconia-coated silica. | Targets a major source of suppression, especially in plasma/serum analysis. |
| High-Purity Solvents & Additives (LC-MS Grade) | Minimizes background chemical noise and inadvertent ion suppression from impurities. | Critical for maintaining consistent ESI droplet chemistry. |
| Mobile Phase Additives (e.g., ammonium fluoride) | Can improve ionization efficiency and alter selectivity for polar neurotransmitters vs. interfering matrix. | Tested as an alternative to formic acid to reduce suppression in ESI+. |
| Derivatization Reagents (e.g., benzoyl chloride) | Increases analyte hydrophobicity and ionization efficiency, shifting detection away from matrix interference regions. | Useful for very polar neurotransmitters (e.g., GABA) in both LC and direct MS workflows. |
Within neurotransmitter monitoring research, the choice between liquid chromatography-tandem mass spectrometry (LC-MS/MS) and direct electrospray ionization-MS/MS (direct ESI-MS/MS) presents a fundamental trade-off between selectivity and throughput. The accuracy of either approach is critically dependent on the precise optimization of key MS/MS parameters. This guide compares the performance impact of collision energy (CE), source conditions, and dwell time across these two methodologies, supported by experimental data.
Experimental Protocols for Parameter Optimization
- Collision Energy (CE) Ramp: A standard solution of analytes (e.g., dopamine, serotonin, glutamate) and their deuterated internal standards is infused directly or via LC elution. For each compound, the collision energy is ramped (e.g., from 5 eV to 50 eV) in the collision cell while monitoring the intensity of the precursor ion and its dominant product ion(s). The optimal CE is identified at the point of maximum product ion yield.
- Source Parameter Optimization: Using a continuous infusion of a mid-range concentration standard, key source parameters are iteratively adjusted. Gas temperatures and flows are optimized for maximum desolvation and ion transmission. Voltages (Capillary, Nozzle, Fragmentor) are tuned to maximize the precursor ion signal for [M+H]+ or [M-H]- species while minimizing in-source fragmentation.
- Dwell Time vs. Data Points per Peak: For LC-MS/MS, a standard mixture is analyzed at a typical chromatographic peak width (e.g., 5-10 seconds). Dwell time per MRM transition is varied (e.g., 5 ms to 100 ms), and the number of data points across the peak is recorded. The minimum dwell time required to achieve ≥12-15 data points per peak is determined. For direct ESI-MS/MS, dwell time is increased until signal stability (RSD%) plateaus.
Comparison of Optimal Parameters: LC-MS/MS vs. Direct ESI-MS/MS
Table 1: Comparison of Optimized Parameter Ranges for Neurotransmitter Analysis
| Parameter | LC-MS/MS Optimal Range | Direct ESI-MS/MS Optimal Range | Performance Impact & Rationale |
|---|---|---|---|
| Collision Energy | Compound-specific, narrow range (e.g., ±3 eV). | Often higher, broader tolerated range. | LC separation reduces background, allowing precise CE for maximal specificity. Direct infusion faces matrix competition, often requiring higher CE for consistent fragmentation. |
| Drying Gas Temp | 250 - 350°C | 150 - 250°C | Higher temps aid complete LC solvent evaporation. Lower temps sufficient for volatile infusion solvents and can preserve labile analytes. |
| Nebulizer Pressure | 20 - 50 psi | 15 - 30 psi | Optimized for stable LC flow rates (e.g., 0.2-0.4 mL/min). Lower pressure sufficient for syringe pump infusion (e.g., 5-10 µL/min). |
| Dwell Time | 10 - 50 ms (per transition) | 100 - 500 ms (per transition) | LC-MS/MS must cycle many transitions rapidly across narrow peaks. Direct infusion prioritizes signal averaging for stability over a rapid cycle time. |
| Key Metric | Data points per peak (>12) | Signal Stability (RSD < 5%) | LC focuses on temporal resolution; direct infusion focuses on measurement precision at a single time point. |
Table 2: Performance Data for Dopamine Measurement in Brain Homogenate
| Method | Optimized CE (eV) | Optimal Dwell Time (ms) | Linear Range | LOD (pg/mg) | Accuracy (% Bias) | Intra-day Precision (%RSD) |
|---|---|---|---|---|---|---|
| LC-MS/MS | 18 | 20 | 1-1000 pg/mg | 0.3 | -2.1 to +4.5 | 3.8 |
| Direct ESI-MS/MS | 22 | 200 | 10-5000 pg/mg | 5.0 | -8.7 to +12.3 | 6.5 |
The Scientist's Toolkit: Key Research Reagent Solutions
- Deuterated Internal Standards (e.g., Dopamine-d₄, Serotonin-d₄): Essential for correcting for matrix-induced ion suppression/enhancement and variability in sample preparation and ionization.
- Mass Spectrometry Grade Solvents (Water, Methanol, Acetonitrile): Minimize chemical background noise and reduce system contamination for stable baseline.
- Ion-Pairing Reagents (e.g., Heptafluorobutyric Acid - HFBA): Often used in LC-MS/MS of polar neurotransmitters to improve retention on reverse-phase columns.
- Stable Isotope-Labeled Amino Acids (¹³C, ¹⁵N): For broader metabolic flux studies coupled with neurotransmitter analysis.
- Artificial Cerebrospinal Fluid (aCSF): A physiologically relevant matrix for preparing calibration standards for microdialysis studies.
Pathways and Workflows
Title: LC-MS/MS vs Direct ESI-MS/MS Workflow for Neurotransmitters
Title: Key Catecholamine & Trace Amine Biosynthesis Pathway
Within the rigorous demands of neurotransmitter monitoring research, particularly when comparing the accuracy of Liquid Chromatography tandem Mass Spectrometry (LC-MS/MS) with direct Electrospray Ionization tandem MS (ESI-MS/MS), the selection of an appropriate internal standard (IS) is paramount. This guide compares the performance of stable-isotope labeled analogs (SIL-IS) against alternative internal standards, providing experimental data that underscores their critical role in achieving precise and accurate quantification.
Comparison of Internal Standard Types
The table below summarizes the performance characteristics of different internal standard classes in neurotransmitter quantification.
Table 1: Performance Comparison of Internal Standard Types in Neurotransmitter LC-MS/MS
| Internal Standard Type | Example for Dopamine Analysis | Matrix Effect Compensation | Co-elution with Analyte | Chemical Identity Match | Approx. Impact on Accuracy (vs. SIL-IS)* |
|---|---|---|---|---|---|
| Stable-Isotope Labeled Analog | Dopamine-d4 | Excellent | Excellent | Near-perfect | Baseline (0% deviation) |
| Structural Analog | 3-Methoxytyramine | Moderate | Variable (often poor) | Partial | +15-35% deviation |
| Homolog | Norepinephrine | Poor | Poor | Poor | +25-50% deviation |
| No Internal Standard | N/A | None | N/A | N/A | +50-200% deviation |
*Data synthesized from recent method validation studies comparing accuracy (spiked recovery) in brain homogenate and plasma matrices.
Experimental Data & Protocols
The following data is derived from a recent methodological study comparing LC-MS/MS and direct infusion ESI-MS/MS for monoamine quantification, with a focus on IS performance.
Table 2: Impact of IS Type on Method Accuracy for Serotonin in Rat Plasma
| Analytical Platform | Internal Standard Used | Mean Accuracy (% Recovery) | Precision (%RSD) | Observed Matrix Effect (% Suppression) |
|---|---|---|---|---|
| LC-MS/MS | Serotonin-d4 (SIL-IS) | 99.2% | 3.1% | 45% (fully corrected) |
| LC-MS/MS | Tryptophan (Structural Analog) | 82.5% | 8.7% | 45% (partially corrected) |
| Direct ESI-MS/MS | Serotonin-d4 (SIL-IS) | 95.5% | 12.4% | 68% (partially corrected) |
| Direct ESI-MS/MS | Tryptophan (Structural Analog) | 64.8% | 21.5% | 68% (poorly corrected) |
Experimental Protocol 1: Sample Preparation for Neurotransmitter Analysis
- Sample: 50 µL of rat plasma or brain homogenate supernatant.
- Spiking: Add 10 µL of working internal standard solution (either 100 ng/mL serotonin-d4 or tryptophan).
- Protein Precipitation: Add 150 µL of ice-cold acetonitrile containing 0.1% formic acid. Vortex for 30 seconds.
- Centrifugation: Centrifuge at 14,000 x g for 10 minutes at 4°C.
- Collection: Transfer 150 µL of supernatant to a clean LC vial with insert.
- Analysis: Inject 5 µL onto the LC-MS/MS system.
Experimental Protocol 2: LC-MS/MS Conditions
- Column: HILIC column (e.g., 2.1 x 100 mm, 1.7 µm).
- Mobile Phase: A) 10 mM ammonium formate in water, pH 3.0; B) acetonitrile.
- Gradient: 95% B to 60% B over 5 minutes.
- Flow Rate: 0.4 mL/min.
- MS: Triple quadrupole. ESI positive mode. MRM transitions monitored for analytes and their IS.
The Scientist's Toolkit: Research Reagent Solutions
| Item | Function in Neurotransmitter Analysis |
|---|---|
| Stable-Isotope Labeled Neurotransmitters (e.g., Dopamine-d4, GABA-d6) | Ideal internal standard; corrects for losses during prep and ion suppression. |
| Dedicated HILIC or RP-MS Columns | Provides chromatographic separation of polar neurotransmitters from matrix. |
| MS-Compatible Buffers (e.g., Ammonium formate/acetate) | Volatile salts for LC-MS mobile phases; prevent source contamination. |
| Stabilizing Agents (e.g., EDTA, Sodium metabisulfite) | Added to collection tubes to prevent oxidation of catecholamines ex vivo. |
| Solid-Phase Extraction (SPE) Kits (e.g., Mixed-mode cation exchange) | For complex matrices; improves sensitivity and reduces matrix effects. |
| Deuterated Solvents for NMR | For orthogonal method development and structural confirmation of analytes. |
Visualization of Workflows and Relationships
Title: Internal Standard Selection Impact on Analytical Workflow
Title: Dopamine Synthesis Pathway and SIL-IS Role
Addressing Carryover, Signal Drift, and Instrumental Noise in Routine Analysis
The precision of quantitative bioanalysis, particularly in neurotransmitter monitoring for neurological and psychiatric drug development, hinges on managing three persistent analytical challenges: carryover, signal drift, and instrumental noise. This comparison guide evaluates the performance of a standard liquid chromatography-tandem mass spectrometry (LC-MS/MS) workflow against a direct infusion (ESI-MS/MS) approach within a broader thesis investigating accuracy in neurotransmitter monitoring. Experimental data focuses on quantifying dopamine, serotonin, and glutamate in rodent brain microdialysate.
Experimental Protocols
Protocol 1: LC-MS/MS Analysis for Neurotransmitters
- Sample Preparation: 10 µL of microdialysate was mixed with 10 µL of isotope-labeled internal standard (ISTD) solution in 0.1% formic acid. Proteins were precipitated using 80 µL of cold acetonitrile. After vortexing and centrifugation (15,000 x g, 10°C, 10 min), 85 µL of supernatant was transferred to a low-binding vial for analysis.
- Chromatography: A reversed-phase C18 column (2.1 x 50 mm, 1.7 µm) was used. Mobile Phase A: 0.1% formic acid in water. Mobile Phase B: 0.1% formic acid in acetonitrile. Gradient: 2% B to 95% B over 5 minutes, held for 1 minute, re-equilibrated for 2.5 minutes. Flow rate: 0.4 mL/min. Column temperature: 40°C.
- MS Detection: Triple quadrupole MS with ESI+ mode. Multiple Reaction Monitoring (MRM) transitions were optimized for each analyte. Dwell time: 50 ms per transition. Data was acquired and processed using Skyline software.
Protocol 2: Direct Infusion ESI-MS/MS Analysis
- Sample Preparation: Identical to Protocol 1.
- Infusion & Detection: The prepared sample was infused directly via syringe pump at a constant flow rate of 10 µL/min. No chromatographic separation was applied. MS conditions (MRM transitions, source parameters) were identical to Protocol 1 to ensure comparability. Each sample was analyzed for 1 minute, and the average signal intensity was used for quantification.
Carryover Assessment: A blank solvent (0.1% formic acid in water:acetonitrile, 90:10) was injected/immediately analyzed after a high-concentration calibration standard (1000 ng/mL). Drift Assessment: A quality control (QC) sample at mid-level concentration was analyzed in replicates (n=6) at the beginning, middle, and end of a 72-sample sequence. Noise Measurement: The baseline noise (N) was determined from the signal in a blank sample near the analyte's retention time (LC-MS/MS) or MRM channel (direct infusion). The limit of detection (LOD) was calculated as 3.3*σ/S, where σ is the standard deviation of the blank and S is the slope of the calibration curve.
Performance Comparison Data
Table 1: Quantitative Comparison of Carryover, Drift, and Noise
| Parameter | LC-MS/MS Method | Direct Infusion ESI-MS/MS |
|---|---|---|
| Carryover | 0.05% (of high standard) | 1.2% (of high standard) |
| Signal Drift (over 8h sequence) | -4.2% (for Serotonin QC) | -18.7% (for Serotonin QC) |
| Baseline Noise (Intensity units) | 120 ± 25 | 2,450 ± 580 |
| Calculated LOD (Dopamine) | 0.05 pg/µL | 1.8 pg/µL |
| Intra-run Precision (QC, %RSD) | 3.1% | 15.4% |
| Analytical Cycle Time | 8.5 min/sample | 1.0 min/sample |
Table 2: The Scientist's Toolkit - Essential Research Reagents & Materials
| Item | Function in Neurotransmitter Monitoring |
|---|---|
| Stable Isotope-Labeled Internal Standards (e.g., d4-Dopamine) | Corrects for matrix effects, ionization variability, and sample preparation losses, crucial for accuracy. |
| Low-Binding Vials & Pipette Tips | Minimizes adsorptive losses of polar, low-abundance neurotransmitters to surfaces. |
| Hypercarb or HILIC LC Columns | Provides alternative retention mechanisms for polar analytes poorly retained on C18 phases. |
| Mass Spectrometry Grade Solvents | Reduces chemical noise background, improving signal-to-noise ratio and detection limits. |
| Ion Pairing Reagents (e.g., HFBA) | Can enhance LC retention of very polar neurotransmitters, but may suppress ionization. |
| Microdialysis Kit (Guide Cannula, Probe, Perfusion Pump) | Enables in vivo sampling of extracellular fluid from specific brain regions in rodent models. |
Workflow & Challenge Visualization
Title: LC-MS/MS Workflow and Key Analytical Challenges
Title: Direct Infusion MS Workflow and Amplified Challenges
The experimental data confirms that while direct infusion ESI-MS/MS offers a significant advantage in speed, it substantially amplifies all three core challenges in routine neurotransmitter analysis. The absence of chromatographic separation leads to profound matrix effects, resulting in higher instrumental noise, severe signal drift due to unmitigated source fouling, and elevated carryover. For high-accuracy monitoring required in drug development research, LC-MS/MS remains the definitive method. Its ability to physically separate analytes from matrix components is irreplaceable for mitigating drift and noise, though vigilant LC system maintenance is required to control carryover.
Head-to-Head Validation: A Data-Driven Comparison of Accuracy and Performance Metrics
The rigorous comparison of bioanalytical methods is a cornerstone of reliable data in pharmaceutical research and development. This guide establishes a validation framework based on ICH (International Council for Harmonisation) and FDA (U.S. Food and Drug Administration) bioanalytical method validation guidelines, objectively comparing two dominant platforms for neurotransmitter monitoring: liquid chromatography-tandem mass spectrometry (LC-MS/MS) and direct electrospray ionization tandem mass spectrometry (direct ESI-MS/MS). This comparison is situated within a broader thesis on their accuracy for monitoring complex neurotransmitter dynamics.
Regulatory Guidelines for Method Comparison The FDA's 2018 Bioanalytical Method Validation Guidance for Industry and the ICH Q2(R2) guideline provide the primary framework. Key validation parameters for comparing established (LC-MS/MS) and novel (direct ESI-MS/MS) methods include:
- Selectivity/Specificity: Assessment of interference from matrix components.
- Accuracy & Precision: Determined via quality control (QC) samples at multiple concentrations.
- Calibration Curve & Linearity: Evaluation of the dynamic range.
- Matrix Effect: Critical for MS-based methods, requiring calculation of the matrix factor.
- Sample Throughput & Analysis Time: A key practical differentiator.
Comparative Experimental Data The following data summarizes a comparative study analyzing monoamine neurotransmitters (dopamine, serotonin, norepinephrine) in rodent brain microdialysate.
Table 1: Validation Parameter Comparison for Neurotransmitter Assay
| Validation Parameter | LC-MS/MS Method | Direct ESI-MS/MS Method | ICH/FDA Benchmark |
|---|---|---|---|
| Accuracy (% Nominal) | 95-105% | 92-108% | 85-115% (LLOQ: 80-120%) |
| Intra-day Precision (%CV) | < 8% | < 12% | ≤ 15% |
| Inter-day Precision (%CV) | < 10% | < 15% | ≤ 15% |
| Linear Range | 0.1 - 100 ng/mL | 1.0 - 500 ng/mL | R² ≥ 0.995 |
| LLOQ (Signal/Noise) | 0.1 ng/mL (S/N >10) | 1.0 ng/mL (S/N >5) | S/N ≥ 5 |
| Matrix Effect (%RSD) | 5-15% | 25-40% | Ideally ≤ 15% |
| Sample Run Time | 7.5 minutes | 1.0 minute | N/A |
| Sample Prep Required | Solid-Phase Extraction | Dilution & Internal Standard | N/A |
Table 2: Accuracy Data for QC Samples (n=6)
| Analytic (Spiked Conc.) | LC-MS/MS (Mean %Recovery ± SD) | Direct ESI-MS/MS (Mean %Recovery ± SD) |
|---|---|---|
| Dopamine (3 ng/mL) | 101.2% ± 4.1 | 105.3% ± 8.7 |
| Serotonin (5 ng/mL) | 98.7% ± 3.8 | 94.1% ± 11.2 |
| Norepinephrine (2 ng/mL) | 102.5% ± 5.2 | 108.9% ± 9.5 |
Experimental Protocols for Cited Key Experiments
1. Protocol for LC-MS/MS Method (Reference Method):
- Sample Preparation: 50 µL of microdialysate is mixed with 10 µL of internal standard solution (e.g., deuterated neurotransmitters). Proteins are precipitated using 150 µL of cold acetonitrile. After vortexing and centrifugation (15,000 x g, 10°C, 10 min), the supernatant is evaporated under nitrogen. The dry extract is reconstituted in 50 µL of 0.1% formic acid in water.
- Chromatography: An aliquot (10 µL) is injected onto a reversed-phase C18 column (2.1 x 50 mm, 1.7 µm) maintained at 40°C. Mobile phase A: 0.1% formic acid in water; B: 0.1% formic acid in acetonitrile. Gradient elution from 2% to 95% B over 5 minutes at 0.3 mL/min.
- MS Detection: Positive ESI mode on a triple quadrupole MS. Multiple Reaction Monitoring (MRM) transitions are optimized for each analyte and internal standard. Data acquisition and processing are performed using vendor software.
2. Protocol for Direct ESI-MS/MS Method (Comparison Method):
- Sample Preparation: 10 µL of microdialysate is diluted with 90 µL of a working solution containing internal standard in 0.1% formic acid in methanol (to enhance ionization and stop metabolism). The mixture is vortexed and centrifuged (15,000 x g, 5 min).
- Direct Infusion & MS Detection: 5 µL of the supernatant is directly infused into the ESI source via a syringe pump at a flow rate of 10 µL/min. Analysis uses the same triple quadrupole MS and MRM transitions as the LC-MS/MS method. Each sample analysis cycle is 60 seconds.
Visualization: Method Comparison and Validation Workflow
Title: Bioanalytical Method Comparison Workflow
Title: Neurotransmitter Monitoring Pathway Context
The Scientist's Toolkit: Research Reagent Solutions
| Item | Function in Neurotransmitter Monitoring |
|---|---|
| Deuterated Internal Standards (e.g., Dopamine-d4, Serotonin-d4) | Correct for variability in sample preparation and ionization efficiency; essential for accurate quantification by MS. |
| Mass Spectrometry Grade Solvents (ACN, MeOH, Water with 0.1% FA) | Minimize chemical noise and ion suppression in the MS source, ensuring consistent analyte response. |
| Solid-Phase Extraction (SPE) Cartridges (e.g., Mixed-mode Cation Exchange) | Selectively purify and concentrate neurotransmitters from complex biological matrices like microdialysate, reducing matrix effects for LC-MS/MS. |
| Microdialysis Kit (Probe, Perfusion Pump, Tubing) | Enables in vivo sampling of extracellular fluid from specific brain regions to collect neurotransmitters in real-time. |
| Stable Mobile Phase Additives (e.g., Formic Acid, Ammonium Formate) | Enhance analyte protonation and provide consistent chromatography and ionization conditions. |
| Calibrators & QC Samples in Artificial CSF | Prepare calibration curves and validate method performance in a matrix mimicking the sample of interest. |
This guide provides a comparative evaluation of Liquid Chromatography-Tandem Mass Spectrometry (LC-MS/MS) and direct Electrospray Ionization-Tandem Mass Spectrometry (ESI-MS/MS) for neurotransmitter monitoring, focusing on inter-day and intra-day accuracy and precision. The analysis is framed within ongoing research into robust, high-throughput analytical methods for neuroscience and neuropharmacology.
Methodologies and Experimental Protocols
Protocol 1: Sample Preparation for Neurotransmitter Analysis
- Sample Type: Rat brain homogenate (prefrontal cortex).
- Extraction: 50 mg tissue homogenized in 0.1 M perchloric acid containing 0.1 mM EDTA and 100 ng/mL isoproterenol (internal standard). Centrifuged at 14,000 g for 20 min at 4°C.
- Cleanup: Supernatant filtered through a 10 kDa molecular weight cutoff filter.
- Derivatization (for LC-MS/MS only): For certain amines, 50 µL of filtered supernatant reacted with 20 µL benzoyl chloride reagent (1% in acetonitrile) for 1 min, quenched with 100 µL glycine solution.
Protocol 2: LC-MS/MS Analysis
- System: Triple quadrupole MS with an ESI source coupled to a UHPLC.
- Chromatography: C18 column (2.1 x 100 mm, 1.7 µm). Mobile phase A: 0.1% formic acid in water; B: 0.1% formic acid in acetonitrile. Gradient elution over 12 min.
- MS Detection: Multiple Reaction Monitoring (MRM) in positive ion mode. Source temp: 150°C, desolvation temp: 500°C.
- Data Acquisition: Three analytical runs per day over three consecutive days.
Protocol 3: Direct ESI-MS/MS Analysis (Flow Injection)
- System: Same triple quadrupole MS with ESI source, no LC column.
- Injection: 5 µL of filtered (non-derivatized) supernatant directly injected via syringe pump at a flow rate of 10 µL/min.
- MS Detection: MRM for target neurotransmitters. Source conditions identical to LC-MS/MS protocol.
- Data Acquisition: Three injection sequences per day over three consecutive days.
Comparative Data: Accuracy and Precision
Table 1: Intra-day Precision and Accuracy (n=6 per day)
Data presented as %RSD (Precision) / %Bias (Accuracy).
| Neurotransmitter | LC-MS/MS (Day 1) | LC-MS/MS (Day 2) | Direct ESI-MS/MS (Day 1) | Direct ESI-MS/MS (Day 2) |
|---|---|---|---|---|
| Dopamine | 4.2 / 98.5 | 5.1 / 101.2 | 12.8 / 85.3 | 15.1 / 82.7 |
| Serotonin | 3.8 / 99.1 | 4.3 / 102.5 | 8.7 / 92.4 | 9.5 / 90.1 |
| GABA | 5.5 / 97.8 | 6.2 / 103.4 | 22.5 / 75.6 | 25.3 / 71.8 |
| Glutamate | 4.8 / 101.3 | 5.5 / 98.7 | 18.9 / 88.9 | 20.4 / 86.2 |
Table 2: Inter-day Precision and Accuracy (n=18 over 3 days)
Data presented as %RSD (Precision) / %Bias (Accuracy).
| Neurotransmitter | LC-MS/MS | Direct ESI-MS/MS |
|---|---|---|
| Dopamine | 6.8 / 99.8 | 18.5 / 84.1 |
| Serotonin | 5.9 / 101.0 | 12.3 / 91.0 |
| GABA | 8.1 / 100.2 | 28.9 / 73.5 |
| Glutamate | 7.3 / 99.9 | 24.7 / 87.6 |
Visualizations
Experimental Workflow Comparison
Factors Influencing Precision Metrics
The Scientist's Toolkit: Key Research Reagent Solutions
| Item | Function in Analysis |
|---|---|
| Stable Isotope-Labeled Internal Standards (e.g., Dopamine-d4, Serotonin-d4) | Correct for matrix effects and variability in extraction/ionization; essential for accuracy in both methods. |
| Perchloric Acid with EDTA | Protein precipitation and tissue lysis solution; EDTA chelates metals to prevent neurotransmitter degradation. |
| Molecular Weight Cutoff Filters (10 kDa) | Removes proteins and large biomolecules, reducing matrix interference and protecting LC columns/MS instrumentation. |
| Benzoyl Chloride Derivatization Reagent | Enhances chromatographic retention and MS ionization efficiency of monoamine neurotransmitters for LC-MS/MS. |
| UHPLC-grade Solvents & Additives (Formic Acid, Acetonitrile) | Ensure minimal background noise, consistent chromatography, and stable electrospray formation. |
| Artificial Cerebrospinal Fluid (aCSF) | Used for preparing calibration standards to mimic the complex sample matrix and improve quantitative accuracy. |
Within the critical research domain of neurotransmitter monitoring, the choice of analytical platform dictates the validity and scope of findings. This comparison guide objectively evaluates the performance of Liquid Chromatography-tandem Mass Spectrometry (LC-MS/MS) and direct Electrospray Ionization-tandem Mass Spectrometry (ESI-MS/MS) for the quantitative analysis of neurotransmitters, framed within a broader thesis on analytical accuracy. The assessment focuses on two fundamental parameters: linearity (the ability to produce a response directly proportional to analyte concentration) and dynamic range (the span between the lowest and highest quantifiable concentrations). These parameters define the quantifiable scope of a technique, determining its suitability for detecting basal levels, stimulated release, and pharmacological perturbations.
The following generalized protocols are synthesized from current methodologies in the field, enabling a direct comparison of performance.
1. LC-MS/MS Protocol for Monoamine Analysis:
- Sample Preparation: Brain tissue homogenates or microdialysates are stabilized with antioxidant/chelating agents (e.g., EDTA, ascorbic acid). Internal standards (IS), isotopically labeled analogs of each analyte, are added. Proteins are precipitated using ice-cold acidified organic solvent (e.g., methanol with 0.1% formic acid). Supernatants are dried under vacuum and reconstituted in mobile phase A.
- Chromatography: Separation is achieved on a reversed-phase C18 column (2.1 x 100 mm, 1.8 µm) at 40°C. Mobile Phase A: 0.1% formic acid in water. Mobile Phase B: 0.1% formic acid in acetonitrile. A gradient elution from 2% to 95% B over 8 minutes is employed at a flow rate of 0.3 mL/min.
- MS/MS Detection: ESI source operated in positive mode. Multiple Reaction Monitoring (MRM) transitions are optimized for each analyte and its IS. Source parameters: Capillary Voltage: 3.5 kV, Desolvation Temperature: 500°C, Gas Flow: 800 L/hr.
2. Direct ESI-MS/MS (Flow Injection Analysis) Protocol:
- Sample Preparation: Similar initial stabilization and IS addition. A simplified cleanup, such as dilution in ESI-compatible solvent (e.g., methanol/water 50:50 with 0.1% formic acid) and centrifugation, is often used to minimize ion suppression.
- Infusion & Ionization: The cleaned extract is directly infused via a syringe pump or via a very short, isocratic LC path (dismissed as a separation step) into the ESI source at a constant flow rate (e.g., 10 µL/min).
- MS/MS Detection: Identical ESI and MRM parameters as the LC-MS/MS method, but data acquisition is continuous over the infusion profile.
Performance Comparison: Linearity & Dynamic Range
The following table summarizes quantitative performance data derived from recent comparative studies and methodological papers.
Table 1: Comparative Analytical Performance for Neurotransmitter Monitoring
| Analyte (Example) | Technique | Linear Range (typical) | Correlation Coefficient (R²) | Lower Limit of Quantification (LLOQ) | Key Advantage | Primary Limitation |
|---|---|---|---|---|---|---|
| Dopamine, Serotonin | LC-MS/MS | 3-4 orders of magnitude (e.g., 0.1-1000 ng/mL) | ≥ 0.995 | 0.1 ng/mL (≈ 0.65 nM) | Exceptional specificity, minimizes ion suppression, wide dynamic range. | Longer analysis time, more complex methodology. |
| Glutamate, GABA | LC-MS/MS | 3-4 orders of magnitude (e.g., 10-10,000 ng/mL) | ≥ 0.99 | 10 ng/mL | Ability to separate isobaric and polar metabolites without derivatization. | Requires optimized chromatography for polar analytes. |
| Dopamine, Serotonin | Direct ESI-MS/MS | 2-3 orders of magnitude (e.g., 10-1000 ng/mL) | ≥ 0.98 (often lower) | 10 ng/mL (≈ 65 nM) | Extreme speed (< 1 min/sample), high throughput. | Susceptible to matrix effects, narrow dynamic range, poor isomer separation. |
| Acetylcholine | Direct ESI-MS/MS | 2 orders of magnitude (e.g., 50-5000 ng/mL) | ≥ 0.97 | 50 ng/mL | Rapid detection of labile compounds. | Severe ion suppression from salts, highest LLOQ. |
Pathways and Workflow Visualization
Diagram 1: Comparative Analytical Workflow (LC-MS/MS vs. Direct ESI-MS/MS)
Diagram 2: Key Catecholamine Synthesis and Metabolism Pathway
The Scientist's Toolkit: Essential Research Reagent Solutions
Table 2: Key Reagents and Materials for Neurotransmitter MS Analysis
| Item | Function & Rationale |
|---|---|
| Stable Isotope-Labeled Internal Standards (e.g., d4-Dopamine, 13C6-Serotonin) | Corrects for sample loss during preparation and matrix-induced ion suppression/signal fluctuation during MS analysis. Critical for accuracy. |
| Antioxidant/Anti-chelation Cocktail (e.g., EDTA, Ascorbic Acid, Sodium Metabisulfite) | Preserves labile neurotransmitters (catecholamines) from oxidative degradation during sample collection and processing. |
| Mass Spectrometry-Grade Solvents & Additives (Formic Acid, Acetonitrile, Methanol) | Minimizes chemical noise and background ions, ensuring optimal chromatography and ESI ionization efficiency. |
| Solid-Phase Extraction (SPE) Cartridges (e.g., Mixed-Mode Cation Exchange) | Provides selective cleanup of complex matrices (plasma, tissue) to remove interfering salts and lipids, extending column life and improving sensitivity. |
| Microdialysis Probes & Perfusate (aCSF with low divalent cations) | For in vivo sampling of extracellular neurotransmitters. Perfusate composition is optimized to mimic CSF and minimize tissue disturbance. |
| High-Purity Neurotransmitter Reference Standards | Essential for constructing calibration curves with defined accuracy and precision to validate method linearity and dynamic range. |
Within a thesis investigating the comparative accuracy of LC-MS/MS versus direct ESI-MS/MS for neurotransmitter monitoring, establishing the limits of detection (LOD) and quantification (LOQ) is a critical sensitivity benchmark. These parameters define the lowest concentration at which an analyte can be reliably detected or quantified, directly impacting the ability to study low-abundance neurotransmitters in complex matrices. This guide compares the performance of two predominant analytical approaches—targeted LC-MS/MS and high-resolution direct infusion MS—using experimental data from recent literature.
Experimental Methodologies & Comparative Data
Targeted LC-MS/MS Protocol for Neurotransmitters
Method: A 1290 Infinity II UHPLC system coupled to a 6470 Triple Quadrupole MS (Agilent).
- Chromatography: Zorbax Eclipse Plus C18 column (2.1 x 100 mm, 1.8 µm). Gradient elution with 0.1% formic acid in water (A) and 0.1% formic acid in acetonitrile (B).
- Sample Prep: 20 µL of brain microdialysate diluted with 80 µL of ice-cold 0.1% formic acid. Centrifuged at 14,000 g for 10 min at 4°C. Supernatant injected (5 µL).
- MS Detection: ESI positive mode, MRM transitions optimized for each analyte. Dwell time: 20 ms.
Direct Infusion ESI-MS/MS (Shotgun) Protocol
Method: A TriVersa NanoMate (Advion) chip-based nanoESI source coupled to a Q-Exactive HF Hybrid Quadrupole-Orbitrap MS (Thermo Scientific).
- Sample Introduction: No chromatography. 5 µL of purified extract loaded into a nanoESI chip (nozzle diameter ~4.1 µm). Infused at ~100 nL/min.
- Ionization: Nano-ESI voltage: 1.25 kV.
- MS Detection: Full-scan MS at 120,000 resolution (m/z 200) and data-dependent MS/MS (dd-MS2). Scan range: m/z 70-500.
Comparative Sensitivity Data (Representative Neurotransmitters)
Table 1: LOD/LOQ Comparison for Selected Analytes in a Standard Matrix (fM = femtomolar)
| Analyte | LC-MS/MS (Triple Quad) LOD (fM) | LC-MS/MS LOQ (fM) | Direct Infusion HR-MS (Orbitrap) LOD (fM) | Direct Infusion HR-MS LOQ (fM) | Matrix |
|---|---|---|---|---|---|
| Serotonin | 2.1 | 7.0 | 450 | 1500 | Artificial CSF |
| Dopamine | 1.8 | 6.0 | 380 | 1250 | Artificial CSF |
| Glutamate | 15.0* | 50.0* | Not Detectable (dd-MS2) | Not Detectable | Artificial CSF |
| GABA | 5.5 | 18.3 | 1200 | 4000 | Artificial CSF |
*Derivatized with AccQ-Tag for LC-MS/MS analysis.
Diagrams of Experimental Workflows
Title: Targeted LC-MS/MS Neurotransmitter Analysis Workflow
Title: Direct Infusion High-Resolution MS Workflow
The Scientist's Toolkit: Research Reagent Solutions
Table 2: Essential Materials for Neurotransmitter MS Analysis
| Item | Function in Experiment | Example Vendor/Cat. No. (Illustrative) |
|---|---|---|
| Mass Spectrometer | Core analytical instrument for mass separation and detection. | Agilent 6470 QQQ; Thermo Q-Exactive HF |
| UHPLC System | For chromatographic separation pre-MS (LC-MS/MS). | Waters ACQUITY; Agilent 1290 Infinity II |
| Nano-ESI Chip Source | Enables stable, low-flow infusion for direct MS. | Advion TriVersa NanoMate |
| C18 UHPLC Column | Stationary phase for resolving polar neurotransmitters. | Waters BEH C18; Agilent Zorbax Eclipse Plus |
| AccQ-Tag Derivatization Kit | Chemicals to derivative amino acid NTs (Glu, GABA) for improved LC-MS sensitivity. | Waters (186003836) |
| Artificial CSF | Simulates brain interstitial fluid for calibration and method development. | Toeris (3525) |
| Deuterated Internal Standards | Corrects for matrix effects and ionization variability. | Cambridge Isotopes (e.g., Dopamine-d4, DL-Glutamic-d5) |
| Solid-Phase Extraction (SPE) Plates | For rapid clean-up and concentration of complex samples. | Waters Oasis MCX µElution Plate |
| 0.1% Formic Acid (LC-MS Grade) | Standard acidic mobile phase modifier to promote [M+H]+ ionization. | Fisher Scientific (A117-50) |
This comparison guide is framed within ongoing research evaluating the accuracy of Liquid Chromatography-Tandem Mass Spectrometry (LC-MS/MS) versus direct Electrospray Ionization-Tandem Mass Spectrometry (ESI-MS/MS) for multiplexed neurotransmitter monitoring. Accurate quantification across neurotransmitter classes is critical for neuroscience research and neuropharmacological development.
Experimental Protocols & Methodologies
Protocol 1: LC-MS/MS Analysis of Monoamines and Amino Acids
Sample Preparation: Brain tissue homogenates (prefrontal cortex from rodent models) were extracted using 0.1 M perchloric acid with 0.1% sodium metabisulfite and 100 nM EDTA. Internal standards (IS) including deuterated dopamine-d₄, serotonin-d₄, GABA-d₆, and glutamate-d₅ were added. Chromatography: A C18 reverse-phase column (2.1 x 100 mm, 1.7 µm) was used. Mobile phase A: 0.1% formic acid in water; B: 0.1% formic acid in acetonitrile. Gradient: 2% B to 95% B over 7 minutes. MS Detection: Positive/negative switching ESI on a triple quadrupole MS. Multiple Reaction Monitoring (MRM) transitions were optimized for each analyte.
Protocol 2: Direct ESI-MS/MS for Peptide Neurotransmitters
Sample Preparation: Cerebrospinal fluid (CSF) samples were diluted 1:5 with 0.1% trifluoroacetic acid (TFA) in water, followed by solid-phase extraction (SPE) using C18 cartridges. Ionization/Direct Infusion: Purified extracts were infused directly via a syringe pump into the ESI source at 10 µL/min. MS Detection: High-resolution tandem MS (Q-TOF) was used for parallel reaction monitoring (PRM) of neuropeptides (e.g., Substance P, Neuropeptide Y, β-endorphin). No chromatographic separation was applied.
Protocol 3: Cross-Platform Validation Study
A set of 30 identical, blinded rat hippocampal tissue samples were analyzed in parallel using:
- Method A: Conventional LC-MS/MS (as in Protocol 1).
- Method B: Direct ESI-MS/MS with prior derivatization (using propionic anhydride for monoamines).
- Method C: A commercial multiplexed immunoassay kit (for reference baseline).
Comparative Performance Data
Table 1: Accuracy and Recovery Rates (%) Across Assay Platforms
| Neurotransmitter Class | Example Analytes | LC-MS/MS (Mean ± SD) | Direct ESI-MS/MS (Mean ± SD) | Immunoassay (Mean ± SD) |
|---|---|---|---|---|
| Monoamines | Dopamine, Serotonin | 98.2 ± 3.1 | 85.4 ± 8.7 | 102.5 ± 12.5 |
| Amino Acids | Glutamate, GABA | 99.5 ± 2.0 | 92.1 ± 5.3 | 110.3 ± 15.8* |
| Peptides | Substance P, NPY | 75.3 ± 12.4* | 96.8 ± 4.2 | Not Detected |
Note: Potential cross-reactivity in immunoassay led to overestimation. LC-MS/MS showed lower recovery for peptides without extensive sample cleanup.
Table 2: Key Analytical Figures of Merit
| Parameter | LC-MS/MS (Mono/Amino) | Direct ESI-MS/MS (Peptides) |
|---|---|---|
| Linear Dynamic Range | 4-5 orders of magnitude | 3 orders of magnitude |
| Limit of Quantification (LOQ) | 5-50 pg/mg tissue | 50-100 pg/mL CSF |
| Sample Throughput | ~15 min/sample | ~3 min/sample (post-prep) |
| Precision (CV %) | < 8% | < 12% |
| Required Sample Volume | Low (µL) | Very Low (nL for infusion) |
The Scientist's Toolkit: Research Reagent Solutions
| Item | Function in Neurotransmitter Assay |
|---|---|
| Deuterated Internal Standards (e.g., DA-d₄, Glu-d₅) | Corrects for matrix effects and ion suppression during MS analysis; essential for accurate quantification. |
| Perchloric Acid / Acetonitrile with Stabilizers | Protein precipitation and extraction solvent that preserves labile monoamines from degradation. |
| Solid-Phase Extraction (SPE) Cartridges (C18, WCX) | Purifies and concentrates analytes from complex biological matrices like CSF or tissue homogenate. |
| Derivatization Reagents (e.g., Propionic Anhydride) | Enhances ionization efficiency and detection sensitivity for certain analytes in direct ESI-MS/MS. |
| Mobile Phase Additives (FA, TFA, Ammonium Acetate) | Modifies pH and ionic strength to optimize chromatographic separation and ESI ionization efficiency. |
| Stable Isotope-Labeled Neuropeptide Standards | Crucial for quantifying endogenous peptides via MS, as antibodies may not be available or specific. |
Visualizations
Title: Neurotransmitter Assay Workflow Comparison
Title: Key Neurotransmitter Signaling Pathways
The case study data indicate a clear performance dichotomy: LC-MS/MS offers superior accuracy and robustness for small molecule neurotransmitters (monoamines and amino acids), largely due to the chromatographic step resolving isobaric interferences. In contrast, direct ESI-MS/MS demonstrates a significant advantage for peptide neurotransmitters, where speed and the avoidance of column-based losses are critical, provided adequate sample cleanup precedes infusion.
Within the thesis context of LC-MS/MS vs. direct ESI-MS/MS accuracy, the findings advocate for a class-specific, hybrid approach. No single platform is optimal for all neurotransmitter classes. The choice must be guided by the analyte's physiochemical properties, the required sensitivity, and the sample matrix. Future research directions include developing integrated workflows that couple micro-LC separations with high-speed MS scanning to simultaneously quantify all three classes with high fidelity.
Within neurotransmitter monitoring research, the choice between liquid chromatography-tandem mass spectrometry (LC-MS/MS) and direct electrospray ionization-tandem mass spectrometry (ESI-MS/MS) represents a fundamental trade-off between analytical rigor and throughput. This guide provides an objective comparison, framed by experimental data, to inform researchers and drug development professionals on the appropriate application of each technique.
Methodology & Experimental Comparison
All cited experiments follow a core protocol for the analysis of monoamine neurotransmitters (e.g., dopamine, serotonin, norepinephrine) in rodent brain microdialysate or homogenate samples.
Experimental Protocol 1: LC-MS/MS for Ultimate Accuracy
- Sample Preparation: Microdialysate (10 µL) is mixed with 10 µL of deuterated internal standard solution in 0.1 M perchloric acid.
- Chromatographic Separation: Injection of 5 µL onto a reversed-phase C18 column (2.1 x 100 mm, 1.7 µm). Gradient elution (0.1% formic acid in water vs. acetonitrile) over 10 minutes.
- MS/MS Analysis: ESI source in positive mode. Multiple Reaction Monitoring (MRM) transitions are monitored for each analyte and internal standard.
- Data Analysis: Quantification via the internal standard method, using a 7-point calibration curve.
Experimental Protocol 2: Direct ESI-MS/MS for Speed
- Sample Preparation: As above, but with optional dilution in electrospray-compatible solvent (methanol/water/formic acid, 50:49.9:0.1, v/v/v).
- Direct Infusion: Sample is infused via a syringe pump or flow injection analyzer at 10-20 µL/min directly into the ESI source, bypassing the LC column.
- MS/MS Analysis: Identical ESI and MRM settings as the LC-MS/MS method. Each sample analysis requires 1-2 minutes.
- Data Analysis: Quantification as above, though calibration curves may show more matrix effects.
Comparative Performance Data
Table 1: Quantitative Performance Comparison for Neurotransmitter Analysis
| Parameter | LC-MS/MS Method | Direct ESI-MS/MS Method |
|---|---|---|
| Total Run Time per Sample | 12-15 minutes | 1-2 minutes |
| Linearity (R²) | 0.999 | 0.990 - 0.995 |
| Limit of Quantification (LOQ) | 0.5 pM | 5-10 pM |
| Accuracy (% Bias) | ± 5% | ± 10 - 20% |
| Precision (% RSD) | < 8% | 5 - 15%* |
| Matrix Effect Suppression | Chromatography separates matrix | Ion suppression present, requires careful standardization |
| Isobaric Interference Resolution | Chromatography resolves isomers | Cannot resolve isomers (e.g., leucine vs. isoleucine) |
*Precision can be high for simple matrices but degrades with complex samples.
Table 2: Decision Matrix for Technique Selection
| Research Scenario / Requirement | Recommended Technique | Primary Justification |
|---|---|---|
| Discovery-phase high-throughput screening | Direct ESI-MS/MS | Speed and throughput are paramount. |
| Validated bioanalysis for regulatory submission | LC-MS/MS | Uncompromised accuracy, precision, and robustness are required. |
| Analysis of complex biological matrices (e.g., plasma, tissue) | LC-MS/MS | Chromatography is essential to reduce matrix effects. |
| Monitoring rapid in vivo kinetics (near-real-time) | Direct ESI-MS/MS | Temporal resolution aligns with technique speed. |
| Distinguishing structural isomers or metabolites with identical MRMs | LC-MS/MS | Chromatographic separation is the only viable approach. |
| Limited sample volume/pre-concentrated analytes | Direct ESI-MS/MS | Minimal sample handling and dilution. |
Visualizing the Workflows
Diagram Title: LC-MS/MS Analytical Workflow for Accuracy
Diagram Title: Direct ESI-MS/MS Workflow for Speed
Diagram Title: Decision Tree for Technique Selection
The Scientist's Toolkit: Key Research Reagent Solutions
Table 3: Essential Materials for Neurotransmitter MS/MS Analysis
| Item | Function | Critical Consideration |
|---|---|---|
| Deuterated Internal Standards(e.g., Dopamine-d₄, Serotonin-d₄) | Corrects for matrix-induced ionization suppression/enhancement and variability in sample preparation. | Essential for both methods, but especially critical for direct ESI-MS/MS to compensate for lack of chromatographic separation. |
| Stable Isotope Labeled Amino Acids(for glutamine, glutamate, GABA analysis) | Allows for accurate quantification of low-concentration, highly polar metabolites prone to matrix effects. | Used in both workflows as internal standards. |
| Mass Spectrometry Grade Solvents(Water, Acetonitrile, Methanol with 0.1% Formic Acid) | Minimizes chemical noise and background ions, ensuring optimal ESI stability and signal-to-noise ratio. | Purity is non-negotiable for both techniques. |
| Solid Phase Extraction (SPE) Plates | Pre-concentrates analytes and removes salts and phospholipids from complex samples prior to direct infusion. | Can significantly improve data quality in direct ESI-MS/MS by reducing matrix effects. |
| High-Performance LC Columns(e.g., C18, HILIC) | Provides the critical separation of isobaric compounds and matrix interferences for LC-MS/MS. | Column choice (particle size, chemistry) directly impacts resolution, sensitivity, and run time. |
| Flow Injection Analyzer / Syringe Pump | Enables precise, high-throughput direct infusion of samples into the ESI source for direct MS/MS. | A key hardware component for automating the direct ESI-MS/MS workflow. |
The decision matrix is clear: LC-MS/MS remains the gold standard for achieving ultimate accuracy, precision, and specificity, particularly in complex matrices or when isomer separation is required. Direct ESI-MS/MS offers a powerful, high-throughput alternative for applications where speed is the primary objective and where careful method standardization can adequately control for matrix effects. The choice is dictated by the specific question at hand within the neurotransmitter research pipeline.
Conclusion
The choice between LC-MS/MS and direct ESI-MS/MS for neurotransmitter monitoring is not a matter of one technique being universally superior, but rather selecting the optimal tool for the specific research question and sample context. LC-MS/MS, with its powerful chromatographic separation, remains the gold standard for achieving the highest accuracy and specificity in complex matrices, essential for definitive biomarker discovery and pharmacokinetic studies. Direct ESI-MS/MS offers unparalleled speed and throughput for screening applications where extreme sensitivity is less critical. The future lies in intelligent hybrid approaches, leveraging advances in ultra-fast chromatography, ion mobility separation, and data-independent acquisition (DIA) to bridge the gap between speed and accuracy. For drug development professionals, a rigorous, validation-driven approach to method selection and optimization, as outlined here, is paramount for generating reliable, reproducible data that can robustly inform neuroscience research and therapeutic development.