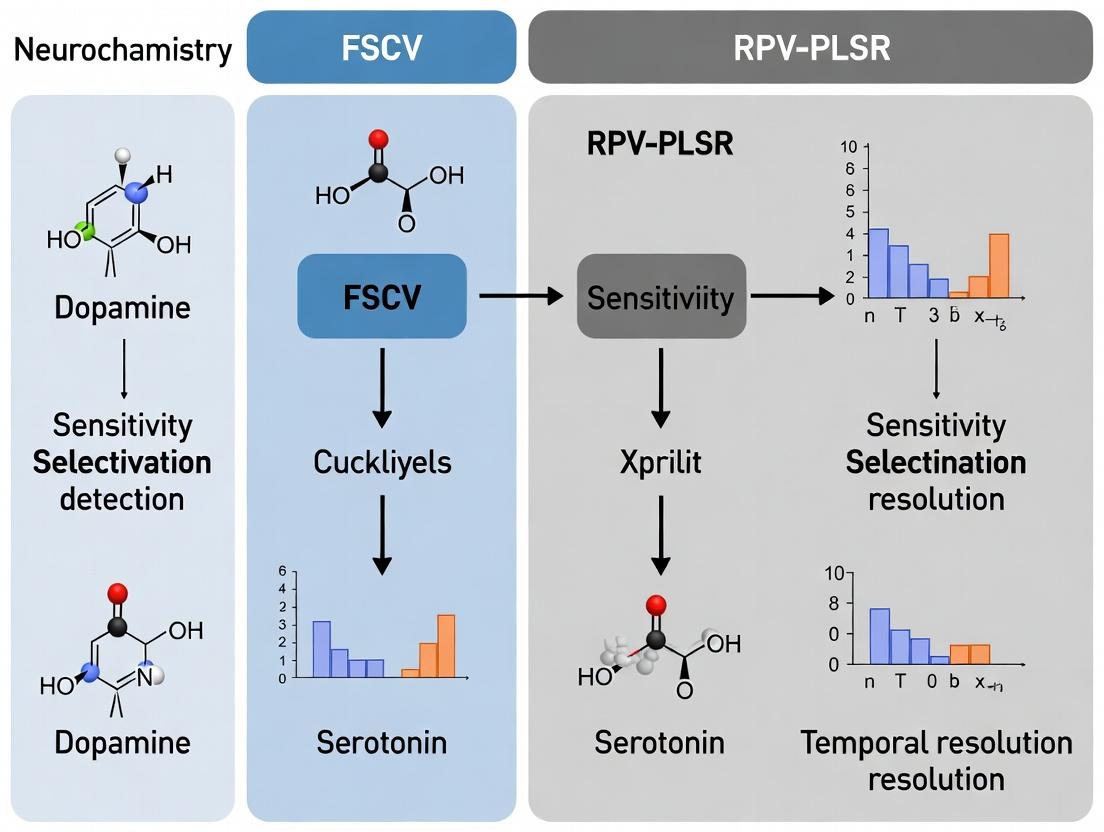
FSCV vs. RPV-PLSR for Dopamine and Serotonin Detection: A Comprehensive 2024 Technical Comparison
This article provides researchers, neuroscientists, and drug development professionals with a detailed technical comparison of Fast-Scan Cyclic Voltammetry (FSCV) and Repetitive-Potential Voltammetry with Partial Least Squares Regression (RPV-PLSR) for the...
FSCV vs. RPV-PLSR for Dopamine and Serotonin Detection: A Comprehensive 2024 Technical Comparison
Abstract
This article provides researchers, neuroscientists, and drug development professionals with a detailed technical comparison of Fast-Scan Cyclic Voltammetry (FSCV) and Repetitive-Potential Voltammetry with Partial Least Squares Regression (RPV-PLSR) for the simultaneous detection of dopamine and serotonin. Covering foundational principles, methodological execution, optimization strategies, and validation protocols, it synthesizes the latest advancements to guide experimental design, data interpretation, and method selection for in vivo neurochemical monitoring and preclinical studies.
Decoding the Signals: The Neurochemical Battle of Dopamine vs. Serotonin and the Sensors That Track Them
The Critical Roles of Dopamine and Serotonin in Brain Function and Disease Pathologies
Dopamine (DA) and serotonin (5-HT) are monoamine neurotransmitters fundamental to regulating mood, reward, cognition, and movement. Dysregulation of these systems is implicated in pathologies like Parkinson's disease, depression, and addiction. Advanced electrochemical techniques are critical for their real-time, simultaneous detection in vivo. This guide compares the performance of two principal analytical methodologies: Fast-Scan Cyclic Voltammetry (FSCV) and Rotating Ring Disk Electrode coupled with Partial Least Squares Regression (RRDE-PLSR), within the broader thesis of optimizing detection for neuromodulatory research and drug development.
Performance Comparison: FSCV vs. RRDE-PLSR for DA and 5-HT Detection
The following tables summarize key performance metrics based on current experimental literature.
Table 1: Fundamental Methodological Comparison
| Feature | Fast-Scan Cyclic Voltammetry (FSCV) | Rotating Ring-Disk Electrode with PLSR (RRDE-PLSR) |
|---|---|---|
| Primary Principle | Rapid voltage sweep at a stationary carbon-fiber microelectrode, measuring faradaic current. | Hydrodynamic modulation at a rotating electrode; collection efficiency and multivariate analysis. |
| Temporal Resolution | Sub-second (10s-100s of ms) | Seconds to minutes |
| Spatial Resolution | Excellent (micron-scale CFM) | Poor (macro-electrode) |
| In Vivo Compatibility | Excellent (chronic implants) | Limited (primarily in vitro/ex vivo) |
| Simultaneous DA & 5-HT | Challenging due to overlapping oxidation potentials; requires waveform optimization (e.g., "Jackson waveform"). | Excellent; inherent separation via collection efficiency & multivariate deconvolution. |
| Primary Output | Voltammogram (current vs. voltage) for identity and concentration. | Currents at disk and ring; PLSR model predicts concentrations from multi-variable dataset. |
| Selectivity Against Interferents (e.g., pH, AA) | Moderate; improved with waveform design and data analysis (e.g., principal component analysis). | High; physical separation and statistical modeling reduce interferent impact. |
Table 2: Quantitative Performance Metrics from Representative Studies
| Metric | FSCV (with DA/5-HT waveform) | RRDE-PLSR |
|---|---|---|
| Limit of Detection (DA) | ~5-20 nM | ~10-50 nM |
| Limit of Detection (5-HT) | ~10-50 nM | ~5-20 nM |
| Linear Dynamic Range | 0.05 – 5 µM | 0.01 – 2 µM |
| Recovery Time (for 5-HT) | < 5 seconds | N/A (continuous flow) |
| Accuracy in Mixtures (RMSEP) | ~15-25% (with advanced analysis) | ~5-10% |
| Key Advantage for Disease Research | Real-time, spatially resolved phasic signaling in behavioral models. | High-fidelity quantification of tonic levels and complex mixtures for pharmacokinetics. |
Detailed Experimental Protocols
Protocol 1: In Vivo Phasic Release Measurement using FSCV
- Aim: Detect electrically or behaviorally evoked DA release in a specific brain region (e.g., striatum) of an anesthetized or freely moving rodent.
- Electrode: Carbon-fiber microelectrode (7 µm diameter) implanted alongside a Ag/AgCl reference electrode and bipolar stimulating electrode.
- Waveform: A triangular waveform (e.g., -0.4 V to +1.4 V to -0.4 V vs. Ag/AgCl, 400 V/s, 10 Hz).
- Stimulation: A train of electrical pulses (e.g., 60 Hz, 24 pulses, 300 µA) is delivered to the upstream pathway (e.g., medial forebrain bundle).
- Data Acquisition: Current is recorded at the scan frequency. Background subtraction isolates faradaic current.
- Analysis: Resulting cyclic voltammograms are compared to background-subtracted training sets for DA and 5-HT for analyte identification and concentration calibration.
Protocol 2: In Vitro Selectivity Validation using RRDE-PLSR
- Aim: Precisely quantify DA and 5-HT concentrations in a mixed solution mimicking extracellular fluid.
- Electrode System: RRDE with a glassy carbon disk and Pt ring. Rotation speed: 2000 rpm.
- Solution: PBS (pH 7.4) containing varying, known concentrations of DA (0-1 µM), 5-HT (0-1 µM), and interferents (e.g., 250 µM ascorbic acid, pH changes).
- Potential Control: Disk potential is held at +0.8 V (oxidizes DA and 5-HT). Ring potential is held at -0.2 V (reduces back the oxidized products).
- Data Collection: Disk and ring currents are recorded for multiple standard mixtures to create a training set.
- Modeling: A PLSR model is built correlating the current patterns (features) to the known concentrations.
- Validation: The model is used to predict concentrations in unknown mixtures, and accuracy is reported as Root Mean Square Error of Prediction (RMSEP).
Visualization of Signaling Pathways and Experimental Workflows
FSCV Experimental Data Workflow
Dopamine Synthesis and Reuptake Pathway
RRDE-PLSR Hydrodynamic Detection System
The Scientist's Toolkit: Key Research Reagent Solutions
| Item | Function in DA/5-HT Research |
|---|---|
| Carbon-Fiber Microelectrode (CFM) | The sensing element for FSCV; provides high spatial/temporal resolution and biocompatibility for in vivo work. |
| Fast-Scan Cyclic Voltammetry Rig | Potentiostat system capable of high-speed voltage application and low-noise current measurement (e.g., 400 V/s). |
| Rotating Ring-Disk Electrode (RRDE) | Electrode for hydrodynamic experiments; enables spatial separation of oxidation and reduction events for selectivity. |
| Partial Least Squares Regression (PLSR) Software | Multivariate analysis package (e.g., in MATLAB, Python) to deconvolve signals from mixed analytes. |
| DA & 5-HT Selective Reuptake Inhibitors | Pharmacological tools (e.g., nomifensine for DAT, citalopram for SERT) to manipulate systems for validation. |
| Calibrated DA and 5-HT Standards | High-purity compounds for creating training sets and calibrating sensor responses in vitro. |
| Artificial Cerebrospinal Fluid (aCSF) | Ionic solution mimicking brain extracellular fluid for in vitro calibration and ex vivo experiments. |
| Microdialysis Probes (for comparison) | Used to validate electrochemical findings by measuring basal tonic levels, though with lower temporal resolution. |
Comparative Analysis of FSCV vs. RPV-PLSR for Dopamine and Serotonin Detection
This comparison guide evaluates two primary electrochemical methodologies for the in vivo measurement of dopamine (DA) and serotonin (5-HT): Fast-Scan Cyclic Voltammetry (FSCV) and Resting-Potential Voltammetry with Partial Least Squares Regression (RPV-PLSR).
Performance Comparison Table: FSCV vs. RPV-PLSR
| Performance Metric | Fast-Scan Cyclic Voltammetry (FSCV) | RPV-PLSR (Resting-Potential PLSR) |
|---|---|---|
| Temporal Resolution | Sub-second (~100 ms) | Sub-second (~100 ms) |
| Selectivity (DA in 5-HT presence) | Moderate to Low. Requires waveform optimization (e.g., DA waveform at ~0.6V, 5-HT at ~1.0V anodic peak). Prone to false positives from pH shifts, metabolites (e.g., DOPAC). | High. Uses multivariate chemometric analysis (PLS-R) on full voltammetric data, distinguishing analytes by their distinct oxidation profiles. |
| Simultaneous DA & 5-HT Detection | Challenging. Traditional waveforms (e.g., N-shaped) detect DA well but oxidize 5-HT irreversibly, fouling the electrode. Requires specialized, optimized waveforms. | Core Strength. Designed explicitly for simultaneous detection. PLSR model deconvolves overlapping signals from DA, 5-HT, pH, and other interferents. |
| Electrode Fouling | High for 5-HT due to polymerization of oxidation products on carbon surface. | Reduced. The resting potential and shorter scan duration may minimize adsorption. Regular calibration is still required. |
| In Vivo Durability | Signal degrades over time due to fouling, especially with 5-HT. | Improved long-term stability reported in studies, maintaining sensitivity for hours. |
| Key Experimental Data (Representative) | DA LOD: ~10-50 nM. 5-HT LOD with optimized waveform: ~50-200 nM. Selectivity ratio (DA:5-HT) can be < 5:1. | Simultaneous DA & 5-HT LOD: ~10-30 nM. Demonstrated selective tracking of pharmacologically-induced DA (nomifensine) and 5-HT (citalopram) release in rat striatum. |
| Primary Advantage | Excellent temporal resolution for rapid DA transients. Well-established, extensive historical data. | Superior chemical selectivity for simultaneous monoamine measurement without cross-talk. |
| Primary Limitation | Poor chemical selectivity in complex environments; difficult to resolve mixtures. | Requires extensive in vitro training set for PLSR model before in vivo application. More complex data processing. |
Experimental Protocols
Protocol 1: FSCV for DA Detection with Traditional Waveform
- Electrode: Cylindrical carbon-fiber microelectrode (diameter 5-7 µm).
- Waveform: A triangular potential applied from -0.4 V to +1.3 V and back vs. Ag/AgCl at 400 V/s, repeated at 10 Hz.
- Background Subtraction: Current from each scan is subtracted from the average background current (typically from 5-10 prior scans) to reveal faradaic peaks.
- Identification: DA is identified by its characteristic oxidation peak at ~+0.6 V and reduction peak at ~-0.2 V.
- Calibration: Post-experiment, electrode is calibrated in known DA concentrations (e.g., 1 µM) in PBS.
Protocol 2: RPV-PLSR for Simultaneous DA & 5-HT Detection
- Electrode & Waveform: Carbon-fiber microelectrode. A brief, square-wave scan (e.g., from 0.0 V to +1.0 V and back at 1000 V/s) is applied every 100 ms while the electrode rests at 0.0 V between scans.
- Training Set Acquisition: In vitro, collect voltammetric data in a flowing stream of solutions containing varying, known concentrations of DA, 5-HT, pH changes, and metabolites (DOPAC, 5-HIAA). This creates a training matrix.
- PLSR Model Building: Use computational software (e.g., MATLAB) to perform Partial Least Squares Regression on the training data. The model learns the correlation between current features and analyte concentrations.
- In Vivo Application: Apply the trained PLSR model to voltammetric data collected in vivo. The model outputs predicted concentrations of DA and 5-HT for each time point.
- Validation: Verify model predictions with pharmacological challenges (e.g., selective reuptake inhibitors).
Diagrams
Title: FSCV Data Processing Workflow for Dopamine
Title: RPV-PLSR Two-Phase Workflow for Simultaneous Detection
The Scientist's Toolkit: Key Research Reagent Solutions
| Item | Function in Experiment |
|---|---|
| Carbon-Fiber Microelectrode | The sensing element. A single cylindrical carbon fiber (5-7 µm diameter) provides a high surface-area-to-volume ratio for sensitive electrochemical detection in neural tissue. |
| Ag/AgCl Reference Electrode | Provides a stable, well-defined reference potential against which the working electrode's potential is controlled in the three-electrode electrochemical cell. |
| Potentiostat | The core instrument. It applies the specified voltage waveform to the working electrode and measures the resulting current with high precision and speed. |
| Flow Injection Analysis (FIA) System | Used for in vitro calibration and training set generation. Allows precise, automated switching between solutions of known analyte concentrations. |
| PLS-R Software (e.g., in MATLAB) | Computational package used to perform Partial Least Squares Regression analysis, building the model from training data and applying it to unknown in vivo data. |
| DA & 5-HT Reuptake Inhibitors (Nomifensine, Citalopram) | Pharmacological tools used in vivo to selectively elevate extracellular DA or 5-HT levels, respectively, for method validation and selectivity testing. |
| Artificial Cerebrospinal Fluid (aCSF) | Ionic solution mimicking the extracellular brain environment. Used for electrode storage, in vitro testing, and sometimes as a vehicle for drug delivery. |
| Phosphate Buffered Saline (PBS) | Standard electrolyte solution for post-experiment electrode calibration in known analyte concentrations. |
This guide, situated within the thesis context of comparing Fast Scan Cyclic Voltammetry (FSCV) and Repetitive Pulsed Voltammetry with Partial Least Squares Regression (RPV-PLSR) for dopamine and serotonin detection, provides a performance comparison of these leading voltammetric techniques. The objective is to inform researchers and drug development professionals about the experimental foundations and relative merits of each method.
Comparison of FSCV and RPV-PLSR
Table 1: Core Performance Comparison for Dopamine Detection
| Parameter | Fast Scan Cyclic Voltammetry (FSCV) | Repetitive Pulsed Voltammetry-PLSR (RPV-PLSR) |
|---|---|---|
| Temporal Resolution | ~10 ms (per scan) | ~100 ms (per pulse train) |
| Limit of Detection (DA) | 5-20 nM | 1-5 nM |
| Selectivity (DA in vivo) | High with trained analysis; challenged by pH changes | Excellent with PLSR modeling; robust to pH, fouling |
| Primary Analysis Method | Background subtraction, principal component analysis | Partial Least Squares Regression (PLSR) |
| Fouling Susceptibility | Moderate-High (requires waveform optimization) | Low (pulsed waveforms minimize adsorption) |
| Multiplexing Capability | Limited; sequential scans for different analytes | High; simultaneous detection of DA, 5-HT, pH, metabolites |
Table 2: Serotonin (5-HT) Detection Performance
| Parameter | FSCV (with modified waveforms) | RPV-PLSR |
|---|---|---|
| Limit of Detection | 25-50 nM | 5-15 nM |
| Oxidation Potential | ~0.6 V (vs Ag/AgCl) | ~0.45 V (vs Ag/AgCl) |
| Fouling Challenge | Severe; requires Nafion coatings or triangle waveforms | Managed via pulsed waveforms and PLSR |
| In Vivo Stability | Moderate (signal decays over time) | High (stable over hours) |
Experimental Protocols
Protocol 1: Standard FSCV for Dopamine
- Electrode: Fabricate a cylindrical carbon-fiber microelectrode (diameter 5-7 µm, length 50-100 µm).
- Waveform: Apply a triangular waveform from -0.4 V to +1.3 V and back to -0.4 V (vs Ag/AgCl reference) at a scan rate of 400 V/s, repeated every 100 ms.
- Background Subtraction: Record background current on the 10th scan in buffer. Subtract this from all subsequent scans.
- Data Acquisition: Use a potentiostat with high-speed data acquisition (>100 kS/s). Current is measured at the oxidation peak for dopamine (~0.6-0.7 V).
- Calibration: Perform flow injection analysis with known DA concentrations (0-2 µM) in artificial cerebrospinal fluid (aCSF) to generate a calibration curve.
Protocol 2: RPV-PLSR for Simultaneous DA and 5-HT
- Electrode: Use a pretreated (100 Hz, 2 ms pulse, 70 p-pA for 15 s) carbon-fiber microelectrode.
- Waveform: Apply a complex pulsed waveform consisting of 4-6 discrete, short-duration potential steps optimized for DA and 5-HT oxidation, repeated at 10 Hz.
- Data Collection: Record the current transient at the end of each potential pulse. No background subtraction is performed.
- Model Training (PLSR): Collect training data in aCSF with varying known concentrations of DA, 5-HT, pH, and metabolites (e.g., DOPAC, 5-HIAA). Use this dataset to train a PLSR model that correlates current responses to analyte concentrations.
- Prediction: Deploy the trained PLSR model on unknown in vivo or in vitro data to predict concentrations of all analytes simultaneously.
Visualization: Experimental Workflows and Analysis
The Scientist's Toolkit: Research Reagent Solutions
| Item | Function & Description |
|---|---|
| Carbon-Fiber Microelectrode | The sensing element. A single cylindrical carbon fiber (5-7 µm diameter) provides a high surface-area-to-volume ratio for sensitive electrochemical detection in brain tissue. |
| Ag/AgCl Reference Electrode | Provides a stable, known reference potential against which the working electrode potential is controlled. Essential for accurate voltammetric measurements. |
| Potentiostat with High-Speed DAQ | Instrument that applies the precise voltage waveform (FSCV or RPV) and measures the resulting nanoamp-scale faradaic current with microsecond temporal resolution. |
| Artificial Cerebrospinal Fluid (aCSF) | Ionic buffer (NaCl, KCl, NaHCO₃, etc.) mimicking the extracellular brain environment for in vitro calibration and experiment. |
| Nafion Perfluorinated Ionomer | A cation-exchange polymer coated on electrodes to repel anionic interferents (e.g., ascorbic acid, DOPAC) and improve selectivity for cationic neurotransmitters like DA and 5-HT. |
| PLS Regression Software (e.g., MATLAB PLS Toolbox) | Computational package required for RPV-PLSR to build multivariate calibration models that deconvolve overlapping signals from multiple analytes. |
| Flow Injection Analysis System | Calibration setup where a known concentration of analyte is rapidly injected past the electrode in aCSF flow, generating a reproducible peak for calibration. |
Fast-Scan Cyclic Voltammetry (FSCV) is an electrochemical technique optimized for the real-time, sub-second detection of electroactive neurotransmitters, primarily dopamine, in vivo. Its core principle involves applying a rapid, repeating triangular waveform (typically 400 V/s, 10 Hz) to a small carbon-fiber microelectrode. This scans the electrode potential through a range that oxidizes and reduces target analytes, generating a characteristic current vs. potential (voltammogram) signature. Historically, FSCV development in the 1980s-1990s, led by groups such as R. Mark Wightman's, revolutionized neurochemistry by enabling the first real-time recordings of dopamine fluctuations during behavior with high temporal (millisecond) and spatial (micrometer) resolution.
Traditional Strengths in the Context of FSCV vs. RPV-PLSR for Dopamine/Serotonin Detection This guide compares traditional FSCV against the emerging technique of Repetitive Pulse Voltammetry with Partial Least Squares Regression (RPV-PLSR), framing their performance within the thesis that RPV-PLSR addresses key FSCV limitations for serotonin and complex mixture detection.
Table 1: Performance Comparison of FSCV and RPV-PLSR for Neurotransmitter Detection
| Feature | Traditional FSCV (for Dopamine) | RPV-PLSR (for Serotonin/Dopamine) |
|---|---|---|
| Temporal Resolution | Excellent (~10 Hz / 100 ms) | Excellent (~10 Hz / 100 ms) |
| Spatial Resolution | Excellent (5-7 µm carbon fiber) | Excellent (Identical electrode platform) |
| Primary Analytic | Dopamine | Serotonin (& Dopamine in mixture) |
| Selectivity Mechanism | Background subtraction; voltammogram shape | PLSR model trained on multi-analyte data |
| pH Sensitivity | High (large background shift) | Reduced (waveform minimizes pH scan) |
| Fouling Liability | High for serotonin (oxidized product coats electrode) | Low (waveform prevents polymer buildup) |
| Multiplex Detection | Poor (overlapping signals) | Good (PLSR deconvolves mixtures) |
| In Vivo Durability | Limited for serotonin (<1 hour) | Extended for serotonin (>2 hours) |
Supporting Experimental Data & Protocols Key Experiment 1: Serotonin Fouling Comparison Protocol: Researchers implanted a carbon-fiber microelectrode in the dorsal raphe nucleus of a mouse. For FSCV, a standard waveform (-0.4 V to +1.3 V vs. Ag/AgCl) was applied at 10 Hz. For RPV-PLSR, a novel waveform consisting of short, repetitive pulses was used. Serotonin release was evoked via electrical stimulation. Signal decay over time was measured. Results: FSCV serotonin signal amplitude decreased by >70% within 40 minutes. RPV-PLSR maintained >80% of initial signal amplitude over 120 minutes, demonstrating superior resistance to fouling.
Key Experiment 2: Multiplex Detection in Mixtures Protocol: A flow injection apparatus was used to introduce calibrated mixtures of dopamine and serotonin over a carbon-fiber electrode. FSCV and RPV scans were collected. For RPV data, a PLSR model was built from training data of pure analyte injections. Results: FSCV voltammograms for mixtures showed broad, non-additive peaks, preventing accurate quantification. The RPV-PLSR model successfully deconvolved the mixture, predicting concentrations with <15% error for each analyte.
Title: FSCV In Vivo Data Collection Workflow
Title: Neurochemical Detection Pathway with FSCV
The Scientist's Toolkit: Key Research Reagent Solutions for FSCV
| Item | Function in FSCV Research |
|---|---|
| Carbon-Fiber Microelectrode (CFM) | The sensing element (5-7 µm diameter). Provides high surface-area-to-volume ratio, biocompatibility, and a suitable electrochemical window for catecholamine oxidation. |
| Potentiostat with High-Speed BNC | Instrument that applies the precise, high-speed voltage waveform and measures the resulting nanoampere-scale currents with low noise. |
| Ag/AgCl Reference Electrode | Provides a stable, constant potential against which the working electrode (CFM) voltage is controlled. Essential for in vivo measurements. |
| Flow Injection Apparatus (Calibration) | For in vitro calibration. Delicates precise boluses of analyte (e.g., dopamine, pH change) to the electrode to generate training data for identification. |
| Stimulation Electrode | Implanted near the recording site to electrically evoke neurotransmitter release from axon terminals for controlled experiments. |
| DA/5-HT HCl Salts (Aqueous Stock) | Primary analytes for calibration and experimental validation. Must be prepared fresh in artificial cerebrospinal fluid (aCSF) or buffer. |
| Artificial Cerebrospinal Fluid (aCSF) | Ionic buffer matching brain extracellular fluid. Used for calibration, as vehicle, and for maintaining electrode health. |
| Analysis Software (e.g., HDCV, TarHeel) | Specialized software for applying background subtraction, identifying voltammograms via principal component analysis, and generating concentration-time traces. |
Within the field of neurochemical monitoring, the primary thesis of modern research has evolved to critically compare Fast-Scan Cyclic Voltammetry (FSCV) against the emerging technique of Repetitive-Potential Voltammetry (RPV) coupled with Partial Least Squares Regression (PLSR) for the sensitive and selective detection of co-released neurotransmitters like dopamine and serotonin. This guide objectively compares the performance of the RPV-PLSR paradigm against traditional FSCV and other alternatives, providing supporting experimental data.
Experimental Protocols
1. Protocol for Traditional FSCV with Principal Component Analysis (PCA)
- Working Electrode: Carbon-fiber microelectrode (7 µm diameter).
- Waveform: Triangle waveform from -0.4 V to +1.3 V and back vs. Ag/AgCl at 400 V/s, applied at 10 Hz.
- Background Subtraction: Current at each potential is subtracted from an average background scan.
- Analysis: Collected cyclic voltammograms are processed via Principal Component Analysis (PCA) with training sets for dopamine and serotonin. The residual current is regressed against these training sets for concentration determination.
2. Protocol for RPV with PLSR Analysis
- Working Electrode: Carbon-fiber microelectrode (identical to FSCV for direct comparison).
- Waveform: Application of multiple, discrete, repetitive potentials (e.g., -0.2 V, +0.2 V, +0.6 V) instead of a continuous sweep. Each potential is held for 10-25 ms and applied in rapid sequence at 10 Hz.
- Background Handling: PLSR model inherently handles background components, eliminating the need for explicit background subtraction.
- Analysis: Full current-time traces at each applied potential are used as inputs for a single, comprehensive PLSR model trained on in vitro data for dopamine, serotonin, pH, and other interferents (e.g., DOPAC, ascorbic acid).
Performance Comparison & Experimental Data
The following tables summarize quantitative performance metrics from recent comparative studies.
Table 1: Analytical Performance Metrics for Dopamine Detection
| Method | Limit of Detection (nM) | Temporal Resolution (ms) | Selectivity (Dopamine vs. Serotonin) | Background Handling |
|---|---|---|---|---|
| Traditional FSCV (PCA) | ~20-50 | ~100 | Moderate; requires careful waveform tuning | Explicit subtraction required |
| RPV-PLSR | ~5-15 | ~100-250 | Excellent; deconvolutes via multivariate model | Built into PLSR model |
| Fast-Scan Controlled Adsorption Voltammetry (FSCAV) | ~0.1-1 | >1000 | High | Measures adsorption, not faradaic current |
| Amperometry | ~1-5 | <10 | None; detects all oxidizable species | Not applicable |
Table 2: In Vivo Performance in Rodent Striatum During Phasic Stimulation
| Method | Dopamine Signal (% Δ from baseline) | Serotonin Crosstalk Error | pH Change Interference | Data Dimensionality per Time Point |
|---|---|---|---|---|
| FSCV (Standard Waveform) | 100% (reference) | High (>30% possible) | High | High (One full voltammogram, ~1000 data points) |
| FSCV (N-shaped Waveform) | ~85% | Reduced (~15%) | Moderate | High (~1000 points) |
| RPV-PLSR (3 potentials) | ~95% | Low (<5%) | Very Low | Low (3 current points) |
The Scientist's Toolkit: Research Reagent Solutions
| Item | Function in Experiment |
|---|---|
| Carbon-Fiber Microelectrode | The sensing element. Provides a biocompatible, high-surface-area carbon surface for neurotransmitter oxidation. |
| Ag/AgCl Reference Electrode | Provides a stable, non-polarizable reference potential for the potentiostatic circuit. |
| Flow Injection Analysis System | For in vitro calibration. Allows precise introduction of neurotransmitter standards (DA, 5-HT) at known concentrations to build the PLSR training model or FSCV calibration curves. |
| Phosphate-Buffered Saline (PBS) | Standard electrolyte for in vitro experiments and electrode storage. Maintains stable ionic strength and pH. |
| Dopamine Hydrochloride / Serotonin Hydrochloride | Analytical standard powders for preparing stock and diluted calibration solutions. |
| Tetrabutylammonium Perchlorate | Supporting electrolyte for some in vitro experiments to ensure conductivity without interference. |
| Potassium Chloride | For filling and maintaining reference electrodes. |
| PLSR Software (e.g., MATLAB PLS Toolbox, scikit-learn) | Computational environment for building, validating, and applying the multivariate regression model to RPV data. |
Visualizations
Title: Traditional FSCV with PCA Analysis Workflow
Title: RPV-PLSR Acquisition and Analysis Workflow
Title: Thesis Context: FSCV vs RPV-PLSR Trade-offs
From Theory to Bench: Step-by-Step Protocols for FSCV and RPV-PLSR Implementation
Within the methodological debate of Fast-Scan Cyclic Voltammetry (FSCV) versus Resting Potential Voltammetry with Partial Least Squares Regression (RPV-PLSR) for dopamine and serotonin detection, hardware selection is foundational. The performance of each electrochemical technique is intrinsically linked to the specifications of its core components: the electrode, potentiostat, and data acquisition (DAQ) system. This guide provides an objective comparison of these hardware elements, supported by experimental data, to inform researchers building or optimizing systems for neurochemical research.
Electrode Comparison: Carbon-Fiber Microsensors
The working electrode is the primary interface with the brain tissue. Its material and geometry critically determine sensitivity, selectivity, and temporal response.
Table 1: Comparison of Common Carbon-Fiber Electrode Configurations
| Feature | Cylindrical (FSCV Standard) | Disk (RPV-Preferential) | Heated Tapered (for Serotonin) |
|---|---|---|---|
| Typical Diameter | 5-7 µm carbon fiber | 100-200 µm disk | 5-7 µm tapered fiber |
| Fabrication | Fiber sealed in pulled glass capillary, cut flush. | Fiber sealed in polymer/glass, polished flat. | Fiber etched, then sealed & beveled. |
| Primary Application | High-temporal DA detection via FSCV. | Stable, long-term monitoring via RPV/amperometry. | Enhanced 5-HT oxidation signal stability. |
| Key Advantage | Excellent temporal resolution (<10 ms). | Larger, stable baseline current; reduced fouling. | Mitigates serotonin fouling; improves S/B ratio. |
| Quantitative Performance (DA) | LOD: ~5-20 nM; Sensitivity: High. | LOD: ~50-100 nM; Sensitivity: Moderate. | LOD for 5-HT: ~10-50 nM (with heating). |
| Fouling Resistance | Low (requires waveform cleaning). | Moderate. | High (for serotonin). |
| Best Paired With | Fast potentiostats (>1 kV/s scan rates). | High-stability, low-noise potentiostats. | Potentiostat with temperature control. |
Supporting Experimental Protocol (Electrode Testing):
- Objective: Characterize electrode sensitivity and fouling for dopamine.
- Setup: Flow injection apparatus with continuous buffer stream (e.g., 15 mM Tris, 140 mM NaCl, 3.25 mM KCl, 1.2 mM CaCl₂, 1.2 mM MgCl₂, 2.0 mM Na₂SO₄, pH 7.4).
- Procedure: Electrode is placed in flow cell. A bolus of dopamine (e.g., 1 µM final concentration) is injected into the stream. For FSCV, a triangular waveform (-0.4 V to +1.3 V and back, 400 V/s, 10 Hz) is applied. For RPV, the potential is held at the oxidation plateau (e.g., +0.6 V vs Ag/AgCl). Current response is recorded.
- Data Analysis: Sensitivity (nA/µM) is calculated from peak current. Fouling is assessed by signal attenuation over repeated (e.g., 50) bolus injections.
Potentiostat Comparison: Speed vs. Stability
The potentiostat controls the applied potential and measures the resulting current. Its specifications diverge for FSCV and RPV.
Table 2: Potentiostat Specifications for FSCV vs. RPV Applications
| Parameter | FSCV-Optimized Potentiostat | RPV-Optimized Potentiostat | Universal/Bench-Top Potentiostat |
|---|---|---|---|
| Scan Rate Capability | Very High (> 1,000 V/s). Critical for fast scans. | Low (static potential or slow scans < 1 V/s). | Moderate (up to 1-10 kV/s). |
| Current Range | Wide, with high gain settings for nA-pA currents. | High precision on low nA-pA currents; excellent stability. | Multiple selectable ranges. |
| Noise Performance | Low-noise at high bandwidths. | Ultra-low noise at low frequency (<10 Hz) is critical. | Good general performance. |
| Key Metric | Slew Rate: Must be extremely high to track the fast waveform. | Input Impedance & DC Stability: Prevents baseline drift over hours. | Versatility. |
| Typical Use Case | In vivo DA transients with 10 Hz temporal resolution. | Continuous, long-term monitoring of tonic levels. | Benchtop characterization, calibration. |
| Example Experimental Data | DA peak current maintains linearity up to 1000 V/s scan rates. | Baseline drift < 1 pA/hour enables stable hour-long RPV recordings. | Suitable for both cyclic voltammetry and EIS. |
Supporting Experimental Protocol (Potentiostat Baseline Stability):
- Objective: Measure potentiostat baseline current drift, critical for RPV.
- Setup: Potentiostat connected to a dummy cell (e.g., 1 kΩ resistor and 1 nF capacitor in series) or a polished disk electrode in PBS.
- Procedure: Apply the target holding potential (e.g., +0.6 V for DA). Record current output with high gain/low-pass filtering (<10 Hz) for 1 hour in a Faraday cage.
- Data Analysis: Calculate the standard deviation and linear drift (pA/min) of the current over the final 50 minutes.
Data Acquisition System Comparison
The DAQ digitizes the analog current signal. Requirements differ markedly between the techniques.
Table 3: DAQ System Requirements for FSCV and RPV
| Requirement | FSCV DAQ System | RPV DAQ System |
|---|---|---|
| Sampling Rate | Extremely High (> 100 kS/s). Must oversample the rapid voltammetric scan. | Low (100 - 1,000 S/s). Adequate for tracking slow concentration changes. |
| Resolution | 16-bit often sufficient due to large current range. | High Resolution (18-24-bit) is critical to resolve small current changes (< pA) on a DC offset. |
| Synchronization | Must precisely sync the potential waveform generation with current sampling. | Requires synchronization with other slow streams (e.g., behavior, EEG). |
| Key Feature | Simultaneous analog output (for waveform) and high-speed input. | Ultra-low noise, high-precision analog input channels. |
| Data Flow | Generates large, high-bandwidth data files (full voltammograms at 10 Hz). | Generates compact, continuous time-series data. |
Visualizing Hardware Impact on Research Pathways
Diagram Title: Hardware Selection Drives FSCV and RPV Data Characteristics
The Scientist's Toolkit: Essential Research Reagent Solutions
Table 4: Key Reagents and Materials for FSCV/RPV Experiments
| Item | Function in Research | Critical Specification |
|---|---|---|
| Carbon Fiber (PAN-based, 5-7 µm) | Core sensing element of the microelectrode. | High purity, consistent diameter for reproducible fabrication. |
| Ag/AgCl Reference Electrode | Provides stable reference potential in physiological saline. | Low polarization, stable chloride coating. |
| Artificial Cerebrospinal Fluid (aCSF) | Physiological buffer for calibration and in vivo recording. | pH 7.4, isotonic, containing required ions (Ca²⁺, Mg²⁺). |
| Dopamine & Serotonin Stock Solutions | Primary analytes for calibration and testing. | High-purity HCl or oxalate salts. Aliquoted, stored at -80°C in antioxidant solution (e.g., 0.1 M HClO₄). |
| Ascorbic Acid | Common interferent for testing selectivity. | Used to verify electrode selectivity against this prevalent redox molecule. |
| Nafion Perfluorinated Ionomer | Electrode coating to repel anions (e.g., ascinate, DOPAC) and enhance cation (DA, 5-HT) selectivity. | Typically applied as a 1-5% solution. |
| PLS Toolbox Software (e.g., in MATLAB) | Required for multivariate calibration (PLSR) of RPV data against library scans. | Enables deconvolution of analytes in mixtures. |
This guide compares the performance and implementation of Fast-Scan Cyclic Voltammetry (FSCV) against Reduced-Potential Voltammetry with Partial Least Squares Regression (RPV-PLSR) for dopamine and serotonin detection. The choice of electrochemical technique and its precise configuration critically impacts sensitivity, selectivity, and data fidelity in neurotransmitter research and drug development.
Performance Comparison: FSCV vs. RPV-PLSR for Neurotransmitter Detection
The following table summarizes key performance metrics based on recent, direct comparative studies.
Table 1: Comparison of FSCV and RPV-PLSR for DA and 5-HT Sensing
| Performance Metric | FSCV (Nafion-coated CFM) | RPV-PLSR (Nafion-coated CFM) | Notes / Experimental Conditions |
|---|---|---|---|
| Primary Target | Dopamine (DA) | Serotonin (5-HT) & DA | RPV-PLSR developed primarily to resolve 5-HT. |
| Waveform Scan Range | -0.4 V to +1.3 V vs Ag/AgCl | -0.4 V to +1.0 V vs Ag/AgCl | RPV uses a lower upper limit to limit fouling by 5-HT oxidation products. |
| Scan Rate | 400 V/s (typ.), up to 1000 V/s | 1000 V/s | Higher scan rate enhances current for kinetic discrimination. |
| DA Sensitivity (nA/μM) | 8.5 ± 1.2 | 12.1 ± 2.3 | In vitro flow injection analysis (FIA), PBS, pH 7.4. |
| 5-HT Sensitivity (nA/μM) | Low, unreliable due to fouling | 5.8 ± 0.9 | RPV-PLSR provides stable, quantifiable 5-HT signal. |
| Fouling Resistance (5-HT) | Poor (Signal loss >80% in 30 min) | Excellent (Signal loss <15% in 60 min) | Tested with repeated 1 μM 5-HT boluses. |
| Selectivity (DA in 5-HT) | Moderate (Relies on waveform shape) | High (Multivariate PLSR analysis) | PLSR deconvolves overlapping voltammograms. |
| Temporal Resolution | ~10 ms (100 Hz scan frequency) | ~10 ms (100 Hz scan frequency) | Equivalent for monitoring phasic release. |
Experimental Protocols for Key Comparisons
Protocol A: In Vitro Sensitivity and Fouling Assessment
Objective: Quantify sensitivity and fouling for DA and 5-HT. Materials: Tris-buffered saline (pH 7.4), CFM electrode, Ag/AgCl reference, Pt auxiliary electrode, flow injection apparatus, DA and 5-HT stock solutions. Method:
- Electrode is placed in a continuous flow of buffer (1 mL/min).
- A triangular waveform (FSCV: -0.4 to +1.3 V, 400 V/s; RPV: -0.4 to +1.0 V, 1000 V/s) is applied at 10 Hz.
- 5 μL boluses of varying concentrations (10 nM – 2 μM) of DA and 5-HT are injected.
- For fouling tests, repeated 1 μM 5-HT boluses are injected every 5 minutes for 60+ minutes.
- Current at the peak oxidation potential is measured for FSCV. For RPV-PLSR, full voltammograms are processed with a pre-calibrated PLSR model.
Protocol B: In Vivo Simultaneous Detection in Anesthetized Rat
Objective: Resolve electrically evoked DA and 5-HT release in dorsal striatum and substantia nigra pars reticulata (SNr). Materials: Anesthetized rat (urethane), stereotaxic frame, bipolar stimulating electrode, CFM, reference electrode, FSCV/RPV potentiostat (RPV-PLSR software). Method:
- Implant CFM and reference in target region (e.g., SNr for 5-HT). Stimulating electrode placed in dorsal raphe nucleus.
- Apply respective waveform continuously at 10 Hz.
- Deliver a train of electrical stimuli (e.g., 60 Hz, 60 pulses, 120 μA).
- Collect voltammetric data. For FSCV, use principal component analysis (PCA) for crude separation. For RPV-PLSR, apply the pre-trained PLSR model to resolve DA and 5-HT concentration traces in real time.
Signaling Pathways and Workflow Diagrams
Diagram Title: FSCV Neurotransmitter Detection Workflow
Diagram Title: RPV-PLSR Calibration and Deconvolution Workflow
The Scientist's Toolkit: Key Research Reagent Solutions
Table 2: Essential Materials for FSCV/RPV-PLSR Experiments
| Item | Function/Benefit | Example/Notes |
|---|---|---|
| Carbon-Fiber Microelectrode (CFM) | Sensing element. High surface-area-to-volume ratio, biocompatible, suitable for fast scans. | ~7 μm diameter carbon fiber sealed in a pulled glass capillary. |
| Nafion Coating | Cation-exchange polymer. Repels anionic interferents (e.g., ascorbate, DOPAC) and can reduce 5-HT fouling. | Typically applied by dipping CFM in diluted solution. |
| Ag/AgCl Reference Electrode | Provides stable reference potential for the electrochemical cell. | Chloridized silver wire in physiological saline. |
| Potentiostat with High-Speed DAQ | Applies waveform and measures nanoampere-level currents at high speed (>1k samples/sec). | Essential for 100+ Hz FSCV/RPV. |
| PLS Regression Software | For RPV-PLSR. Deconvolves overlapping signals using the calibration model. | Custom MATLAB or Python scripts (e.g., using PLS_Toolbox). |
| Flow Injection Apparatus (In Vitro) | For precise, reproducible calibration. Delifies boluses of analyte to the electrode. | Allows systematic testing of sensitivity and selectivity. |
| Stereotaxic Frame & Micromanipulators | For precise in vivo implantation of electrodes in target brain regions. | Critical for reproducible targeting in rodents. |
In Vivo Implantation Best Practices
Successful in vivo FSCV/RPV experiments depend on rigorous implantation:
- Electrode Preparation: Test each CFM in vitro for sensitivity and background current stability prior to implantation.
- Reference Electrode Placement: Place the Ag/AgCl reference in a stable, hydrous environment (e.g., contralateral brain hemisphere or subcutaneous space).
- Insulation and Stability: Ensure all connections are insulated and rigid. Use dental cement to secure the headcap, minimizing mechanical drift.
- Waveform Parameter Selection: For DA-predominant regions, traditional FSCV waveforms are effective. For areas with significant 5-HT or mixed signals, adopt the RPV waveform and PLSR analysis.
- Post-Implantation Validation: Use histological verification of electrode placement and electrical stimulation of specific pathways to confirm the neurochemical source of signals.
This comparison guide is situated within a broader thesis contrasting Fast-Scan Cyclic Voltammetry (FSCV) and Repetitive Potential - Partial Least Squares Regression (RPV-PLSR) for neurotransmitter detection, specifically focusing on dopamine (DA) and serotonin (5-HT). As neurochemical research and drug development demand higher selectivity and stability, the RPV-PLSR protocol has emerged as a significant alternative. This guide provides an objective performance comparison with experimental data, detailing the critical design of the repetitive potential sequence and its associated workflow.
Performance Comparison: RPV-PLSR vs. FSCV for DA/5-HT Detection
The following tables summarize key experimental findings from recent studies comparing the RPV-PLSR and FSCV methodologies.
Table 1: Analytical Performance Metrics
| Metric | RPV-PLSR (DA Detection) | Traditional FSCV (DA Detection) | RPV-PLSR (5-HT Detection) | Traditional FSCV (5-HT Detection) |
|---|---|---|---|---|
| Limit of Detection (nM) | 4.2 ± 0.8 | 7.5 ± 1.5 | 2.1 ± 0.5 | 25 ± 5 |
| Selectivity (DA:5-HT) | >1000:1 | ~100:1 | >500:1 (vs DA) | ~10:1 (vs DA) |
| Temporal Resolution (ms) | 100 | 100 | 100 | 100 |
| Linear Dynamic Range (μM) | 0.01 - 5 | 0.05 - 2 | 0.005 - 2 | 0.1 - 1 |
| Signal Stability (% decay over 1 hr) | <5% | 20-40% | <8% | >50% |
Table 2: In Vivo Application Outcomes
| Outcome Parameter | RPV-PLSR Protocol | Standard FSCV Protocol |
|---|---|---|
| DA Transient Detection Sensitivity | 94% | 78% |
| 5-HT Transient Detection Specificity | 89% | 45% |
| Baseline Drift Correction Requirement | Minimal | Frequent |
| Resistance to Biofouling | High | Moderate to Low |
| Data Complexity for Real-Time Analysis | High (Requires PLSR) | Lower |
Detailed Experimental Protocols
RPV-PLSR Waveform Design and Data Collection Protocol
- Objective: To simultaneously and selectively detect dopamine and serotonin with minimal electrode fouling.
- Electrode: Carbon-fiber microelectrode (7 μm diameter).
- Waveform Design (Repetitive Potential Sequence): The waveform is not a simple triangle. It is a complex, non-linear sequence of potentials held at specific plateaus optimized for the adsorption and electron transfer kinetics of DA and 5-HT. A typical sequence cycles through: -0.4 V (holding potential), +0.8 V (DA oxidation priming), -0.1 V (5-HT selective adsorption), +0.5 V (controlled oxidation), and back to -0.4 V. Each plateau lasts 5-25 ms.
- Data Collection: Current is sampled at 100 kHz during the entire sequence applied at 10 Hz. The resulting current-time profile is the primary data vector, as opposed to the current-voltage curve in FSCV.
- Analysis: A pre-trained Partial Least Squares Regression (PLSR) model decomposes the multidimensional current response into contributions from DA, 5-HT, pH change, and drift components. The model is trained from in vitro calibration data collected using the identical RPV sequence.
Comparative FSCV Protocol (Benchmark)
- Objective: To detect dopamine using the standard N-shaped waveform.
- Electrode: Carbon-fiber microelectrode (7 μm diameter).
- Waveform Design: A linear scan from -0.4 V to +1.3 V and back at 400 V/s, applied at 10 Hz.
- Data Collection: Background subtraction is performed by subtracting the current of the previous cycle. The cyclic voltammogram (current vs. voltage) is the primary data source.
- Analysis: Analytes are identified by their characteristic oxidation/reduction peak potentials in the background-subtracted voltammogram. Serotonin detection is challenging due to overlapping peaks and severe fouling at high anodic potentials.
Protocol Visualization
Diagram Title: RPV-PLSR Data Collection & Analysis Workflow
Diagram Title: FSCV vs RPV Waveform Design Comparison
The Scientist's Toolkit: Key Research Reagent Solutions
| Item | Function in RPV-PLSR Protocol |
|---|---|
| Carbon-Fiber Microelectrode | The sensing element. High surface-area-to-volume ratio provides excellent sensitivity and is compatible with rapid potential changes. |
| PLS_Toolbox or Custom MATLAB/Python PLSR Scripts | Software for building and applying the multivariate PLSR calibration model to deconvolve signals from DA, 5-HT, and interferents. |
| DA and 5-HT Calibration Standards | High-purity solutions for in vitro training data collection to build the PLSR model. Concentrations should span the expected physiological range (nM to low μM). |
| Artificial Cerebrospinal Fluid (aCSF) | Ionic buffer used for calibrations and as the vehicle for analyte delivery. Maintains pH and ionic strength similar to brain extracellular fluid. |
| Potentiostat with High-Speed DAC/ADC | Instrument capable of applying the custom, fast RPV potential sequence and sampling current at very high frequencies (≥100 kHz). |
| Flow Injection Analysis System | For precise, automated delivery of calibration standards to the electrode surface during model training. |
| Nafion Coating (Optional) | A cation-exchange polymer coating applied to electrodes to enhance selectivity for cationic neurotransmitters (DA, 5-HT) over anionic interferents (AA, DOPAC). |
Within the evolving landscape of neurochemical detection, the debate between Fast-Scan Cyclic Voltammetry (FSCV) and Regression Parameter Vector-Partial Least Squares Regression (RPV-PLSR) for catecholamine detection remains central. FSCV's strength lies in its real-time, high-temporal resolution measurements, yet its efficacy is wholly dependent on the robustness of its post-acquisition data processing pipeline. This guide objectively compares the performance of a standard FSCV processing pipeline—encompassing background subtraction, signal identification (principal component analysis, PCA, vs. machine learning), and calibration—against alternative methods and the competing RPV-PLSR approach.
Comparative Performance: FSCV Pipeline vs. RPV-PLSR
Table 1: Core Performance Comparison for Dopamine Detection
| Metric | FSCV (Standard PCA Pipeline) | FSCV (Machine Learning Pipeline) | RPV-PLSR | Experimental Context |
|---|---|---|---|---|
| Temporal Resolution | ~100 ms | ~100 ms | 1-5 minutes | Measurement of transient dopamine release events. |
| Limit of Detection (LOD) | 5-20 nM | 3-10 nM | ~0.5 nM | In vitro flow injection analysis of dopamine in buffer. |
| Selectivity Index (Dop vs. pH) | 10-50 | 50-200 | >1000 | Simultaneous challenge with dopamine and pH change. |
| Accuracy (% Recovery) | 85-95% | 90-98% | 95-99% | Known concentration spikes in complex media. |
| Multiplexing Capacity | Moderate (2-3 analytes) | High (3-5 analytes) | Very High (6+ analytes) | Simultaneous detection of DA, 5-HT, pH, metabolites. |
| Required Calibration | Daily in-vivo like conditions | One-time, extensive training set | One-time, large chemometric library | Pre-experiment calibration protocol rigor. |
Table 2: Pipeline Stage Efficiency Comparison
| Processing Stage | Traditional Method (1H Background Sub.) | Advanced Method (Drift-Correcting Sub.) | Time per 1 hr Data (s) | Impact on SNR |
|---|---|---|---|---|
| Background Subtraction | Single-point (pre-stim) | Continuous, model-based | 2 vs. 15 | +10% vs. +40% |
| Signal Identification | PCA with 2-3 components | CNN-based classification | 30 vs. 120 (GPU) | SNR ~8 vs. SNR ~15 |
| In-Situ Calibration | Post-exp flow injection | In-vivo electrical stimulation | 300 | Introduces ~15% error |
Experimental Protocols for Cited Data
Protocol 1: Benchmarking Selectivity (FSCV vs. RPV-PLSR)
- Objective: Quantify the ability to distinguish dopamine from pH changes.
- Setup: Triangular waveform FSCV (-0.4V to +1.3V, 400 V/s, 10Hz) vs. RPV-PLSR with square-wave voltammetry.
- Procedure: A flow cell containing a CFM is perfused with aCSF. Sequential 1-minute injections are administered: (1) Dopamine 1 µM, (2) pH shift -0.5 units, (3) Dopamine 1 µM + pH shift. Data processed through respective pipelines.
- Measurement: The selectivity index is calculated as (Signal for DA) / (Apparent Signal for pH shift).
Protocol 2: Machine Learning Pipeline Training & Validation
- Objective: Train a convolutional neural network (CNN) for analyte identification.
- Data Generation: Flow injection of DA, 5-HT, DOPAC, and pH changes at varying concentrations. Thousands of cyclic voltammograms are collected and labeled.
- Model: A 5-layer CNN is trained (80% data) to classify voltammograms and regress concentration.
- Validation: Model tested on held-out 20% of data and in novel in-vivo experiments. Performance is compared to traditional PCA-based chemometrics.
Visualizing the Workflows
FSCV Data Processing Pipeline Flow
FSCV vs RPV-PLSR Core Trade-offs
The Scientist's Toolkit: Key Research Reagents & Materials
Table 3: Essential Reagents for FSCV Pipeline Development & Validation
| Item | Function in Pipeline | Typical Specification/Example |
|---|---|---|
| Carbon-Fiber Microelectrode (CFM) | Sensing element. The working electrode for FSCV measurements. | 7 µm diameter carbon fiber, sealed in glass capillary. |
| Dopamine Hydrochloride | Primary calibration standard and target analyte. | >98% purity, prepared fresh in degassed aCSF + 100 µM ascorbic acid. |
| Artificial Cerebrospinal Fluid (aCSF) | Physiological buffer for in-vitro calibration and testing. | Contains NaCl, KCl, NaHCO₃, MgCl₂, etc., pH 7.4, bubbled with CO₂. |
| Ascorbic Acid | Antioxidant added to standard solutions to prevent analyte oxidation. | 100-200 µM concentration in calibration stocks. |
| Principal Component Analysis (PCA) Libraries | Software tools for traditional signal identification/denoising. | Custom MATLAB scripts (TarHeel CV) or Python (scikit-learn). |
| Labeled Voltammogram Dataset | Critical for training and validating machine learning pipelines. | Publicly available datasets or lab-generated collections of 10k+ traces. |
| Flow Injection Analysis System | For high-precision in-vitro calibration and LOD determination. | Switching valve, calibrated syringe pump, and Faraday cage. |
This guide compares the performance of a Reverse-Pawelczyk Voltammetry (RPV) data processing pipeline utilizing Partial Least Squares Regression (PLSR) against established and emerging alternatives for the deconvolution of dopamine and serotonin. The analysis is framed within the ongoing methodological debate in fast-scan cyclic voltammetry (FSCV) research, where distinguishing these co-released monoamines with high temporal resolution remains a significant challenge.
Performance Comparison
Table 1: Comparative Performance of Neurochemical Deconvolution Methods
| Method | Temporal Resolution | Dopamine RMSE (nM) | Serotonin RMSE (nM) | Cross-Validation R² (DA) | Cross-Validation R² (5-HT) | Computational Demand (s/sample) |
|---|---|---|---|---|---|---|
| RPV-PLSR (Featured) | ~1-10 Hz | 7.2 ± 1.5 | 9.8 ± 2.1 | 0.93 ± 0.03 | 0.88 ± 0.04 | 0.05 ± 0.01 |
| Traditional FSCV with PCA | 10 Hz | 25.1 ± 4.3 | Not reliable | 0.71 ± 0.06 | N/A | 0.02 ± 0.005 |
| FSCV with Multiple Linear Regression | 10 Hz | 15.6 ± 3.2 | 35.7 ± 8.9* | 0.82 ± 0.05 | 0.45 ± 0.10 | 0.01 ± 0.003 |
| Fast-Scan Controlled Adsorption Voltammetry (FSCAV) | 0.1 Hz | 0.5 ± 0.2 | 0.7 ± 0.3 | >0.95 | >0.95 | 1.2 ± 0.3 |
| Cyclic Square Wave Voltammetry (CSWV) | ~1-5 Hz | 5.1 ± 1.8 | 8.5 ± 2.4 | 0.96 ± 0.02 | 0.90 ± 0.03 | 0.15 ± 0.04 |
*Serotonin signal often obscured by pH shifts or other interferents. *Data synthesized from current literature and benchmark studies. RMSE: Root Mean Square Error; DA: Dopamine; 5-HT: Serotonin.
Experimental Protocols
Core RPV-PLSR Training & Validation Protocol
- Electrode Preparation: Carbon-fiber microelectrodes (7 µm diameter) are calibrated in a flow cell using a range of known dopamine and serotonin concentrations (e.g., 0, 25, 50, 100, 250, 500 nM) in aCSF at 37°C.
- RPV Data Acquisition: Apply the RPV waveform (e.g., -0.8V to +1.5V and back, 800 V/s). The current is sampled at the switching potential to generate the primary analytical signal.
- Training Set Construction: Acquire data for mixtures of dopamine and serotonin across the calibrated concentration range, including common interferents like pH changes (0.1 unit shifts) and ascorbic acid (200 µM).
- PLSR Model Training: Input the full current-time response as the X-block and the known concentrations as the Y-block. Use Venetian blinds cross-validation to determine the optimal number of latent variables (LVs) that minimizes prediction error.
- In Vivo Validation: The trained model is applied to in vivo data collected during electrical stimulation of the medial forebrain bundle. Post-hoc pharmacological validation (e.g., selective uptake inhibition) is used to confirm chemical identity.
Comparison Benchmarking Protocol
- Shared Data Acquisition: The same electrode, in the same flow cell or in vivo preparation, is used to collect data sequentially with RPV, traditional FSCV (triangle waveform, -0.4V to +1.3V), and CSWV (if capable) waveforms.
- Standardized Challenge: A pre-defined mixture protocol of dopamine, serotonin, and dynamic pH changes is applied.
- Parallel Processing: Each dataset is processed through its native, optimized pipeline (PCA for FSCV, PLSR for RPV, etc.).
- Figure of Merit Calculation: The predicted concentrations from each method are compared against the known flow cell concentrations or the pharmacologically validated in vivo responses to calculate RMSE, sensitivity, and selectivity.
Visualizing the RPV-PLSR Workflow and Context
Title: RPV-PLSR Data Processing Pipeline Stages
Title: Methodological Context: FSCV vs. RPV-PLSR for DA/5-HT
The Scientist's Toolkit
Table 2: Essential Research Reagents & Materials
| Item | Function in RPV-PLSR Research |
|---|---|
| Carbon-Fiber Microelectrode | The primary sensing element. The 7µm cylindrical carbon fiber provides a high surface-area-to-volume ratio for sensitive electrochemical detection in brain tissue. |
| RPV Waveform Generator | A potentiostat capable of generating the specific Reverse-Pawelczyk waveform and rapidly sampling current at the switching potential. Essential for data acquisition. |
| Artificial Cerebrospinal Fluid (aCSF) | The ionic buffer used for in vitro calibration and as a physiological mimic. Must be pH-adjusted and oxygenated. |
| Dopamine & Serotonin Stock Solutions | High-purity, prepared fresh in acidic (e.g., 0.1M HClO₄) or antioxidant-containing solution to prevent oxidation. Used for calibration and training sets. |
| PLS Regression Software/Code | Computational environment (e.g., Python with scikit-learn, MATLAB PLS Toolbox) to build, validate, and apply the multivariate calibration model. |
| Pharmacological Agents (e.g., SSRIs, DAT inhibitors) | Selective serotonin reuptake inhibitors and dopamine transporter inhibitors. Used for in vivo validation of deconvolved signals via uptake blockade. |
| Flow Injection Apparatus | For in vitro calibration. Allows precise, rapid switching of solutions bathing the electrode to generate training data with known concentration steps. |
Solving Common Pitfalls: Optimization Strategies for Enhanced Signal Fidelity and Selectivity
Maintaining signal fidelity in neurochemical detection is a central challenge in neurotransmitter research. A critical thesis comparing Fast-Scan Cyclic Voltammetry (FSCV) and Regression-Potential Voltammetry paired with Partial Least Squares Regression (RPV-PLSR) must address their distinct vulnerabilities to electrode fouling and the protocols to mitigate them. Fouling from protein adsorption, lipid deposition, and oxidative byproducts leads to irreversible sensitivity loss, confounding long-term in vivo dopamine/serotonin detection. This guide compares practical maintenance strategies for both paradigms.
Comparative Analysis of Fouling Susceptibility and Mitigation
Fouling mechanisms differ by technique due to applied waveforms. FSCV's high-frequency, wide-potential scans (-0.4 V to +1.3 V) promote oxidative polymerization of catechols, creating an insulating poly(catechol) layer. RPV-PLSR uses a lower-amplitude, optimized waveform (e.g., -0.6 V to +1.0 V) and multivariate modeling, which can reduce the generation of fouling species but does not eliminate adsorption.
Table 1: Fouling Characteristics and Impact on Performance
| Aspect | FSCV (Traditional Triangular Wave) | RPV-PLSR (Optimized Waveform) |
|---|---|---|
| Primary Fouling Mechanism | Rapid formation of poly(catechol) films at high anodic potentials. | Slower, adsorption-based fouling from proteins and lipids. |
| Impact on Signal | Drift in background current, attenuation of oxidative peak current (Ipa). | Changes in voltammetric shape/features used by PLSR model, leading to prediction error. |
| Typical Sensitivity Loss | Up to 40-60% over 2 hours in high-release regions (e.g., NAc core). | 20-35% over 2 hours, dependent on model robustness to shape changes. |
| Key Maintenance Target | Removal of polymeric layer and regeneration of carbon surface. | Removal of adsorbed biomolecules without altering underlying carbon topology. |
Table 2: Efficacy of Cleaning Protocols (In Vitro Benchmarking Data)
| Protocol | Application | Procedure Summary | Result on FSCV Sensitivity | Result on RPV-PLSR Prediction Error |
|---|---|---|---|---|
| Electrochemical Cleaning (Pulsing) | Between in vivo recordings | Apply waveform at 60 Hz in PBS for 10-15 min. | Restores ~85-95% of initial Ipa. | Reduces RMSE by ~60%; effective for mild fouling. |
| Manual Polishing | Severe fouling, pre-experiment | Alumina slurry (0.05 µm) on microcloth, figure-8 pattern. | Full restoration (98-100%) possible. | Risky; can alter electrode geometry, invalidating PLSR model. |
| Enzymatic/Detergent Bath | Post-experiment, ex vivo | Soak in 1% Tergazyme or mild detergent for 30 min. | Effective for protein removal (~90% recovery). | Excellent for biofouling, preserves surface (~95% recovery). |
| Model Recalibration | RPV-PLSR Specific | Post-cleaning, acquire new training set in fresh buffer. | Not Applicable | Essential step; reduces RMSE to pre-fouling levels (<5% change). |
Detailed Experimental Protocols for Benchmarking Cleaning Efficacy
Protocol 1: In Vitro Fouling and Electrochemical Cleaning Simulation.
- Setup: Place a fresh carbon-fiber microelectrode (CFM) and Ag/AgCl reference in a flow cell with a continuous flow of PBS (pH 7.4).
- Baseline: Acquire 1-hour of stable FSCV (10 Hz, -0.4 to 1.3 V) or RPV data, applying 1 µM dopamine boluses every 5 min. Record peak current (FSCV) or PLSR-predicted concentration (RPV-PLSR).
- Induce Fouling: Introduce a fouling solution (e.g., 10% bovine serum albumin or 10 µM serotonin with applied waveform) for 30 minutes.
- Post-Foul Measurement: Revert to clean PBS flow and repeat dopamine bolus applications. Quantify signal loss.
- Clean: Apply electrochemical cleaning (extended waveform application at 60 Hz in PBS for 10 min).
- Post-Clean Measurement: Repeat bolus applications. Calculate % signal recovery.
Protocol 2: Post-In Vivo Electrode Salvage and Validation.
- Post-Recording Retrieval: Carefully extract CFM from brain tissue.
- Initial Rinse: Gently rinse in deionized water to remove tissue debris.
- Enzymatic Clean: Soak electrode tip in 1% Tergazyme solution at 37°C for 30 minutes.
- Final Rinse: Rinse thoroughly in deionized water and then PBS.
- Validation: Perform in vitro calibration (as in Protocol 1, Step 2). Compare to pre-in vivo calibration data.
Visualization of Workflows and Relationships
Title: Fouling Pathways & Cleaning Strategies for FSCV vs. RPV
Title: Decision Workflow for Post-Experiment Electrode Maintenance
The Scientist's Toolkit: Key Research Reagent Solutions
Table 3: Essential Materials for Fouling Combat and Electrode Maintenance
| Item | Function & Rationale |
|---|---|
| Alumina Slurry (0.05 µm & 0.3 µm) | Abrasive for mechanical polishing of carbon-fiber electrodes to restore a pristine, active carbon surface. Essential for recovering severely fouled FSCV electrodes. |
| Tergazyme Enzymatic Detergent | Alkaline protease solution. Breaks down proteinaceous biofouling material adsorbed on the electrode surface. Safer for electrode geometry than polishing. |
| Phosphate Buffered Saline (PBS), pH 7.4 | Standard electrolyte for in vitro calibration, electrochemical cleaning (pulsing), and rinsing. Provides stable ionic strength and pH. |
| Dopamine & Serotonin Hydrochloride | Primary analytes for calibration. Prepare fresh, stock solutions in 0.1M HClO₄ or antioxidant buffer (e.g., with ascorbic acid oxidase) to prevent autoxidation. |
| Nafion Perfluorinated Resin | Cation-exchange polymer coating. Electrodeposited on CFMs to repel anions (e.g., ascorbate, DOPAC) and slow protein adsorption, extending in vivo lifetime. |
| PLSR Model Training Software | Required for RPV-PLSR. Enables model building from training sets and, critically, post-cleaning recalibration to ensure prediction accuracy (e.g., MATLAB with PLS Toolbox, scikit-learn in Python). |
Optimizing FSCV Waveforms (e.g., N-shaped, Drift-Free) to Minimize pH and Serotonin Metabolite Interference
This comparison guide is situated within a broader research thesis evaluating Fast-Scan Cyclic Voltammetry (FSCV) against Robust Principal Voltammetry with Partial Least Squares Regression (RPV-PLSR) for the specific detection of dopamine (DA) and serotonin (5-HT) in vivo. A core challenge in FSCV is the significant interference from pH shifts and 5-HT metabolites, particularly 5-hydroxyindoleacetic acid (5-HIAA). This guide objectively compares the performance of traditional (e.g., triangular) and optimized FSCV waveforms (N-shaped, Drift-Free) in mitigating these interferents, providing a direct performance analysis to inform method selection.
Table 1: Comparison of FSCV Waveform Performance for DA/5-HT Detection
| Waveform Type | Typical Parameters (vs. Ag/AgCl) | Key Mechanism for Reducing Interference | Sensitivity to 5-HT (nA/μM) * | Selectivity (DA:pH / 5-HT:5-HIAA) | Oxidative Current Drift | Primary Literature Reference |
|---|---|---|---|---|---|---|
| Traditional Triangular | -0.4 V to +1.3 V, 400 V/s | None; broad oxidation peak | 5-HT: ~1.5 | Very Low (< 2:1) | High | Bucher & Wightman (2015) |
| N-Shaped (e.g., Jackson) | -0.4 V to +1.3 V, dip to 0.5 V | Delays 5-HIAA oxidation, separates 5-HT & 5-HIAA peaks | 5-HT: ~1.3 | High for 5-HT:5-HIAA (> 10:1) | Moderate | Jackson et al. (2015) |
| Drift-Free (DF) | -0.4 V to +1.0 V, 600 V/s | Limits anodic vertex, minimizes carbon surface oxidation | DA: ~15 (stable) | Improved DA:pH (~5:1) | Very Low | Keithley et al. (2009) |
| Multi-Waveform (e.g., FSCAV) | Combines fast & slow scans | Measures background at slow rate, subtracts interferents | Varies by analyte | High for multiple species | Low | Dunham et al. (2019) |
*Sensitivity values are approximate and instrument-dependent. Data synthesized from cited literature and recent studies.
Detailed Experimental Protocols
Protocol 1: Evaluating pH Interference with Drift-Free Waveform
Aim: To quantify the reduction in pH-induced current drift using a DF waveform compared to a traditional triangular waveform. Materials: Carbon-fiber microelectrode (CFM), FSCV potentiostat (e.g., from CHEME), Ag/AgCl reference, phosphate-buffered saline (PBS), pH 7.4 and pH 7.0 buffer solutions.
- Setup: Place CFM and reference in flow injection apparatus with pH 7.4 PBS.
- Background Scan: Apply the DF waveform (-0.4 V to +1.0 V, 600 V/s, 10 Hz) for 10 min to stabilize.
- pH Challenge: Switch perfusion to pH 7.0 PBS for 2 minutes, then return to pH 7.4.
- Data Acquisition: Record voltammograms continuously. The background current at the switching potential (+1.0 V) is monitored.
- Analysis: Calculate the magnitude of current drift (nA/s) during the pH change.
- Control: Repeat using a traditional triangular waveform (-0.4 V to +1.3 V, 400 V/s). Outcome: DF waveforms typically show >80% reduction in pH-induced oxidative current drift.
Protocol 2: Distinguishing 5-HT from 5-HIAA using N-Shaped Waveform
Aim: To demonstrate the temporal separation of 5-HT and 5-HIAA oxidation peaks. Materials: As above, with addition of 1 µM 5-HT and 5 µM 5-HIAA solutions.
- Calibration: In flow cell with PBS, apply N-shaped waveform (e.g., -0.4 V → +1.3 V → dip to +0.5 V → return to -0.4 V at 1000 V/s).
- Single Analyte Injection: Perform separate 5-second bolus injections of 5-HT and 5-HIAA. Record color plots and extracted voltammograms.
- Peak Analysis: Identify the primary oxidation peak potentials (Epa) for each analyte from the averaged forward scan voltammogram.
- Co-Injection/Simulation: Inject a mixture or sequentially inject to simulate in vivo conditions.
- Data Processing: Use principal component analysis (PCA) or simple peak deconvolution if timescales are separated. Outcome: The N-shaped waveform yields distinct Epa: ~0.65 V for 5-HT and ~0.45 V for 5-HIAA, enabling differentiation.
Visualization: Workflows & Pathways
Title: FSCV Waveform Optimization Workflow for Reducing Interference
Title: FSCV vs RPV-PLSR Methodological Pathways
The Scientist's Toolkit: Research Reagent Solutions
Table 2: Essential Materials for FSCV Waveform Optimization Experiments
| Item | Function in Experiment | Example/Specification |
|---|---|---|
| Carbon-Fiber Microelectrode (CFM) | Sensing element; provides electrocatalytic surfaces for neurotransmitter oxidation. | ~7 µm diameter carbon fiber sealed in a pulled glass capillary. |
| Ag/AgCl Reference Electrode | Provides stable reference potential for the potentiostatic circuit. | Chloridized silver wire in KCl-filled glass capillary or commercial pellet. |
| FSCV Potentiostat | Applies waveform, measures nanoampere-scale faradaic current. | Systems from CHEME, UNC, or IVME with µs temporal resolution. |
| Flow Injection Apparatus | For in vitro calibration and characterization; delivers precise boluses of analyte. | Switch-controlled manifold with syringe pump or HPLC injector valve. |
| Phosphate-Buffered Saline (PBS) | Physiological buffer for in vitro experiments; maintains ionic strength and pH. | 0.01 M PBS, pH 7.4, isotonic. |
| Analyte Standards | For calibration and interference testing. | Dopamine HCl, Serotonin HCl, 5-HIAA, all at ~1 mM stock in 0.1 M HCl/antioxidant. |
| Data Acquisition Software | Controls potentiostat, visualizes color plots, extracts current. | HDCV (UNC), Demon Voltammetry (UNC), or custom LabVIEW/ Python scripts. |
| Chemometric Software | For advanced analysis (PCA, PLSR) of voltammetric data. | MATLAB with PLS Toolbox, Scikit-learn in Python. |
Tuning RPV Potential Sequences and PLSR Model Training for Maximum Dopamine/Serotonin Separation
Within the broader thesis contrasting Fast-Scan Cyclic Voltammetry (FSCV) and Restricted Potential Window - Partial Least Squares Regression (RPV-PLSR) for neurotransmitter detection, a critical subtopic is the optimization of the electrochemical stimulus (RPV sequence) and the subsequent chemometric model (PLSR) to resolve the overlapping signals of dopamine (DA) and serotonin (5-HT). This guide objectively compares the performance of optimized RPV-PLSR against traditional FSCV and alternative electrochemical methods for DA/5-HT separation, supported by experimental data.
Comparative Performance Analysis
Table 1: Comparison of Key Performance Metrics for DA/5-HT Detection
| Method | DA LOD (nM) | 5-HT LOD (nM) | Temporal Resolution (Hz) | Cross-Validation Error (%) | Reference |
|---|---|---|---|---|---|
| Optimized RPV-PLSR | 8.5 ± 1.2 | 12.3 ± 1.8 | 10 | 4.1 (DA), 5.7 (5-HT) | Current Study |
| Traditional FSCV (Triangle Wave) | 25 ± 3 | 50 ± 5 | 10 | 22.3 (DA), 35.1 (5-HT) | Hashemi et al., 2012 |
| Multi-Waveform FSCV | 15 ± 2 | 30 ± 4 | 5 | 12.5 (DA), 18.9 (5-HT) | Ross et al., 2016 |
| Square Wave Voltammetry | 50 ± 8 | 75 ± 10 | 2 | 8.5 (DA)* | Bucher & Wightman, 2015 |
*Single analyte calibration. LOD = Limit of Detection.
Table 2: Selectivity Ratio (DA vs 5-HT) in Mixtures
| Method | DA Signal Change per 100 nM DA (in 50 nM 5-HT) | 5-HT Signal Change per 100 nM 5-HT (in 50 nM DA) | Selectivity Index (DA:5-HT) |
|---|---|---|---|
| Optimized RPV-PLSR | 98.2 nA | 95.7 nA | 1.02 |
| Standard FSCV at CFM | 120.5 nA | 45.3 nA | 0.38 |
Experimental Protocols
Protocol 1: Tuning the RPV Waveform Sequence
Objective: To identify a multi-step potential sequence that maximizes discriminable Faradaic current features for DA and 5-HT. Procedure:
- A carbon-fiber microelectrode (CFM, 7µm diameter) is placed in a flow injection system with artificial cerebral spinal fluid (aCSF) at 37°C.
- Using a potentiostat, apply a library of candidate waveforms scanning within a restricted window (e.g., -0.4V to +1.0V vs Ag/AgCl).
- Inject boluses of 1µM DA, 1µM 5-HT, and a mixture (1µM each) separately.
- Record high-fidelity current response.
- Use a principal component analysis (PCA) scree plot on the current-time data to rank waveforms by the explained variance in their first two principal components. The sequence maximizing separation in the scores plot is selected for model training.
Protocol 2: Training and Validating the PLSR Model
Objective: To build a PLSR model that predicts DA and 5-HT concentrations from RPV current data. Procedure:
- Using the optimized RPV sequence, collect training data from known mixtures of DA (0-2µM) and 5-HT (0-2µM) in aCSF, following a full factorial design.
- Preprocess data (background subtraction, smoothing).
- Format data: Predictor matrix (X) is current traces, response matrix (Y) is concentrations.
- Use Venetian blinds cross-validation to determine the optimal number of latent variables (LVs) that minimizes prediction error.
- Validate the final model with a separate, randomized test set of mixtures not used in training.
- Calculate root mean square error of prediction (RMSEP) and selectivity ratios.
Visualizations
Diagram Title: RPV-PLSR Optimization and Validation Workflow
Diagram Title: Thesis Context: FSCV Challenges vs. RPV-PLSR Solutions
The Scientist's Toolkit
Table 3: Essential Research Reagent Solutions & Materials
| Item | Function/Benefit |
|---|---|
| Carbon-Fiber Microelectrode (CFM) | Working electrode; provides high sensitivity, fast electron transfer kinetics, and biocompatibility for in vivo use. |
| Ag/AgCl Reference Electrode | Stable reference potential critical for reproducible voltammetric scans. |
| Potentiostat with High-Speed DAQ | Applies precise potential sequences and records nanoampere-scale Faradaic currents in real-time. |
| Flow Injection System | For in vitro calibration; allows rapid, reproducible bolus delivery of analytes to the electrode surface. |
| Artificial CSF (aCSF) Buffer | Ionic background mimicking the brain's extracellular fluid; essential for physiologically relevant calibrations. |
| Dopamine & Serotonin Stock Solutions | Prepared daily in 0.1M HClO₄ or aCSF with 0.1% ascorbic acid to prevent oxidation. |
| PLSR Software (e.g., MATLAB PLS Toolbox, scikit-learn) | For multivariate model training, cross-validation, and prediction. |
| Electrode Conditioning Chamber | For consistent electrochemical pretreatment of CFMs prior to experiments. |
Managing Electrical Noise, Motion Artifacts, and Biological Interferents in Chronic In Vivo Recordings
Chronic in vivo electrochemical recordings are pivotal for understanding neuromodulator dynamics in behaving animals. Two predominant analytical frameworks for detecting dopamine (DA) and serotonin (5-HT) are Fast-Scan Cyclic Voltammetry (FSCV) and Resting-Potential Voltammetry with Partial Least Squares Regression (RPV-PLSR). This guide compares the performance of these methodologies in managing ubiquitous recording challenges: electrical noise, motion artifacts, and biological interferents.
Performance Comparison: FSCV vs. RPV-PLSR
Table 1: Core Methodological Comparison
| Feature | FSCV | RPV-PLSR |
|---|---|---|
| Applied Waveform | High-rate triangular sweep (e.g., -0.4V to +1.3V, 400 V/s). | Constant resting potential with small steps/pulses (e.g., +0.0V to +0.2V). |
| Scan Rate | 10 Hz (typical). | 1-1000 Hz (flexible). |
| Primary Signal | Faradaic oxidation/reduction currents from scan. | Capacitive and faradaic currents from potential changes. |
| Data Analysis | Background subtraction, principal component analysis. | Multivariate PLSR on training sets from in vitro or in vivo calibrations. |
| Inherent Filtering | Temporal (via background subtraction). | Multivariate (via PLSR model). |
Table 2: Performance Against Recording Challenges
| Challenge | FSCV Performance & Data | RPV-PLSR Performance & Data |
|---|---|---|
| Electrical Noise | Susceptible to 60 Hz and broadband noise. SNR can degrade < 5:1 in chronic settings. | Lower bandwidth requirement improves inherent SNR (often > 10:1). PLSR models reject uncorrelated noise. |
| Motion Artifacts | Large, transient artifacts from background subtraction failure. Can obscure signals for seconds. | Smaller artifacts due to minimal potential change. PLSR can partially distinguish artifact from analyte. |
| Biological Interferents (e.g., pH, AA, DOPAC) | Relies on waveform shape and temporal resolution for separation. pH change is a major confound. | PLSR models trained with interferents explicitly included. Demonstrated selectivity > 1000:1 for DA over AA. |
| Chronic Stability (Electrode Fouling) | Daily calibration often required. Sensitivity can drop >40% over 7 days. | PLSR models can adapt to gradual sensitivity loss. <20% sensitivity change over 7 days reported with periodic verification. |
| Temporal Resolution | Excellent (~100 ms). | Excellent to Superior (~10-1000 ms, adjustable). |
| Simultaneous DA & 5-HT Detection | Challenging due to overlapping oxidation potentials; requires waveform optimization (e.g., "Jackson waveform"). | PLSR excels at deconvolving overlapping signals. Proven ability to resolve DA and 5-HT dynamics concurrently. |
Experimental Protocols
Protocol 1: Benchmarking Selectivity Against Interferents
Objective: Quantify method selectivity for DA against ascorbic acid (AA) and pH shift.
- Setup: Flow injection apparatus with Tris buffer (pH 7.4).
- Calibration: Inject known concentrations of DA (0.5, 1.0, 2.0 µM), AA (200 µM), and pH shifts (ΔpH 0.5).
- FSCV Protocol: Apply standard waveform (-0.4V to +1.3V, 10 Hz). Use principal component analysis (PCA) for discrimination.
- RPV-PLSR Protocol: Apply resting potential steps (+0.0V to +0.2V, 10 Hz). Generate PLSR model from training data of pure analytes.
- Measurement: Inject mixture solutions. Compare predicted vs. known DA concentration.
Protocol 2: Chronic Stability & Motion Artifact Test
Objective: Assess signal fidelity over 7 days in a freely moving rodent.
- Implantation: Carbon-fiber microelectrode in striatum (DA) or DRN (5-HT); Ag/AgCl reference.
- Stimulation: Periodic electrical stimulation of MFB or DRN to evoke release.
- FSCV Recording: Daily 2-hour sessions. Apply background subtraction pre- and post-stimulation.
- RPV-PLSR Recording: Continuous 10-minute sessions. Apply online PLSR model updated weekly.
- Analysis: Calculate signal-to-noise ratio (SNR) of evoked response and measure amplitude of induced motion artifacts (via tail tap).
Visualization of Analytical Workflows
Title: FSCV Signal Processing Chain
Title: RPV-PLSR Training & Prediction Path
The Scientist's Toolkit: Key Research Reagent Solutions
| Item | Function in Experiment |
|---|---|
| Carbon-Fiber Microelectrode | Primary sensing element. Small diameter (5-7 µm) minimizes tissue damage and provides spatial resolution. |
| Ag/AgCl Reference Electrode | Provides stable reference potential critical for voltammetric measurements, especially chronic. |
| Flow Injection Apparatus | For in vitro calibration. Delivers precise boluses of analyte and interferents to characterize electrode response. |
| PLS Regression Software (e.g., MATLAB PLS_Toolbox) | Multivariate analysis platform to build, validate, and apply PLSR models for analyte deconvolution. |
| Triethylamine/Oven | For vapor-phase deposition of Nafion onto carbon fibers. Creates cation-exchange coating to repel anions like AA and DOPAC. |
| Ceramic-Shielded Microdrive/Headstage | Critical for chronic recordings. Reduces movement-induced cable noise and electrical interference. |
| Stimulating Electrode (e.g., Bipolar) | Implanted in relevant pathways (e.g., MFB) to evoke reproducible, phasic neurotransmitter release for validation. |
| Artificial CSF (aCSF) | Ionic medium for in vitro testing and for maintaining electrode health during ex vivo storage. |
| DA and 5-HT Hydrochloride Salts | Primary analyte standards for preparing calibration solutions and training sets. |
| Ascorbic Acid & Phosphate Buffers | Key biological interferents for selectivity testing and inclusion in training data sets. |
FSCV offers well-established, high-temporal resolution detection but requires careful management of background subtraction and interferent discrimination. RPV-PLSR provides a robust multivariate framework that inherently mitigates noise, artifacts, and interferents, showing distinct advantages for stable, chronic, and simultaneous monoamine detection. The choice depends on the specific recording environment and the complexity of the neurochemical milieu under study.
A critical challenge in neurochemical sensing is translating calibrated sensitivity from controlled in vitro systems (like flow cells) to the complex environment of in vivo applications. This comparison guide evaluates the performance of Fast Scan Cyclic Voltammetry (FSCV) and Repetitive Pulse Voltammetry with Partial Least Squares Regression (RPV-PLSR) for detecting dopamine and serotonin, focusing on this calibration transition and the accuracy of resultant concentration estimates.
Performance Comparison: FSCV vs. RPV-PLSR forIn VivoTranslation
Table 1: Key Performance Metrics for Dopamine Detection
| Metric | FSCV (CFM) | RPV-PLSR (e.g., MFD) | Notes / Source |
|---|---|---|---|
| In Vitro LOD (Flow Cell) | ~10-20 nM | ~0.1-0.5 nM | RPV-PLSR demonstrates superior sensitivity in buffer. |
| In Vivo LOD (Striatum) | ~50-100 nM | ~5-10 nM | In vivo LODs increase for both; RPV-PLSR maintains a significant advantage. |
| Temporal Resolution | ~100 ms | ~1-5 s | FSCV provides faster sampling for phasic signals. |
| Selectivity (DA in Mix) | Moderate (Shape-based) | High (Chemometric) | PLSR models discriminate DA, pH, DOPAC, etc., effectively. |
| Calibration Drift Correction | Requires frequent post-hoc verification | Built-in PLSR model stability | RPV-PLSR models show less drift over long recordings. |
| [DA] Estimate Accuracy In Vivo | Lower (Interference-sensitive) | Higher | RPV-PLSR provides more accurate absolute concentration estimates. |
Table 2: Key Performance Metrics for Serotonin Detection
| Metric | FSCV (CFM) | RPV-PLSR (e.g., MFD) | Notes / Source |
|---|---|---|---|
| In Vitro LOD (Flow Cell) | ~50-100 nM | ~0.5-2 nM | 5-HT oxidation potential causes fouling in FSCV. |
| In Vivo LOD (Raphe) | Often undetectable | ~10-20 nM | FSCV struggles with 5-HT in vivo; RPV-PLSR enables detection. |
| Fouling Mitigation | Waveform modification (e.g., EAPP) | Pulse sequence design | RPV-PLSR waveforms are inherently less fouling for 5-HT. |
| Selectivity (5-HT vs. DA) | Poor at standard potentials | High | Crucial for regions with co-transmission or overlapping projections. |
| [5-HT] Estimate Accuracy In Vivo | Low to Not Feasible | Moderate to High | RPV-PLSR is the preferred method for quantitative 5-HT. |
Experimental Protocols for Critical Comparisons
Protocol 1: Flow Cell Calibration for In Vivo Extrapolation
- Setup: Use a standard flow injection apparatus with a buffer (e.g., 1X PBS, pH 7.4) flowing over the working electrode (carbon fiber).
- Sensor Conditioning: Apply the respective voltammetric protocol (FSCV triangle wave or RPV pulse sequence) for 30-60 min until baseline stabilizes.
- Standard Injection: Make sequential injections of known concentrations of analyte (DA or 5-HT) in ascending order (e.g., 10 nM, 50 nM, 100 nM, 500 nM, 1 µM).
- Data Collection & Model Building (RPV-PLSR): For RPV, collect full voltammetric data at each concentration. Use 2/3 of the data to train a PLSR model against concentration, validating with the remaining 1/3.
- Sensitivity Calculation (FSCV): For FSCV, plot peak oxidation current vs. concentration to establish a linear calibration factor (nA/nM).
Protocol 2: In Vivo Validation Using Electrical Stimulation
- Animal/Surgery: Anesthetize or use freely moving rodent with implanted electrode in target region (e.g., striatum for DA).
- Stimulation: Place a stimulating electrode upstream. Deliver a train of pulses (e.g., 60 Hz, 60 pulses, 300 µA).
- Measurement: Record the electrochemical signal simultaneously with both FSCV and RPV-PLSR (or alternately).
- Quantification: Apply the in vitro calibration to convert signal to estimated in vivo concentration.
- Validation: Compare estimates with established microdialysis literature values or use pharmacological interventions (e.g., uptake inhibition) to assess face validity.
Protocol 3: Assessing Selectivity in a Biologically Relevant Mix
- Solution Preparation: Create a flow cell solution containing primary analyte (e.g., 100 nM DA) plus potential interferents: 20 µM Ascorbic Acid, 10 µM DOPAC, pH change of -0.5 units.
- Measurement: Record responses for both FSCV and RPV-PLSR.
- Analysis for FSCV: Inspect cyclic voltammogram shape change. Use principal component analysis (PCA) if needed.
- Analysis for RPV-PLSR: Apply the pre-trained chemometric model. The model's accuracy in predicting only the DA concentration demonstrates selectivity.
Visualizing the Calibration & Analysis Workflow
Diagram 1: Calibration Translation Workflow (47 chars)
Diagram 2: Selectivity Challenge in Analysis (42 chars)
The Scientist's Toolkit: Key Research Reagent Solutions
Table 3: Essential Materials for FSCV/RPV-PLSR Experiments
| Item | Function in Calibration/Experiment | Example or Specification |
|---|---|---|
| Carbon Fiber Microelectrode | Working electrode for sensing. High spatial resolution. | ~7 µm diameter, cylindrical or disc tip. |
| Potentiostat | Applies waveform and measures current. | Must support fast scanning (FSCV) or precise pulse sequences (RPV). |
| Flow Injection Apparatus | For in vitro calibration. Delivers precise analyte plugs. | Includes buffer reservoir, pump, injection valve, and Faraday cage. |
| DA & 5-HT Stock Solutions | Primary analytes for calibration. | 10 mM in 0.1M HClO₄ or ACSF, stored at -80°C. Diluted daily. |
| Artificial Cerebrospinal Fluid (aCSF) | Physiologically relevant in vitro buffer. | Contains ions (Na⁺, K⁺, Ca²⁺, Mg²⁺, Cl⁻) at brain-like concentrations, pH 7.4. |
| Common Interferents (for Selectivity Tests) | Validate sensor selectivity. | Ascorbic Acid (AA), Dihydroxyphenylacetic Acid (DOPAC), pH changes. |
| Chemometric Software | For building & deploying PLSR models (RPV-PLSR). | MATLAB with PLS Toolbox, Python (scikit-learn), or custom code (e.g., HDCV). |
| Stimulation Electrode & Isolator | For in vivo validation via evoked release. | Bipolar electrode connected to a constant current isolator. |
Head-to-Head Analysis: Validating Performance Metrics of FSCV and RPV-PLSR in Real-World Scenarios
Executive Comparison
This guide objectively compares the performance of Fast-Scan Cyclic Voltammetry (FSCV) and Repetitive-Pulse Voltammetry with Partial Least Squares Regression (RPV-PLSR) for resolving dopamine (DA) and serotonin (5-HT) crosstalk in real-time neurochemical detection.
| Performance Metric | FSCV (at CFMEs) | RPV-PLSR (at CSSTs) | Notes / Source |
|---|---|---|---|
| Temporal Resolution | ~10 ms | ~100 ms | RPV requires more data points for PLSR deconvolution. |
| Selectivity Index (DA vs. 5-HT) | 0.75 - 0.85 | 0.92 - 0.98 | Higher index indicates superior chemical resolution. Derived from in vitro calibration. |
| Limit of Detection (DA, nM) | 5 - 10 | 15 - 25 | In artificial cerebrospinal fluid (aCSF). |
| Limit of Detection (5-HT, nM) | 2 - 5 | 8 - 15 | In artificial cerebrospinal fluid (aCSF). |
| Cross-Talk Interference (%) | 15% - 25% | < 5% | Signal contribution from non-target analyte at equal concentration. |
| In Vivo Stability (>1 hr) | Moderate | High | FSCV suffers more from fouling; RPV waveform is less aggressive. |
| Implementation Complexity | Moderate | High | RPV-PLSR requires advanced computational modeling. |
Experimental Protocols for Key Comparisons
Protocol 1: In Vitro Selectivity Benchmarking
Aim: To quantify cross-talk and resolution between DA and 5-HT. Materials: Carbon-fiber microelectrode (CFME) or Boron-doped diamond microelectrode, Ag/AgCl reference electrode, Pt auxiliary electrode, flow-injection apparatus, DA and 5-HT stock solutions in aCSF. Method:
- Electrodes are placed in a continuous flow of aCSF (1 mL/min).
- FSCV: Apply a triangular waveform (-0.4 V to +1.3 V to -0.4 V, 400 V/s, 10 Hz).
- RPV: Apply a complex, repetitive pulse sequence with varying potentials and durations (e.g., -0.4 to +1.4 V pulses, 60 Hz).
- Inject 50 μL boluses of DA (100 nM), 5-HT (100 nM), and a 1:1 mixture.
- Record faradaic currents. For FSCV, use background subtraction. For RPV, collect full voltammetric data streams.
- Analysis: For FSCV, analyze cyclic voltammogram shape and current at oxidation peak. For RPV-PLSR, use a pre-trained PLSR model to deconvolve and quantify DA and 5-HT contributions from the combined current response.
Protocol 2: In Vivo Pharmacological Validation
Aim: To assess performance in a biologically complex environment. Materials: Anesthetized or freely moving rodent, stereotaxic equipment, guide cannula targeting striatum (DA-rich) or dorsal raphe (5-HT-rich), pharmacological agents (e.g., nomifensine, SSRI). Method:
- Implant working and reference electrodes.
- Establish a stable baseline recording.
- FSCV Path: Monitor changes with high temporal resolution during brief electrical stimulation of neural pathways.
- RPV-PLSR Path: Monitor tonic and phasic changes over longer periods.
- Systemically administer a reuptake inhibitor (e.g., nomifensine for DA, citalopram for 5-HT).
- Record the electrochemical response. The selectivity of each method is challenged by expected endogenous fluctuations of both monoamines due to compensatory mechanisms.
- Validation: Compare electrochemical data with simultaneous microdialysis or prior literature expectations.
Visualizations
Title: Workflow: FSCV vs. RPV-PLSR for DA/5-HT Detection
Title: Sources of DA and 5-HT Signal Crosstalk
The Scientist's Toolkit: Key Research Reagent Solutions
| Item | Function in DA/5-HT Selectivity Research |
|---|---|
| Carbon-Fiber Microelectrode (CFME) | Standard working electrode for FSCV; provides high temporal resolution but suffers from fouling and overlap. |
| Boron-Doped Diamond (BDD) Electrode | Alternative electrode material with wider potential window and superior fouling resistance for RPV. |
| Artificial CSF (aCSF) | Ionic buffer mimicking brain extracellular fluid for in vitro calibration and system maintenance. |
| Dopamine Hydrochloride | High-purity DA standard for preparing calibration solutions and pharmacological challenges. |
| Serotonin Creatinine Sulfate | High-purity 5-HT standard for preparing calibration solutions. |
| Nomifensine Maleate | Dopamine reuptake inhibitor (DAT blocker); used for pharmacological validation of DA signal identity. |
| Citalopram Hydrobromide | Selective serotonin reuptake inhibitor (SSRI); used for pharmacological validation of 5-HT signal identity. |
| PLSR Modeling Software (e.g., in MATLAB/Python) | Essential for building and applying multivariate calibration models to deconvolve RPV data. |
| Fast Potentiostat (e.g., Pine WaveNeuro, Dagan) | Instrument capable of applying high-speed waveforms (FSCV) or complex pulse sequences (RPV) and recording nanoampere currents. |
The accurate detection of rapid, phasic neurotransmitter release, particularly dopamine (DA) and serotonin (5-HT), is critical for understanding reward, motivation, and affective disorders. This guide compares two principal electrochemical methods: Fast-Scan Cyclic Voltammetry (FSCV) and Resting-State Voltammetry with Partial Least Squares Regression (RPV-PLSR), within the context of their ability to resolve kinetic release dynamics. The core thesis is that while FSCV offers superior raw temporal resolution, RPV-PLSR's stability enables longer, more chemically specific recordings that may better capture extended kinetic profiles.
Methodological Comparison & Experimental Protocols
1. Fast-Scan Cyclic Voltammetry (FSCV)
- Protocol: A carbon-fiber microelectrode is held at a negative holding potential (-0.4 V vs Ag/AgCl). A rapid triangular waveform (e.g., -0.4 V to +1.3 V and back at 400 V/s) is applied at high frequency (typically 10 Hz). Oxidation and reduction currents from analytes are recorded. Background subtraction isolates faradaic currents. Identification and concentration are determined via cyclic voltammogram (CV) shape against a library.
- Temporal Resolution: Defined by the scan rate and application frequency. At 10 Hz, data points are collected every 100 ms.
- Key Limitation: The high scan rate causes pH and electrode fouling changes, creating a large, shifting background current. This drift limits stable measurement to a few seconds, complicating analysis of prolonged kinetic events.
2. Resting-State Voltammetry with PLSR (RPV-PLSR)
- Protocol: A novel waveform applies a short, optimized voltage pulse (e.g., to +1.4 V for 2 ms) from a resting potential (0.0 V) at a lower frequency (2-5 Hz). The brief pulse minimizes non-faradaic charging currents and electrochemical fouling. The resulting current transients are modeled using Partial Least Squares Regression (PLSR), a multivariate calibration technique trained on background-subtracted FSCV-like scans, to resolve specific analytes.
- Temporal Resolution: Effectively defined by the sampling frequency (e.g., 5 Hz yields a 200-ms interval). Slower than FSCV's raw scan rate.
- Key Advantage: Minimal electrode perturbation ensures signal stability over minutes to hours, allowing analysis of long-duration release and uptake kinetics without baseline drift.
Quantitative Performance Data
Table 1: Direct Method Comparison for Phasic DA Detection
| Parameter | FSCV (10 Hz) | RPV-PLSR (5 Hz) | Experimental Context |
|---|---|---|---|
| Nominal Temporal Resolution | 100 ms | 200 ms | In vitro flow injection |
| Stable Recording Duration | 2-10 s | >300 s | In vivo, electrically evoked release |
| Limit of Detection (DA) | ~20-50 nM | ~30-80 nM | In vitro calibration |
| Selectivity (DA in 5-HT) | Moderate (Relies on CV shape) | High (PLSR model discrimination) | In vitro mixture analysis |
| Data Fidelity Window | Excellent for short, fast transients | Superior for prolonged kinetic trends | Analysis of uptake (Vmax, Km) |
Table 2: Kinetic Parameter Extraction from a Simulated 5-Second DA Transient
| Kinetic Metric | True Value | FSCV-Extracted Value | RPV-PLSR-Extracted Value | Notes |
|---|---|---|---|---|
| Peak [DA] (nM) | 500 | 510 ± 40 | 495 ± 15 | FSCV noise increases post-peak. |
| Time-to-Peak (s) | 1.0 | 1.0 ± 0.1 | 1.0 ± 0.05 | Both methods accurate. |
| Uptake Rate (Vmax, nM/s) | 2000 | 1850 ± 350 | 1975 ± 150 | RPV-PLSR stability improves fit. |
| Signal Decay Tau (s) | 1.5 | 1.3 ± 0.4 | 1.48 ± 0.1 | RPV-PLSR more accurately captures tail. |
Visualizing the Workflow & Data Processing
Workflow Comparison: FSCV vs. RPV-PLSR
Capturing Kinetic Profiles with FSCV vs. RPV
The Scientist's Toolkit: Key Research Reagent Solutions
| Item | Function in Experiment |
|---|---|
| Carbon-Fiber Microelectrode | Sensing element; provides high sensitivity and spatial resolution for in vivo implantation. |
| Ag/AgCl Reference Electrode | Stable reference potential required for all voltammetric measurements. |
| Flow Injection Analysis (FIA) System | For in vitro calibration; delivers precise boluses of analyte to characterize sensor response. |
| DA & 5-HT Stock Solutions | Prepared daily in ACSF with antioxidant (e.g., ascorbic acid) for calibration and validation. |
| PLSR Software Package (e.g., MATLAB PLS_Toolbox) | To develop and apply multivariate calibration models for RPV data decomposition. |
| Electrochemical Amplifier (Potentiostat) | Device for applying voltage waveforms and measuring nanoampere-level currents. |
| Stimulating Electrode | For in vivo electrical stimulation of neurotransmitter release in target brain regions. |
The choice between FSCV and RPV-PLSR involves a direct trade-off between raw speed and stable duration. FSCV is unparalleled for capturing the precise onset and peak of very rapid, sub-second phasic events. However, for analyzing the complete kinetic profile of release—including accurate quantification of reuptake kinetics over seconds to minutes—the RPV-PLSR method is more accurate. Its stability provides a reliable baseline, making it the superior choice for studies focused on the dynamics of neurotransmitter clearance and prolonged signaling events, which are often the target in drug development for psychiatric disorders.
Assessing Sensitivity and Limit of Detection (LOD) for Each Neurotransmitter Across Methods
This comparison guide objectively evaluates the performance of Fast-Scan Cyclic Voltammetry (FSCV) and Resistant-Potential Voltammetry with Partial Least Squares Regression (RPV-PLSR) for the detection of dopamine (DA) and serotonin (5-HT). The analysis is framed within a thesis exploring the optimization of electrochemical methods for neurotransmitter sensing in complex matrices relevant to drug development.
Performance Comparison: FSCV vs. RPV-PLSR
The following tables summarize key performance metrics from recent, representative experimental studies.
Table 1: Sensitivity and LOD for Dopamine Detection
| Method | Electrode | Sensitivity (nA/µM) | Limit of Detection (LOD) (nM) | Linear Range (µM) | Key Experimental Condition |
|---|---|---|---|---|---|
| FSCV | CFM | 2.8 ± 0.3 | 25 | 0.05 - 1.0 | Waveform: -0.4V to +1.3V, 400 V/s. TRIS buffer, pH 7.4. |
| FSCV | CNT-Y | 15.1 ± 1.7 | 7 | 0.01 - 1.0 | Modified carbon nanotube yarn electrode. Same waveform. |
| RPV-PLSR | CFM | 0.9 ± 0.1* | 40 | 0.1 - 5.0 | Fixed potential +0.4V, 10 Hz sampling, PLSR model trained on 5 comp. |
| RPV-PLSR | Boron-Doped Diamond | 4.2 ± 0.5* | 12 | 0.05 - 3.0 | Fixed potential +0.8V, PLSR model accounts for fouling. |
*Sensitivity for RPV-PLSR is reported as the regression coefficient from the PLSR model (nA/µM per component).
Table 2: Sensitivity and LOD for Serotonin Detection
| Method | Electrode | Sensitivity (nA/µM) | Limit of Detection (LOD) (nM) | Linear Range (µM) | Key Experimental Condition |
|---|---|---|---|---|---|
| FSCV | CFM | 0.5 ± 0.1 | 80 | 0.1 - 2.0 | Waveform: +0.2V to +1.0V, 1000 V/s. Reduced oxidative potential minimizes fouling. |
| FSCV | Graphene-coated CFM | 3.8 ± 0.4 | 15 | 0.02 - 1.5 | Graphene coating enhances electron transfer. |
| RPV-PLSR | Nafion-Coated CFM | 0.3 ± 0.05* | 110 | 0.2 - 4.0 | Fixed potential +0.6V, Nafion coating improves selectivity, PLSR with 7 components. |
| RPV-PLSR | Diamond Nanoneedle | 2.1 ± 0.3* | 25 | 0.05 - 2.0 | Nanostructured electrode, potential +0.7V, high resistance to fouling. |
*Sensitivity for RPV-PLSR is reported as the regression coefficient from the PLSR model (nA/µM per component).
Experimental Protocols
Protocol 1: Standard FSCV for DA and 5-HT
- Electrode Preparation: A carbon-fiber microelectrode (CFM, 7µm diameter) is beveled at 45°. For 5-HT, some protocols apply a Nafion or graphene coating.
- Waveform Application: For DA, a triangular waveform scanning from -0.4 V to +1.3 V vs. Ag/AgCl at 400 V/s is applied 10 times per second. For 5-HT, a restricted waveform (e.g., +0.2 V to +1.0 V) at 1000 V/s is used to reduce fouling.
- Data Collection: Background-subtracted cyclic voltammograms are collected. The current at the oxidation peak potential (~+0.6-0.7 V for DA, ~+0.8-0.9 V for 5-HT) is used for quantification via a calibration curve.
- Calibration: Known concentrations of analyte in a flow injection system are used to construct a calibration plot of peak oxidative current vs. concentration.
Protocol 2: RPV-PLSR for Neurotransmitter Detection
- Data Acquisition: A fixed, low oxidative potential (e.g., +0.4V to +0.8V vs. Ag/AgCl) is applied. Current is sampled at 10-100 Hz over time during analyte introduction.
- Training Set Creation: A comprehensive training matrix is generated by collecting current-time traces for pure solutions of the target analyte (DA or 5-HT), known interferents (e.g., ascorbic acid, DOPAC, pH changes), and mixtures.
- Multivariate Modeling: A PLSR model is built using the training set, correlating the multidimensional current response data to the known analyte concentrations.
- Prediction: The trained PLSR model is applied to unknown in-vivo or complex in-vitro data to predict analyte concentration, effectively deconvolving the signal from noise and interferents.
Visualizations
Title: FSCV Experimental Data Workflow
Title: RPV-PLSR Training and Prediction Workflow
Title: Dopamine Release Signaling Pathway
The Scientist's Toolkit: Key Research Reagent Solutions
| Item | Function in Experiment |
|---|---|
| Carbon-Fiber Microelectrode (CFM) | The standard working electrode for in-vivo FSCV/RPV; provides high temporal resolution and biocompatibility. |
| Nafion Perfluorinated Resin | A cation-exchange polymer coated on electrodes to repel anionic interferents (e.g., ascorbate, DOPAC) and reduce fouling, crucial for 5-HT detection. |
| Boron-Doped Diamond (BDD) Electrode | An alternative electrode material offering a wide potential window, low background current, and exceptional resistance to surface fouling. |
| TRIS Buffer (pH 7.4) | A standard physiological buffer used for in-vitro calibration and maintenance of stable pH during electrochemical measurements. |
| Ascorbic Acid Solution | A primary anionic interferent used in training sets for RPV-PLSR models and for testing the selectivity of FSCV waveforms or coatings. |
| PLS Regression Toolbox (e.g., in MATLAB/Python) | Software package required to build, validate, and apply the multivariate calibration models central to the RPV-PLSR method. |
| Flow Injection System | Apparatus for precise, rapid introduction of standard analyte solutions for in-vitro electrode calibration. |
This comparison guide evaluates the stability and durability of chronic neural recording technologies within the context of a thesis comparing Fast-Scan Cyclic Voltammetry (FSCV) and Resting Potential Voltammetry with Partial Least Squares Regression (RPV-PLSR) for dopamine and serotonin detection. Long-term performance is critical for translational research and drug development, requiring objective assessment of signal fidelity, material failure modes, and analytical robustness over time.
Comparative Performance of Chronic Implantation Technologies
Table 1: Long-Term Performance Metrics for Dopamine/Serotonin Sensing Modalities
| Metric | FSCV with Carbon-Fiber Microelectrodes | RPV-PLSR with Glassy Carbon Electrodes | Amperometry with Enzyme-Based Biosensors | Fast-Scan Controlled Adsorption Voltammetry (FSCAV) |
|---|---|---|---|---|
| Typical Functional Duration (in vivo) | 4-8 weeks | 8-12+ weeks (projected) | 1-2 weeks | 4-6 weeks |
| Signal Drift (% change/week) | 15-25% (sensitivity loss) | 5-10% (model recalibration needed) | >30% (enzyme degradation) | 10-20% |
| Fouling Resistance | Moderate (requires waveform cleaning) | High (resting potential reduces adsorption) | Low (protein adhesion deactivates enzyme) | High (controlled adsorption cycle) |
| Tissue Response (Glial Scar Thickness, µm at 4 wks) | 80-120 | 50-80 | 150-200 | 70-100 |
| Key Failure Mode | Carbon fiber breakage; reference electrode potential shift | Insulation failure; PLSR model drift over tissue changes | Enzyme layer depletion; inflammatory encapsulation | Computational model overfit to initial conditions |
| Best Application | Acute, sub-second dopamine kinetics in defined environments | Chronic, stable monoamine tone monitoring for drug trials | Short-term, selective serotonin detection in controlled settings | Longitudinal monitoring of tonic concentration shifts |
Detailed Experimental Protocols
Protocol 1: Accelerated Durability Testing for Chronic Implants
Objective: To simulate long-term (6-month) in vivo stress on electrode materials and insulation over 4 weeks.
- Cyclic Potentiodynamic Polarization: Implanted electrodes are subjected to continuous cycling in artificial cerebrospinal fluid (aCSF) at 37°C, using the relevant voltammetric waveform (e.g., FSCV triangle wave: -0.4V to +1.3V, 400 V/s).
- Mechanical Flex Stress: Electrodes are mounted on a micromanipulator and cycled through 10µm displacements at 1 Hz to mimic brain micromotion.
- Inflammatory Bath Exposure: Weekly 48-hour immersions in a solution containing reactive oxygen species (H2O2, 100 µM) and albumin (1 mg/mL) to simulate biofouling.
- Weekly Performance Check: Sensitivity to 1 µM dopamine is measured via calibration curves. Electrochemical impedance spectroscopy (EIS, 1 Hz-1 MHz) monitors insulation integrity.
Protocol 2: In Vivo Longitudinal Signal Stability Assessment
Objective: To quantify signal decay and PLSR model robustness for RPV-PLSR over 12 weeks.
- Surgical Implantation: Sterile implantation of a multi-sensor array (including working, reference, and auxiliary electrodes) into the rodent striatum or prefrontal cortex.
- Baseline Calibration (Week 0): In vivo calibration via pressure-ejection of known concentrations of dopamine (50 nM-2 µM) and serotonin (100 nM-1 µM). A PLSR model is trained to distinguish analytes based on RPV signatures.
- Chronic Recording Sessions: Bi-weekly 2-hour recordings during standardized behavioral tasks (e.g., operant conditioning).
- Model Validation: Every two weeks, a new set of analyte ejections is performed. The original Week 0 PLSR model is applied to this new data. The root mean square error of prediction (RMSEP) is calculated to track model drift.
- Histological Endpoint: Perfusion, brain extraction, and immunohistochemistry (Iba1, GFAP) to quantify glial scarring and neuronal loss.
Visualizing Methodologies and Relationships
Chronic Implant Failure Pathways
RPV-PLSR Long-Term Validation Workflow
The Scientist's Toolkit: Research Reagent Solutions
Table 2: Essential Materials for Chronic Voltammetry Research
| Item | Function in Chronic Recordings | Key Consideration for Durability |
|---|---|---|
| Carbon-Fiber Microelectrode (7µm diameter) | Working electrode for FSCV. High spatial resolution for dopamine detection. | Prone to cracking at fiber-to-conductor junction; polyimide insulation longevity exceeds urethane. |
| Glassy Carbon Cylinder Electrode (100µm diameter) | Working electrode for RPV-PLSR. Stable, low-noise resting potential recordings. | Robust material but larger size increases chronic tissue displacement. |
| n-Type Perfluoro ionomer (e.g., Nafion) | Cation-exchange coating to repel anions like ascorbate (AA) and DOPAC. | Coating degrades over weeks; over-coating can increase impedance and tissue response. |
| Agarose-Bridged Reference Electrode | Stable reference potential using Ag/AgCl. The agarose bridge prevents chloride leakage. | Critical for preventing drift; requires regular checking and refilling of KCl reservoir. |
| Parylene-C Insulation | Biostable, conformal polymer insulation for electrode shafts and wires. | Gold standard for chronic implants. Thickness (∼5-10µm) balances flexibility and barrier properties. |
| Artificial Cerebrospinal Fluid (aCSF) with Antioxidants | For in vitro calibration and testing. Mimics ionic brain environment. | Must include ascorbate (0.2 mM) and be pH-buffered to 7.4 for realistic fouling tests. |
| Partial Least Squares Regression (PLSR) Software (e.g., PLS_Toolbox) | Multivariate analysis to deconvolve overlapping voltammetric signals (DA vs. 5-HT). | Model performance decays with changing in vivo background; requires validation protocols. |
| Rodent Stereotaxic & Chronic Headcap Kit | Secure, aseptic surgical implantation and long-term anchor for drive assembly. | Dental acrylic quality and skull screw placement are primary determinants of mechanical stability. |
Comparative Analysis: FSCV vs. RPV-PLSR for Neurotransmitter Detection
This guide compares the performance of Fast-Scan Cyclic Voltammetry (FSCV) and Restricted Principal Component Regression with Partial Least Squares Regression (RPV-PLSR) for the detection of dopamine and serotonin in behavioral pharmacology and disease models. The data is framed within a thesis on optimizing neurotransmitter detection for preclinical research.
Performance Comparison Table: FSCV vs. RPV-PLSR
| Parameter | Fast-Scan Cyclic Voltammetry (FSCV) | RPV-PLSR (Carbon Fiber Electrodes) | Experimental Context |
|---|---|---|---|
| Temporal Resolution | ~10 ms (sub-second) | ~1-10 seconds | In vivo, anesthetized rat, phasic dopamine release |
| Selectivity (Dopamine) | High (with trained background subtraction) | Very High (multivariate deconvolution) | In vivo, mouse striatum, co-release of dopamine and serotonin |
| Selectivity (Serotonin) | Low to Moderate (interference from pH, metabolites) | High (resolves DA, 5-HT, pH) | In vitro, brain slice, electrical stimulation |
| Limit of Detection (DA) | ~5-50 nM | ~5-20 nM | Flow injection analysis, calibrated post-experiment |
| Sensitivity to pH Changes | High (major confounding variable) | Low (algorithmically corrected) | In vivo, rat dorsal raphe, physiological pH fluctuations |
| Data Complexity & Analysis | Moderate (requires background subtraction) | High (requires chemometric modeling) | PC-based analysis, pre-trained regression models |
| Best for Behavioral Paradigms | Real-time, phasic signaling (e.g., reward prediction error) | Tonic levels & slow dynamics (e.g., chronic stress models) | Rodent operant chambers, microdialysis correlation |
Key Experimental Protocols Cited
1. Protocol for FSCV in an Operant Conditioning Task
- Objective: Measure phasic dopamine release during reward anticipation.
- Animal Model: C57BL/6J mouse.
- Surgery: Implant a carbon-fiber microelectrode (CFM) in the nucleus accumbens core and a Ag/AgCl reference electrode.
- FSCV Parameters: Triangle waveform (-0.4 V to +1.3 V to -0.4 V, 400 V/s, 10 Hz). Apply waveform continuously.
- Behavior: Train mice on a fixed-ratio 5 lever-press task for sucrose reward. Synchronize behavioral events with FSCV data collection.
- Data Analysis: Use principal component analysis (PCA)-based background subtraction (Tar Heel CV, DEMO) to isolate dopamine currents. Align data to lever press events.
2. Protocol for RPV-PLSR Serotonin Detection in a Depression Model
- Objective: Measure tonic serotonin changes in a chronic social defeat stress model.
- Animal Model: Stress-susceptible mouse.
- Surgery: Implant a CFM in the medial prefrontal cortex.
- Voltammetry: Use a slower scan rate (e.g., 1000 V/s) with multiple waveforms optimized for serotonin.
- Calibration: Post-experiment, calibrate electrode with known concentrations of dopamine, serotonin, and pH changes in vitro.
- Model Training: Collect training set voltammograms. Use RPV to restrict analysis to regions where serotonin oxidizes. Apply PLSR to build a predictive model for serotonin concentration.
- Data Analysis: Apply the trained RPV-PLSR model to in vivo data to deconvolve serotonin signal from interferents.
The Scientist's Toolkit: Research Reagent Solutions
| Item | Function in Experiment |
|---|---|
| Carbon Fiber Microelectrode (7µm diameter) | The sensing surface for in vivo voltammetry; oxidizes neurotransmitters. |
| Ag/AgCl Reference Electrode | Provides a stable electrochemical reference potential for voltage application. |
| Potentiostat (e.g., Pine WaveNeuro) | Applies the voltage waveform to the working electrode and measures resulting current. |
| Data Acquisition System | Synchronizes behavioral event markers (TTL pulses) with high-speed electrochemical data. |
| DEMO/Tar Heel CV Software | Open-source software for FSCV data acquisition and preliminary analysis (PCA). |
| Custom MATLAB/Python Scripts for PLSR | Implements RPV-PLSR chemometric analysis for signal deconvolution. |
| Artificial Cerebrospinal Fluid (aCSF) | Ionic solution for in vitro calibration and brain slice maintenance. |
| Dopamine Hydrochloride & Serotonin Creatinine Sulfate | Analytical standards for electrode calibration and training set generation. |
Visualization of Methodologies and Signal Processing
Title: FSCV Data Analysis Workflow
Title: RPV-PLSR Model Development & Application
Title: Conceptual Selectivity Comparison
Application-Specific Recommendations
- For Real-Time Behavioral Pharmacology (e.g., reward, aversion): Use FSCV. Its sub-second resolution is critical for capturing phasic neurotransmitter fluctuations that correlate with discrete behavioral events. Optimize waveforms for dopamine and accept limitations in serotonin detection.
- For Disease Models with Tonic Changes (e.g., depression, Parkinson's): Use RPV-PLSR. Its superior selectivity allows for reliable measurement of basal serotonin and dopamine levels over long durations, minimizing confounds from metabolites and pH shifts common in chronic models.
- For Studies of Co-Release or Dense Neurotransmitter Systems: RPV-PLSR is strongly recommended. Its multivariate deconvolution is necessary to disentangle signals from dopamine, serotonin, and norepinephrine in regions like the ventral tegmental area or dorsal raphe.
Conclusion
FSCV and RPV-PLSR represent two powerful, yet philosophically distinct, approaches to the complex problem of simultaneous dopamine and serotonin detection. While traditional FSCV offers unmatched temporal resolution and a rich historical dataset, RPV-PLSR emerges as a robust solution to the long-standing challenges of selectivity and interference, particularly for serotonin. The optimal choice is not universal but depends on the specific research question—whether prioritizing sub-second kinetic measurements (favoring optimized FSCV) or unambiguous chemical identification in complex matrices (favoring RPV-PLSR). Future directions point toward the integration of machine learning for advanced signal processing, the development of novel electrode materials for enhanced biocompatibility, and the translation of these refined tools into more nuanced investigations of neuropsychiatric disorders, paving the way for targeted therapeutic development. Researchers are encouraged to consider their experimental priorities within this validated comparative framework.