Decoding Brain Activity: Comparing MRS Glutamate and fMRI BOLD Response Functions for Research & Drug Development
This article provides a comprehensive comparison of two fundamental neuroimaging modalities for assessing brain function: Magnetic Resonance Spectroscopy (MRS) measures of glutamate and functional Magnetic Resonance Imaging (fMRI) Blood Oxygen...
Decoding Brain Activity: Comparing MRS Glutamate and fMRI BOLD Response Functions for Research & Drug Development
Abstract
This article provides a comprehensive comparison of two fundamental neuroimaging modalities for assessing brain function: Magnetic Resonance Spectroscopy (MRS) measures of glutamate and functional Magnetic Resonance Imaging (fMRI) Blood Oxygen Level Dependent (BOLD) contrast. Targeted at researchers and drug development professionals, we explore the foundational neurophysiological principles linking glutamate dynamics to hemodynamics. We detail methodological approaches for acquiring and analyzing response functions, address common challenges in experimental design and data interpretation, and critically validate the complementary nature of these techniques. The synthesis offers a roadmap for integrating multimodal data to enhance the mechanistic understanding of brain function in health, disease, and therapeutic intervention.
The Neurophysiological Bridge: Linking Glutamate Dynamics to the BOLD Signal
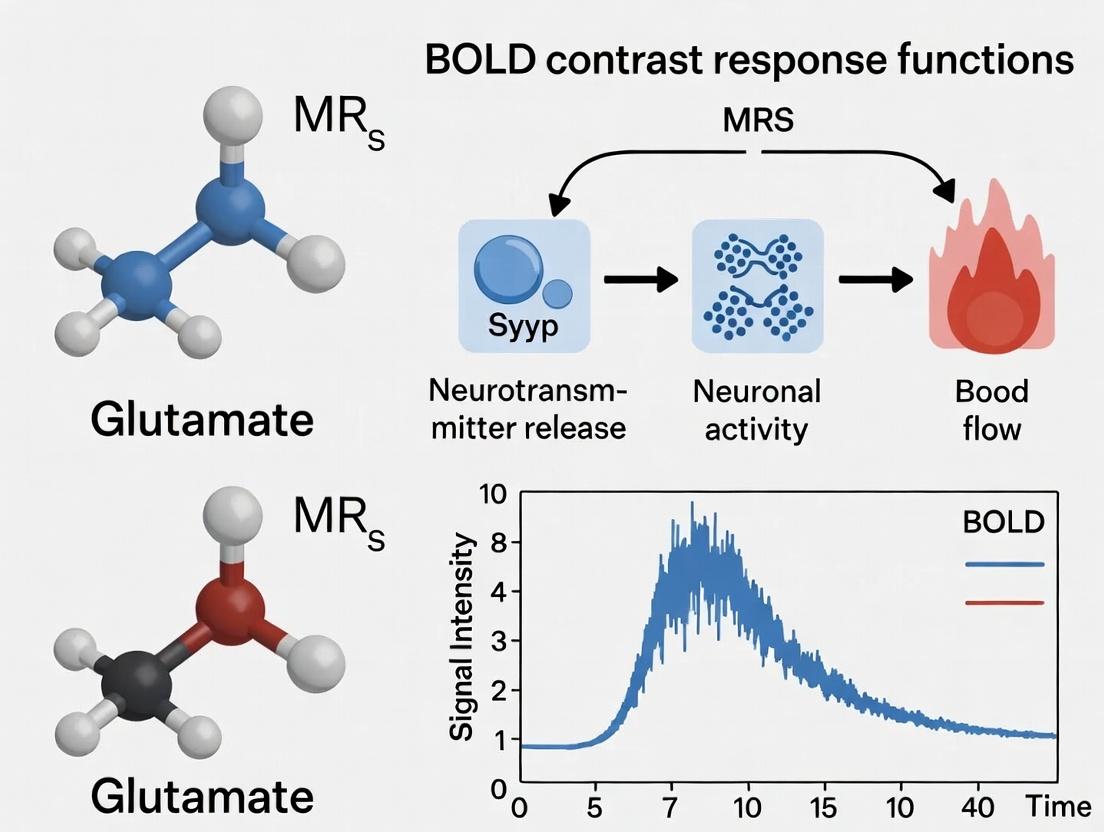
Within the field of functional neuroimaging, two critical, non-invasive techniques provide complementary windows into brain activity: Magnetic Resonance Spectroscopy (MRS) for measuring glutamate and functional Magnetic Resonance Imaging (fMRI) for detecting the Blood Oxygenation Level Dependent (BOLD) response. Understanding their distinct "response functions"—the temporal dynamics and physiological underpinnings of their signals—is fundamental for interpreting neuroimaging data. This guide compares these signal modalities, focusing on their physiological origins, temporal characteristics, and experimental applications within neuroscience and drug development research.
Physiological Origins & Signal Pathways
MRS Glutamate measures the concentration of the primary excitatory neurotransmitter in the brain’s voxel of interest. Its signal reflects metabolic pool glutamate, which is tightly coupled to neuronal synaptic activity and the glutamate-glutamine cycle between neurons and astrocytes.
fMRI BOLD measures a hemodynamic response, an indirect correlate of neural activity. It detects changes in deoxyhemoglobin concentration resulting from localized changes in cerebral blood flow, volume, and oxygen consumption following neuronal activation.
Diagram 1: Origin Pathways of MRS Glutamate and fMRI BOLD Signals
Comparative Signal Properties Table
| Property | MRS Glutamate | fMRI BOLD |
|---|---|---|
| Primary Physiological Source | Concentration of metabolic glutamate in tissue voxel. | Deoxyhemoglobin concentration in venous blood. |
| Relationship to Neural Activity | Direct, though complex; reflects glutamatergic neurotransmission and cycling. | Indirect; coupled via neurovascular coupling (NVC). |
| Temporal Resolution | Low (minutes), due to low signal-to-noise ratio (SNR). | Moderate (seconds), limited by hemodynamic lag. |
| Spatial Resolution | Low (~cm³ voxels), limited by SNR. | High (~mm³ voxels). |
| Quantitative Output | Absolute or relative concentration (in mmol/kg or Institutional Units). | Relative percent signal change (ΔS/S) or statistical parameter maps. |
| Key Temporal Parameter | Glutamate time-course; slow dynamics (minutes to hours). | Hemodynamic Response Function (HRF); peak ~5-6s post-stimulus. |
| Primary Research Application | Studying metabolic dysregulation, neurotransmitter pools, chronic drug effects. | Mapping rapid neural activation patterns, functional connectivity. |
Experimental Protocols for Comparative Studies
Protocol 1: Simultaneous MRS/fMRI Acquisition for Task-Evoked Response This protocol aims to capture concurrent glutamate and BOLD responses to a controlled stimulus.
- Subject Preparation & Scanning: Position subject in 3T+ MRI scanner with dual-tuned head coil or setup enabling sequential acquisition.
- Stimulus Paradigm: Use a block-design (e.g., 30s visual stimulation, 30s rest, 10 repeats). Ensure task is potent for glutamatergic activation (e.g., cognitive task).
- fMRI Acquisition: Acquire T2*-weighted EPI BOLD images (TR=2s, TE=30ms, voxel=3x3x3mm) continuously throughout paradigm.
- MRS Acquisition: Use a single-voxel PRESS or SPECIAL sequence (TE~30ms for glutamate editing) placed in relevant region (e.g., visual cortex). Acquire spectra in interleaved "rest" and "active" blocks, each requiring ~2-5 minutes of averaging.
- Analysis: For fMRI, model BOLD HRF using GLM. For MRS, quantify glutamate peaks via LCModel, comparing averaged "active" vs. "rest" spectra.
Protocol 2: Pharmacological Challenge Study This protocol probes the systems' sensitivity to pharmacological manipulation of glutamate.
- Design: Double-blind, placebo-controlled crossover.
- Intervention: Administer an NMDA antagonist (e.g., ketamine) or glutamate modulator.
- Scanning: Acquire baseline MRS (pre-dose) in target region (e.g., anterior cingulate cortex). Follow with continuous resting-state fMRI and repeated MRS at fixed post-dose intervals (e.g., +30, +60, +90 min).
- Analysis: Correlate time-course changes in glutamate concentration (MRS) with alterations in BOLD amplitude or functional connectivity (fMRI).
Key Contrast Response Function Data
Table 2: Representative Temporal and Sensitivity Characteristics
| Characteristic | MRS Glutamate | fMRI BOLD | Supporting Evidence / Notes |
|---|---|---|---|
| Response Latency | Slow (minutes to tens of minutes). | Delayed (~2s onset, 5-6s peak). | MRS latency reflects metabolic turnover; BOLD lag is vascular. |
| Response Duration | Can be prolonged (minutes to hours post-stimulus). | Transient (~20-30s for brief stimulus). | MRS signals may index sustained metabolic shifts. |
| Sensitivity to Acute Neural Activation | Low; requires prolonged or strong stimulation for detectable change. | High; robust to brief, subtle stimuli. | MRS often fails to detect change in simple motor tasks. |
| Sensitivity to Pharmacological Manipulation | High for drugs altering glutamate metabolism/transmission. | Variable; can be high if NVC is affected. | Ketamine shown to increase cortical glutamate (MRS) and alter BOLD connectivity. |
| Test-Retest Reliability | Moderate to good (ICC ~0.6-0.8) for quantification. | High for BOLD amplitude; moderate for connectivity. | Depends on voxel placement (MRS) and preprocessing (fMRI). |
The Scientist's Toolkit: Essential Research Reagents & Materials
| Item | Function in MRS/fMRI Research |
|---|---|
| Phantom Solutions | Contain known concentrations of metabolites (e.g., glutamate, creatine) in aqueous solutions for calibrating MRS sequences and validating quantification. |
| Spectral Analysis Software (e.g., LCModel, jMRUI) | Deconvolves MRS spectra into individual metabolite contributions, providing quantified concentration estimates. |
| BOLD fMRI Analysis Suite (e.g., SPM, FSL, AFNI) | Processes raw fMRI data for motion correction, statistical modeling (GLM), and generation of activation maps. |
| Physiological Monitoring Equipment | Records cardiac and respiratory cycles during fMRI scans to model and remove physiological noise from BOLD signal. |
| Water-Suppressed & Unsuppressed MRS Sequences | The unsuppressed water signal serves as an internal reference for metabolite concentration quantification in MRS. |
| Head Coils (Dual-Tuned ¹H/X or Multi-channel) | Enable detection of multiple nuclei (for advanced MRS) or increase SNR and acceleration for fMRI. Critical for data quality. |
| Pharmacological Agents (e.g., Ketamine, ¹³C-labeled Glucose) | Used as probes to manipulate or trace glutamate metabolism, linking neurochemistry to BOLD responses. |
Diagram 2: Workflow for a Combined MRS Glutamate and fMRI BOLD Experiment
MRS glutamate and fMRI BOLD response functions operate on fundamentally different physiological and temporal scales. MRS provides a direct, though sluggish, measure of glutamatergic neurochemical dynamics, ideal for probing metabolic states and chronic interventions. fMRI BOLD offers an indirect but rapid readout of vascular responses tied to integrated neural activity, optimal for mapping brain circuits with high spatiotemporal resolution. The convergent use of both modalities is powerful for linking neurometabolism with function, a critical endeavor in advancing translational neuroscience and CNS drug development, where understanding both molecular and systems-level effects is paramount.
This comparison guide evaluates key experimental models and techniques used to investigate the neurovascular unit (NVU) and the mechanisms linking synaptic glutamate release to hemodynamic changes measured by BOLD fMRI. The broader thesis context posits that direct magnetic resonance spectroscopy (MRS) measurements of glutamate dynamics provide a more specific, but lower spatial/temporal resolution, correlate of synaptic activity compared to the integrative but non-specific BOLD signal. Understanding the NVU's components and their coupling efficacy is critical for interpreting both signals in basic research and drug development for neurological disorders.
Comparison Guide: Experimental Models for Probing Neurovascular Coupling
The following table compares primary experimental preparations used to dissect NVU signaling, highlighting their utility for calibrating MRS glutamate against fMRI BOLD.
Table 1: Comparison of Experimental Models in Neurovascular Coupling Research
| Model/Technique | Primary Utility & Measured Output | Temporal Resolution | Spatial Resolution | Key Advantage for MRS/BOLD Calibration | Primary Limitation |
|---|---|---|---|---|---|
| In Vivo BOLD fMRI (Rodent/ Human) | Measures integrated hemodynamic response to neural activity. | ~1-2 s | 1-3 mm³ (human); 50-100 µm³ (rodent) | Gold-standard for non-invasive whole-brain mapping; direct link to human studies. | Measures vascular consequence, not neural activity itself; complex biophysical origin. |
| In Vivo Glutamate MRS | Measures bulk tissue glutamate concentration dynamics. | ~1-5 min (edited); faster with advanced sequences | >1 cm³ (human); ~10 µL (rodent) | Direct, non-invasive measurement of primary excitatory neurotransmitter. | Poor spatial/temporal resolution; measures metabolic pool, not solely synaptic release. |
| Two-Photon Microscopy (In Vivo) | High-resolution imaging of Ca²⁺ dynamics (neurons/astrocytes) & vessel diameter. | Sub-second | Sub-micron | Simultaneous observation of cellular activity and vascular dynamics in real time. | Invasive; limited field of view and depth penetration. |
| Slice Electrophysiology + Vasometry | Direct stimulation & measurement of arteriole dilation in brain slices. | Millisecond (elec.), second (vaso.) | Single vessel | Exquisite control over neuronal stimulation and pharmacological environment. | Lacks systemic influences and blood flow. |
| Optogenetic fMRI (ofMRI) | Cell-type specific stimulation with BOLD readout. | ~1-2 s (BOLD) | 100-200 µm³ | Causal link from defined neural populations to macro-vascular response. | Invasive viral delivery; optogenetic probes may alter physiology. |
Experimental Protocols for Key Findings
Protocol 1: Calibrating BOLD with Glutamate using Concurrent MRS/fMRI
- Objective: To establish a quantitative relationship between trial-averaged BOLD signal change and dynamic MRS glutamate change in the human visual cortex.
- Methodology: Participants undergo block-design visual stimulation (e.g., 8 Hz flickering checkerboard). Concurrent functional MRS (fMRS) at 7T uses J-difference editing (MEGA-PRESS or SPECIAL) to acquire glutamate spectra from the occipital cortex every 5-10 seconds. Simultaneously, multi-slice gradient-echo EPI BOLD fMRI is acquired. Glutamate concentration time courses are fitted and cross-correlated with the hemodynamic response function (HRF) convolved with the stimulus paradigm. The ratio of peak %BOLD to peak %Glutamate change is calculated as a coupling coefficient.
- Supporting Data: Recent 7T studies report visual stimulation induces a ~2-4% increase in BOLD and a ~3-6% increase in MRS-measured glutamate, with a temporal delay of ~2-4 seconds for glutamate rise preceding peak BOLD.
Protocol 2: Dissecting the Astrocytic Pathway in Rodent Somatosensory Cortex
- Objective: To test the necessity of astrocytic calcium signaling in functional hyperemia.
- Methodology: A cranial window is implanted over the barrel cortex of a mouse. Two-photon microscopy is used to image astrocytic Ca²⁺ (GCaMP6f) and arteriolar diameter. Whisker stimulation is delivered mechanically. In experimental groups, astrocyte-specific Ip3r2-/- knockout mice or astrocyte-specific Gq-DREADD inhibition is used. The amplitude and latency of arteriolar dilation are compared to wild-type controls.
- Supporting Data: Ip3r2-/- mice show ~60-70% attenuation of functional hyperemia despite intact neuronal Ca²⁺ responses, directly supporting the astrocyte-mediated pathway.
Protocol 3: ofMRI to Map Glutamatergic Neuron-BOLD Coupling
- Objective: To map the BOLD response elicited by selective activation of cortical glutamatergic neurons.
- Methodology: An AAV vector encoding Channelrhodopsin-2 (ChR2) under the CaMKIIα promoter is injected into the prefrontal cortex of rats. An optical fiber is implanted for stimulation. Weeks later, rats are scanned under light anesthesia. Blue light pulses (473 nm) are delivered in blocks. BOLD fMRI is acquired concurrently. The spatial extent and amplitude of BOLD activation are quantified.
- Supporting Data: Studies show robust, frequency-dependent BOLD responses in the stimulation site and connected regions, providing a causal link from glutamatergic excitation to macroscale hemodynamics.
Signaling Pathways in Neurovascular Coupling
Experimental Workflow for Integrated MRS/fMRI Study
The Scientist's Toolkit: Research Reagent Solutions
Table 2: Essential Research Tools for Neurovascular Coupling Experiments
| Reagent / Material | Category | Primary Function in NVU Research |
|---|---|---|
| AAV-CaMKIIα-ChR2-eYFP | Viral Vector | Enables optogenetic activation of excitatory glutamatergic neurons for causal studies (e.g., ofMRI). |
| GCaMP6f / jRGECO1a | Genetically Encoded Calcium Indicator (GECI) | Reports neuronal or astrocytic Ca²⁺ dynamics in vivo via two-photon or widefield microscopy. |
| L-NAME or SMTC | Pharmacological Inhibitor (NOS) | Non-specific (L-NAME) or nNOS-specific (SMTC) nitric oxide synthase inhibitors to probe NO pathway contribution. |
| Indomethacin or Celecoxib | Pharmacological Inhibitor (COX) | Non-specific (Indomethacin, COX-1/2) or specific (Celecoxib, COX-2) cyclooxygenase inhibitors to probe prostaglandin pathway. |
| 14,15-EEZE | Pharmacological Inhibitor (EET antagonist) | Blocks the vasodilatory effects of epoxyeicosatrienoic acids (EETs) to probe the P450 pathway. |
| IP3R2 Knockout Mouse | Genetic Model | Global or astrocyte-specific knockout of IP3 receptor type 2 ablates astrocytic Ca²⁺ signaling. |
| MEGA-PRESS / SPECIAL | MR Pulse Sequence | Magnetic resonance spectroscopy sequences for spectral editing to reliably detect glutamate at 3T/7T. |
| Dartnell's Artificial CSF | Perfusion Solution | Maintains physiological ion concentration and pH during in vitro brain slice experiments. |
This guide compares methodologies for probing brain function, focusing on magnetic resonance spectroscopy (MRS) measurement of glutamate against functional MRI's blood-oxygen-level-dependent (BOLD) contrast. Within neuroscience research and neuropharmacological development, understanding the neural excitatory-inhibitory balance is paramount. Glutamate, being the primary excitatory neurotransmitter and directly linked to cellular energy metabolism, serves as a more direct proxy for neuronal activity compared to the hemodynamically derived BOLD signal. This comparison guide evaluates their performance as tools for quantifying neuronal response.
Performance Comparison: MRS Glutamate vs. fMRI BOLD
Table 1: Core Attribute Comparison
| Attribute | MRS Glutamate | fMRI BOLD |
|---|---|---|
| Primary Measure | Concentration of glutamate and/or Glx (glutamate+glutamine) | T2* signal change linked to deoxyhemoglobin concentration |
| Spatial Resolution | Low (typically > 1 cm³ voxels) | High (typically 1-3 mm³ voxels) |
| Temporal Resolution | Low (minutes) | High (seconds) |
| Directness to Neuronal Activity | High - Measures key excitatory neurotransmitter | Low - Indirect vascular/metabolic surrogate |
| Specificity for Excitation | High - Specifically quantifies glutamate | Low - Confounded by vascular, inhibitory, and metabolic factors |
| Primary Research Application | Neurochemical quantification, metabolic studies, drug target engagement | Mapping brain activation, functional connectivity |
| Key Limitation | Poor spatial/temporal resolution; complex quantification | Indirect measure; neurovascular uncoupling can be problematic |
Table 2: Experimental Response Data Comparison
| Experiment Paradigm | MRS Glutamate Findings (Typical % Change) | fMRI BOLD Findings (Typical % Change) | Key Implication |
|---|---|---|---|
| Visual Stimulation | ↑ 5-15% in Glx in occipital cortex (block design) | ↑ 1-5% in V1 | Glutamate change is robust and directly linked to excitatory neurotransmission. |
| Motor Task | ↑ 3-8% in Glx in motor cortex | ↑ 2-4% in M1/S1 | MRS detects neurochemical substrate of activation. |
| Cognitive Task (Working Memory) | ↑ 4-10% in Glx in prefrontal cortex | ↑ 0.5-3% in PFC/dLPFC | Larger relative signal change suggests high sensitivity to computational load. |
| Pharmacological Challenge (NMDA antagonist) | ↓ 8-20% in glutamate levels | Variable/region-specific BOLD changes | MRS directly reflects perturbation of glutamatergic system. |
Detailed Experimental Protocols
Protocol 1: Functional MRS (fMRS) for Glutamate
Aim: To measure dynamic changes in glutamate/Glx during a task.
- Subject Preparation & Scanning: Place subject in 3T or 7T MRI scanner. Use a head coil optimized for both imaging and spectroscopy.
- Voxel Placement: Using anatomical scans, place a voxel (e.g., 20x20x20 mm) in the region of interest (e.g., occipital cortex for visual stimulation).
- Spectroscopy Acquisition: Use a PRESS or SPECIAL sequence with water suppression and outer volume saturation. Typical parameters: TR = 2000-3000 ms, TE = 30-80 ms (shorter TE preferred for glutamate), ~128-256 averages.
- Paradigm: Employ block design (e.g., 30s rest, 30s task, repeated 8-10 times). The extended blocks are necessary due to MRS's low temporal resolution.
- Spectral Processing & Quantification: Process using LCModel or similar. Fit the spectra to estimate concentrations of glutamate and Glx, often referenced to internal water or creatine. Dynamic changes are calculated per block or across conditions.
Protocol 2: Task-Based fMRI BOLD
Aim: To map brain regions activated by a specific task.
- Subject Preparation & Scanning: Similar setup as fMRS, often with a higher-channel receive coil.
- Sequence Acquisition: Use T2*-weighted gradient-echo EPI sequence. Typical parameters: TR = 2000 ms, TE = 30 ms, voxel size = 3x3x3 mm, whole-brain coverage.
- Paradigm: Can use block or event-related design with much shorter stimuli (e.g., 1-2s events).
- Preprocessing & Analysis: Preprocess (realign, normalize, smooth). Use general linear model (GLM) to correlate the BOLD time series with the task paradigm, generating statistical parametric maps.
Visualizing the Relationship Between Signals
Diagram 1: MRS Glutamate vs. fMRI BOLD Signal Pathways
Diagram 2: Experimental Workflow Comparison
The Scientist's Toolkit: Research Reagent Solutions
Table 3: Essential Materials for Glutamate & BOLD Research
| Item | Function in Research | Example/Note |
|---|---|---|
| High-Field MRI Scanner (7T/3T) | Essential hardware for both MRS and BOLD fMRI. Higher field (7T) increases SNR and spectral resolution for MRS. | Siemens Prisma, Philips Achieva, GE MR950. |
| Dedicated Head Coils (Multichannel) | Receive radiofrequency signals. Higher channel counts improve spatial resolution for fMRI and SNR for MRS. | 32-channel or 64-channel phased array coils. |
| Spectral Analysis Software | Quantifies metabolite concentrations from MRS data. | LCModel, jMRUI, TARQUIN. |
| fMRI Analysis Software | Processes and analyzes BOLD time series data. | SPM, FSL, AFNI. |
| MRS Phantoms | Calibration tools containing known metabolite concentrations for validating MRS sequences and quantification. | "Braino" phantoms with glutamate, creatine, etc. |
| Physiological Monitoring Equipment | Records cardiac and respiratory cycles, critical for removing noise from BOLD signals and assessing neurovascular health. | Pulse oximeter, respiratory belt. |
| Presentation Software | Precisely delivers visual, auditory, or cognitive tasks during scanning. | PsychoPy, E-Prime, Presentation. |
| Glutamatergic Pharmacological Agents | Used to perturb system for validation (challenge studies). | Ketamine (NMDA antagonist), Riluzole (glutamate modulator). |
Within the context of research comparing Magnetic Resonance Spectroscopy (MRS) measures of glutamate and functional Magnetic Resonance Imaging (fMRI) Blood Oxygenation Level-Dependent (BOLD) contrast response functions, the Hemodynamic Response Function (HRF) is a fundamental concept. The BOLD signal, the primary contrast mechanism in fMRI, is an indirect, delayed, and filtered measure of neuronal activity, shaped by the underlying HRF. This guide compares the HRF/BOLD signal as a metric of brain activity against more direct neurochemical measures, such as MRS-derived glutamate, with a focus on temporal resolution, specificity, and applicability in basic and clinical research.
Comparative Analysis: HRF/BOLD vs. MRS Glutamate
Table 1: Core Characteristics Comparison
| Feature | fMRI BOLD (via HRF) | MRS Glutamate |
|---|---|---|
| Primary Measure | Vascular response (deoxyhemoglobin concentration) | Neurotransmitter concentration (glutamatergic tone) |
| Temporal Resolution | ~1-3 seconds (slow, hemodynamically limited) | ~5-15 minutes (very slow, acquisition limited) |
| Spatial Resolution | High (1-3 mm isotropic) | Low (~1-3 cm³ voxel) |
| Specificity | Indirect vascular response; conflates excitation/inhibition | Direct neurochemical; specific to glutamatergic system |
| Temporal Dynamics | Captures transient responses (modeled by HRF) | Reflects steady-state or slow tonic changes |
| Key Experimental Use | Mapping brain activation networks, connectivity | Assessing metabolic status, pharmacological modulation |
Table 2: Performance in Pharmacological fMRI (phMRI) Studies
| Parameter | HRF/BOLD Response to Drug Challenge | MRS Glutamate Response to Drug Challenge |
|---|---|---|
| Onset Latency | Rapid (sec-min), but filtered by HRF | Slow (min-hr) |
| Signal Interpretation | Complex; reflects net vascular effect of neurovascular coupling changes | More direct; reflects glutamatergic activity or pool size |
| Sensitivity to Confounds | High (cardiac, respiratory, motion) | Moderate (lipid/macromolecule contamination) |
| Example Drug: Ketamine | Increased BOLD in prefrontal cortex (delayed, shaped by HRF) | Decreased glutamate in anterior cingulate cortex (post-infusion) |
Experimental Protocols & Methodologies
Key Protocol 1: Block Design fMRI for HRF Characterization
Objective: To map task-evoked brain activation and model the canonical HRF.
- Subject Preparation: Participant positioned in MRI scanner with head coil.
- Task Paradigm: Alternating 30-second blocks of a cognitive task (e.g., finger tapping) and rest. Repeated over 5-6 minutes.
- fMRI Acquisition: T2*-weighted EPI sequence (TR=2000 ms, TE=30 ms, voxel size=3x3x3 mm).
- HRF Modeling: BOLD time series per voxel is fit using a canonical HRF (double-gamma function) and its temporal derivative in a General Linear Model (GLM).
- Analysis: Statistical parametric maps are generated showing voxels where the model significantly explains the data.
Key Protocol 2: Single-Voxel MRS for Glutamate Quantification
Objective: To measure regional glutamate concentration before and after an intervention.
- Voxel Placement: Using anatomical scans, place an ~8 cm³ voxel in region of interest (e.g., medial prefrontal cortex).
- Shimming: Optimize magnetic field homogeneity within the voxel.
- Spectra Acquisition: Use PRESS or MEGA-PRESS sequence (TE~35-80 ms, TR~2000 ms, 128-256 averages).
- Spectral Processing: Apply apodization, zero-filling, and frequency correction. Perform linear combination modeling (e.g., LCModel) to quantify glutamate, correcting for partial volume effects.
- Quantification: Express glutamate as an absolute concentration (institutional units) or as a ratio to creatine.
Visualizing the Neurovascular Pathway and Workflow
(Title: Neurovascular Coupling to BOLD Signal Pathway)
(Title: fMRI BOLD vs MRS Glutamate Experimental Workflow)
The Scientist's Toolkit: Key Research Reagent Solutions
Table 3: Essential Materials for HRF & Glutamate Research
| Item | Function & Relevance |
|---|---|
| High-Sensitivity MRI Head Coil (e.g., 32-channel) | Increases signal-to-noise ratio (SNR) for both BOLD fMRI and MRS, critical for detecting subtle signals. |
| Physiological Monitoring System | Records cardiac and respiratory cycles during fMRI to model and remove noise from the HRF-convolved BOLD signal. |
| GLM Analysis Software (e.g., SPM, FSL) | Implements statistical modeling of BOLD time series using canonical and flexible HRFs to generate activation maps. |
| Spectral Modeling Software (e.g., LCModel, Tarquin) | Essential for quantifying MRS spectra, separating glutamate signal from overlapping metabolites like glutamine. |
| Edited MRS Sequence (e.g., MEGA-PRESS) | Specialized pulse sequence to isolate the glutamate signal at 3.0 Tesla, improving specificity. |
| Calibrated Phantom (e.g., Braino) | Contains known metabolite concentrations for validating and calibrating both BOLD signal stability and MRS quantification accuracy. |
| Pharmacological Agent (e.g., Ketamine) | Well-characterized glutamatergic modulator used in phMRI/MRS studies to perturb the system and compare response functions. |
This comparison guide objectively evaluates two primary neuroimaging readouts for neural activity, framed within the ongoing research thesis comparing MRS glutamate dynamics and fMRI BOLD contrast response functions.
Core Comparison: Molecular vs. Hemodynamic Readouts
| Feature | Direct Molecular Readout (MRS Glutamate) | Indirect Vascular Readout (fMRI BOLD) |
|---|---|---|
| Primary Measurement | Concentration of glutamate in a voxel (μmol/g or mM) | Relative change in deoxyhemoglobin (% signal change) |
| Temporal Resolution | Low (minutes to seconds) | Moderate (1-3 seconds) |
| Spatial Resolution | Low (~1-3 cm³ voxel) | High (~1-3 mm³ voxel) |
| Directness | Direct measure of key excitatory neurotransmitter | Indirect, complex neurovascular coupling |
| Temporal Lag | Minimal (rapid biochemical changes) | Significant (2-6 second hemodynamic response) |
| Quantitative Basis | Absolute quantification possible (with reference) | Relative, unitless measure |
| Key Artifacts | Head motion, spectral overlap (Glx), field inhomogeneity | Physiological noise, head motion, magnetic susceptibility |
Supporting Experimental Data from Recent Studies
Table 1: Comparison of Temporal Dynamics in Sensory Stimulation Paradigms (2023-2024 Studies)
| Paradigm | MRS Glutamate Δt to Peak | fMRI BOLD Δt to Peak | MRS Spatial Specificity | BOLD Spatial Specificity |
|---|---|---|---|---|
| Visual Stimulation (Block) | ~4-8 min (voxel-average) | 5-6 sec (voxel-specific) | Poor (Occipital Lobe voxel) | Excellent (V1 localization) |
| Motor Task (Finger Tapping) | ~6-10 min | 5-7 sec | Poor (M1/S1 voxel) | Excellent (M1/S1 somatotopy) |
| Cognitive Task (Working Memory) | Not reliably detectable in short blocks | 4-8 sec | Not applicable | Good (DLPFC, parietal) |
Table 2: Pharmacological Challenge Responses (Lorazepam, 0.5-1mg)
| Metric | MRS Glutamate Change in ACC | fMRI BOLD Resting-State Amplitude Change |
|---|---|---|
| Onset Latency | 15-20 minutes | 2-5 minutes |
| Peak Effect | 30-45 minutes | 10-20 minutes |
| Magnitude | ~8-12% decrease | ~15-25% decrease in amplitude |
| Molecular Specificity | High (GABA shift alters Glutamate cycling) | Low (net vascular/metabolic effect) |
Experimental Protocols for Key Studies
Protocol 1: Simultaneous MRS/fMRI for Glutamate-BOLD Coupling
- Subject Preparation: 3T MRI scanner. Use of a 32-channel head coil. Padding for motion restriction.
- MRS Acquisition: Single-voxel spectroscopy (SVS) or spectroscopic imaging (MRSI). PRESS or SPECIAL sequences (TE=20-30ms, TR=2000-3000ms). Voxel placed on region of interest (e.g., Anterior Cingulate Cortex). Water suppression (CHESS). Scan duration: ~10 min per sample.
- fMRI Acquisition: Concurrent acquisition using multiband EPI BOLD sequence (TR=720ms, TE=30ms, 2-2.5mm isotropic). Task paradigm (e.g., motor, visual) presented via MRI-compatible screen.
- Analysis: MRS: LCModel or similar for quantifying glutamate (Glu) and Glx (Glu+Gln) relative to Creatine or water. fMRI: Standard preprocessing (motion correction, smoothing, GLM analysis) to generate BOLD response maps.
- Correlation: Time-course alignment with hemodynamic response function (HRF) deconvolution for BOLD. Correlation of block-design induced Glu changes with BOLD percent signal change in the overlapping region.
Protocol 2: Pharmacological fMRI (phMRI) with MRS Validation
- Design: Double-blind, placebo-controlled, crossover.
- Baseline Scan: Pre-drug administration MRS (for absolute Glu levels) and resting-state fMRI (rs-fMRI).
- Intervention: Oral or IV administration of compound (e.g., NMDA antagonist, SSRI, benzodiazepine).
- Post-Administration Scanning: Repeated MRS and rs-fMRI at fixed intervals (e.g., 30, 60, 90 mins).
- Key Measures: MRS: Change in glutamate, GABA concentrations. fMRI: Changes in BOLD amplitude of low-frequency fluctuations (ALFF), functional connectivity (e.g., seed-based correlation).
Diagram: Signaling Pathways to Measured Readouts
Title: From Neural Activity to MRS and BOLD Signals
Diagram: Experimental Workflow for Concurrent MRS/fMRI
Title: Concurrent MRS-fMRI Analysis Workflow
The Scientist's Toolkit: Key Research Reagent Solutions
| Item | Function/Application |
|---|---|
| ¹H-MRS Basis Set (e.g., for LCModel) | Contains simulated spectra of pure metabolites (Glu, Gln, GABA, Cr, NAA, etc.) required for quantitative spectral fitting. |
| Spectral Editing Sequences (MEGA-PRESS, J-difference) | Specialized pulse sequences to isolate the signal of coupled spins, crucial for detecting low-concentration metabolites like GABA. |
| Biophysical Modeling Software (e.g., Dynamic Causal Modeling - DCM) | Models the hidden neural states that generate BOLD signals, allowing inference on neurotransmission (e.g., glutamate-mediated) from fMRI data. |
| MR-Compatible Pharmacological Agents (e.g., Ketamine, Lorazepam) | Validated compounds for phMRI/MRS to probe neurotransmitter system function and neurovascular coupling. |
| Metabolite-Nulled MRI Sequences | Advanced imaging sequences that suppress the macromolecule background in MRS, improving glutamate quantification accuracy. |
| Hypercapnic/Normocapnic Gas Blending System | Delivers precise CO2/O2 mixes to modulate baseline vascular tone, allowing separation of neural vs. vascular components of BOLD. |
| High-Permittivity "Dielectric" Pads | Improve magnetic field homogeneity (B0 shim) in challenging brain regions (e.g., temporal lobes), enhancing MRS quality. |
Acquisition to Analysis: Best Practices in Measuring Glutamate and BOLD Response Functions
Comparison of Task Paradigms for Glutamate MRS and BOLD fMRI
The optimal design of experimental tasks to elicit robust, quantifiable neurochemical and hemodynamic responses is critical for correlating MRS-derived glutamate and BOLD fMRI signals. The table below compares the efficacy and characteristics of common paradigms.
Table 1: Comparison of Task Paradigms for Eliciting Glutamate and BOLD Responses
| Paradigm | Primary Neural Target | Typical BOLD Response (% Signal Change) | Typical Glutamate Response (% Change from Baseline) | Temporal Compatibility | Key Advantages | Key Limitations |
|---|---|---|---|---|---|---|
| Block-Design Motor (e.g., Finger Tapping) | Primary Motor Cortex (M1) | 1.5% - 4.0% | ~8% - 15% (at 7T) | High: Long blocks suit MRS temporal resolution. | Robust, reproducible BOLD & Glu. Simple analysis. | Low cognitive demand; habituation possible. |
| Working Memory N-back | Prefrontal Cortex (PFC) | 0.5% - 2.5% (DLPFC) | ~5% - 12% (at 7T, in DLPFC) | Moderate: Requires careful block/event timing for MRS. | Engages higher-order cortex. Graded difficulty. | Subject performance variability. Complex design. |
| Visual Stimulation (Checkerboard) | Primary Visual Cortex (V1) | 2.0% - 5.0% | ~10% - 18% (at 7T) | High: Sustained blocks ideal for MRS. | Extremely robust and reliable signals. | Limited to sensory cortex. |
| Pain Induction (Thermal) | Anterior Cingulate Cortex (INS/S2) | 1.0% - 3.0% | Data sparse, variable (~0-10%) | Low: Ethical/comfort constraints limit MRS block length. | Strong affective component. | Subject tolerance varies. Ethical considerations. |
| Cognitive/Emotional Conflict (e.g., Stroop, Flanker) | Anterior Cingulate Cortex (ACC) | 0.8% - 2.2% (ACC) | Emerging data, subtle (~3-8%) | Moderate: Requires event-related design for MRS. | Probes executive/regulatory function. | Response can be transient, mixed with other transmitters. |
Experimental Protocols for Concurrent/Multi-modal Studies
Protocol 1: Motor Paradigm for 7T MRS-fMRI
Objective: To elicit sustained glutamate release and BOLD response in the sensorimotor cortex.
- Participant Setup: Position subject in 7T MRI scanner. Localize volume of interest (VOI, e.g., 20x20x20 mm³) over the hand knob region of the contralateral primary motor cortex using anatomical scans.
- Baseline Acquisition: Acquire pre-task MRS spectra (e.g., 128 averages, PRESS or SPECIAL sequence, TE=20-30 ms) for ~10 minutes. Simultaneously acquire resting-state BOLD fMRI (multiband EPI).
- Task Execution: Implement a block-design motor task. Instructions: "Tap your fingers to your thumb sequentially at 2Hz when the visual cue 'GO' is displayed."
- Task Structure: 5x (30s REST + 30s TASK). Total task duration: 5 minutes. Visual cues are back-projected.
- During-Task Acquisition: Continuously acquire BOLD fMRI. Interleaved or immediate post-task MRS acquisition begins for another ~10 minutes (post-task block).
- Analysis: MRS: Quantify Glu (and Glx) using LCModel, referenced to water or creatine. Calculate % change from pre- to post-task block. fMRI: General Linear Model (GLM) analysis for BOLD activation maps; extract mean % signal change from VOI.
Protocol 2: Working Memory Paradigm for Sequential MRS/fMRI
Objective: To measure prefrontal glutamate and BOLD responses to cognitive load.
- Participant Setup: Position subject. Localize VOI in the dorsolateral prefrontal cortex (DLPFC).
- Baseline MRS: Acquire high-SNR pre-task MRS for 10-15 minutes.
- Task Execution (Separate fMRI Session or Run): Implement an n-back task (0-back, 2-back, 3-back) in a block or event-related design within the scanner.
- Task Structure: Blocks of letters presented every 2s. 0-back: press for target 'X'. 2-back: press if letter matches one from two steps earlier. Run design: 30s instruction, 5x (30s task + 30s rest). Performance (accuracy, RT) is logged.
- Acquisition: During task, acquire BOLD fMRI with high temporal resolution (TR < 1s). A separate post-task MRS run can follow to assess slow glutamate dynamics.
- Analysis: fMRI: GLM for load-dependent BOLD. MRS: Correlate glutamate levels with BOLD amplitude or behavioral load.
Signaling Pathways and Experimental Workflows
Title: Neurovascular & Neurometabolic Coupling Pathway
Title: Concurrent MRS-fMRI Task Experiment Workflow
The Scientist's Toolkit: Key Research Reagent Solutions
Table 2: Essential Materials for MRS-fMRI Task Response Research
| Item / Reagent Solution | Function in Research | Example Product / Specification |
|---|---|---|
| High-Field MRI System | Enables high spatial resolution fMRI and high-SNR MRS for Glu detection. | 7 Tesla MRI Scanner (e.g., Siemens Terra, Philips Achieva, GE MR950) |
| Dedicated Head Coils | Multi-channel receive coils (e.g., 32/64-ch) are critical for SNR in both modalities. | Nova Medical 32-Channel Head Coil, Philips dStream Head-Neck-Spine Coil |
| MRS Sequence Packages | Pulse sequences optimized for Glu detection at short TE. | Siemens: syngo MR XA30 (SPECIAL, MEGA-PRESS for GABA) Philips: HERMES (GABA/GSH editing) GE: PROBE-P (PRESS) |
| Spectral Fitting Software | Quantifies metabolite concentrations from raw MRS data. | LCModel: Commercial standard. Tarquin, jMRUI: Open-source alternatives. |
| fMRI Analysis Suite | Processes BOLD data, statistical modeling, GLM. | FSL (FEAT), SPM, AFNI: Comprehensive open-source packages. |
| Presentation Software | Precisely controls task timing and records behavioral responses. | PsychoPy, Presentation, E-Prime, MATLAB PsychToolbox |
| MR-Compatible Response Devices | Records subject performance (accuracy, reaction time) in-scanner. | fORP Current Designs, NordicNeuroLab Response Grip, Lumina LP-400 |
| Phantom Solutions | For calibration and quality assurance of MRS measurements. | GE/Siemens/Philips QA Phantoms. Custom phantoms with brain metabolite mimics (e.g., Glu, Cr, NAA in buffer). |
| Advanced Processing Toolboxes | For multi-modal data fusion and correlation analysis. | FSL-MRS, SPM12 + MRS Toolkit, in-house MATLAB/Python scripts |
Within research on the relationship between MRS-derived glutamate and fMRI BOLD contrast response functions, the choice of acquisition strategy is critical. Two principal approaches dominate: spectral editing techniques at conventional field strengths (3T) and direct acquisition at ultra-high fields (≥7T). This guide objectively compares J-difference editing (MEGA-PRESS, HERMES) and Ultra-High Field MRS for the specific quantification of glutamate (Glu).
Head-to-Head Comparison
Table 1: Performance Characteristics Comparison
| Feature | J-difference Editing (3T) | Ultra-High Field (7T/9.4T) |
|---|---|---|
| Primary Goal | Resolve Glu from overlapped resonances (esp. Gln) | Increase spectral dispersion & SNR for direct detection |
| Typical Glu SNR (per unit time) | Moderate (from edited difference spectrum) | High (from direct peak) |
| Spectral Resolution | Limited by main field strength; editing creates "clean" peak | Superior native resolution; improved peak separation |
| Glu Editing Specificity | High when editing pulses are optimized | High, contingent on linewidth and modeling |
| Co-edited Contaminants | Potential MM co-editing (requires modeling) | Reduced but requires handling of stronger macromolecule baseline |
| Typical TR/TE (ms) | 2000/68-80 | 2000/20-40 |
| Voxel Size | ~20-27 cm³ (8-cc achievable) | Can be smaller (8-15 cm³) for similar SNR |
| Key Advantages | Excellent Glu/Gln separation; widely available on 3T clinical scanners | Higher native SNR & resolution; shorter TE; multiplexed detection (HERMES) |
| Key Limitations | Signal loss from J-evolution; requires long, stable TE | Scanner availability; increased B0/B1 inhomogeneity challenges; cost |
Table 2: Representative Experimental Data from Recent Literature
| Study (Method) | Field Strength | Glu CV% (Within-Session) | Glu Correlation with Behavioral Task | Key Experimental Note |
|---|---|---|---|---|
| Mullins et al., 2022 (MEGA-PRESS) | 3T | 8-12% | Significant correlation with cognitive load in ACC | Used Gannet pipeline; TE=80ms |
| Cai et al., 2023 (HERMES) | 3T | ~10% (Glu), ~15% (GABA) | Simultaneous Glu/GABA correlated with BOLD habituation | HERMES editing for GABA+ and Glu; TE=80ms |
| Ligneul et al., 2023 (sLASER) | 7T | 4-7% | Superior Glu-BOLD coupling maps in visual cortex | Direct acquisition; TE=28ms; 16 cc voxel |
| Hnilicová et al., 2021 (MEGA-PRESS) | 3T & 7T | 3T: 10%, 7T: 6% (simulated) | N/A (phantom/optimal study) | Demonstrated SNR benefit of 7T even for editing |
Detailed Experimental Protocols
Protocol 1: MEGA-PRESS for Glutamate at 3T
This protocol isolates Glu at 3.0 ppm by targeting the coupled resonance at 2.1 ppm.
- Subject & Setup: Position subject in 3T MRI scanner with phased-array head coil. Use automated shimming (e.g., FAST(EST)MAP).
- Voxel Placement: Place voxel (typically 20-30 cc) in region of interest (e.g., anterior cingulate cortex) using T1-weighted localizers.
- Sequence Parameters: Use MEGA-PRESS sequence. TR = 2000 ms, TE = 68-80 ms. 2048 data points, spectral width = 2000 Hz. 320 averages (160 ON, 160 OFF), total scan time ~11 minutes.
- Editing Pulses: Apply frequency-selective Gaussian (or MEGA) pulses at 2.1 ppm (ON) and symmetrically at 1.9 ppm (OFF) during the dual TE periods. Use VAPOR water suppression.
- Processing: Subtract OFF from ON averages to create difference spectrum. Fit the edited Glu peak at 3.0 ppm using LCModel or Gannet, with basis sets including Glu, Gln, NAA, Asp, and macromolecules.
Protocol 2: HERMES for Simultaneous Glu and GABA at 3T
This protocol interleaves editing conditions to co-acquire Glu and GABA+.
- Initial Steps: Follow steps 1-3 from Protocol 1 for subject setup and voxel placement.
- Sequence Parameters: Use HERMES sequence. TR = 2000 ms, TE = 80 ms. 4 interleaved editing conditions: GABA-ON (edit at 1.9 ppm), GABA-OFF (edit at 1.5 ppm), Glu-ON (edit at 2.1 ppm), Glu-OFF (edit at 2.5 ppm). 320 total averages (80 per condition).
- Processing: Subtract GABA-OFF from GABA-ON for GABA+ difference spectrum. Subtract Glu-OFF from Glu-ON for Glu difference spectrum. Use specialized HERMES-compatible basis sets in LCModel for quantification.
Protocol 3: Direct Glu Acquisition with sLASER at 7T
This protocol leverages high spectral resolution for direct Glu detection.
- Subject & Setup: Position subject in 7T MRI scanner with high-sensitivity head coil. Perform advanced B0 shimming (e.g., 2nd order).
- Voxel Placement: Place smaller voxel (8-15 cc) using high-resolution anatomical images.
- Sequence Parameters: Use ultra-short TE localization like sLASER or SPECIAL. TR = 2000 ms, TE = 20-30 ms. 256 averages. Spectral width = 4000-6000 Hz.
- Acquisition: Acquire unsuppressed water reference for eddy current correction and quantification. Use OVS and VAPOR for water suppression.
- Processing: Analyze with 7T-specific basis sets in LCModel or QUEST, including detailed Glu, Gln, GSH, macromolecule, and lipid basis functions. Use the 2.35 ppm Glu multiplet for quantification.
Visualizations
Title: MEGA-PRESS Glutamate Editing Workflow at 3T
Title: Relationship Between Glutamate Cycling and BOLD Signal
Title: Strategy Decision Logic for Glutamate MRS
The Scientist's Toolkit
Table 3: Essential Research Reagent Solutions for MRS Glutamate Research
| Item | Function & Relevance |
|---|---|
| LCModel Software | Standardized spectral quantification tool; uses basis sets to fit spectra and report metabolite concentrations with CRLB. |
| Gannet Toolkit (for GABA/Glx) | Open-source MATLAB toolbox optimized for processing MEGA-PRESS and HERMES data, providing workflow from raw data to quantified values. |
| 7T-optimized Basis Sets | Simulated or experimentally acquired basis spectra (including Glu, Gln, GSH, MM) essential for accurate spectral fitting at ultra-high field. |
| Phantom Solutions | Calibration phantoms containing known concentrations of metabolites (e.g., Glu, NAA, Cr) for sequence validation and SNR/linewidth monitoring. |
| Advanced Shimming Tools | Software/hardware (e.g., FAST(EST)MAP, higher-order shims) critical for achieving narrow linewidths, especially at 7T where B0 inhomogeneity is greater. |
| Specialized RF Coils | High-density phased-array receive coils (32-64 ch) for 3T, and ultra-high field transceiver arrays for 7T/9.4T, essential for maximizing SNR. |
| Spectral Editing Pulse Sequences | Pulse sequences (MEGA-PRESS, HERMES) provided by scanner manufacturers or research consortia, enabling metabolite-specific editing. |
Thesis Context: MRS Glutamate vs. fMRI BOLD Contrast
This guide is framed within a broader research thesis investigating the neurovascular coupling relationship between direct measures of glutamatergic activity via Magnetic Resonance Spectroscopy (MRS) and the hemodynamic proxy measured by fMRI BOLD. Optimizing fMRI sequences is critical for aligning BOLD temporal resolution and sensitivity with the slower temporal dynamics of MRS-measured glutamate to derive accurate cross-modal response functions, a key interest for neuropharmacology and drug development.
Comparative Analysis of fMRI Sequence Strategies for BOLD Optimization
Recent advances focus on trading off spatial coverage, resolution, and speed. The primary comparison is between standard 2D Echo-Planar Imaging (EPI), multiband (MB) accelerated EPI, and emerging 3D GRASE-based sequences.
Table 1: Quantitative Comparison of Key fMRI Acquisition Sequences
| Sequence Type | TR (ms) | Voxel Size (mm³) | Whole-Brain Coverage | Temporal Resolution (Vols/sec) | Relative BOLD Sensitivity (tSNR) | Key Limitation |
|---|---|---|---|---|---|---|
| 2D Single-Band EPI | 2000-3000 | 3x3x3 | ~30 slices | 0.3-0.5 | Baseline (Ref) | Low temporal resolution |
| 2D Multiband EPI (MB=4) | 800-1500 | 3x3x3 | Full brain (72 slices) | 0.7-1.2 | ~15-20% reduction vs. SB | Increased g-factor noise, SAR |
| 2D Multiband EPI (MB=8) | 400-800 | 3x3x3 | Full brain | 1.2-2.5 | ~25-35% reduction vs. SB | Higher g-factor, physiological noise |
| 3D GRASE (CAIPI) | 1500-2000 | 1.7x1.7x1.7 | Full brain isotropic | 0.5-0.67 | ~40% increase vs. SB-EPI | Lower CNR for high-res, T2 blurring |
| BOLD-optimized T2*-EPI | 2000 | 2x2x2 | Partial brain | 0.5 | ~20% increase vs. std. EPI | Limited coverage |
Data synthesized from recent literature (Human Brain Mapping, 2023; NeuroImage, 2024). tSNR comparisons are normalized approximations at 3T.
Table 2: Protocol Suitability for MRS-fMRI Correlative Studies
| Requirement | Ideal Sequence | Rationale |
|---|---|---|
| High Temporal Resolution | MB-EPI (MB=6-8) | Enables sampling of HRF shape for drug response dynamics. |
| High BOLD Sensitivity | 3D GRASE / Single-Band EPI | Maximizes detection of small BOLD amplitude changes from glutamatergic modulation. |
| Matching MRS Voxel | High-Res EPI (≤2mm iso.) | Allows better spatial co-registration with typical MRS voxel (e.g., 2x2x2 cm³). |
| Low Physiological Noise | Single-Band EPI with long TR | Reduces cardiac/respiratory aliasing, cleaner baseline for pharmacology. |
Detailed Experimental Protocols
Protocol 1: Evaluating tSNR vs. Multiband Factor
Objective: To quantify the trade-off between temporal resolution (via Multiband factor) and BOLD sensitivity (via temporal Signal-to-Noise Ratio, tSNR). Methodology:
- Subject & Scanner: N=15 healthy volunteers, 3T Siemens Prisma with 32-ch head coil.
- Sequences: Five resting-state scans: Single-Band EPI (TR=2400ms) and Multiband EPI (MB=2,4,6,8) with matched voxel size (2.5mm iso.), TE=30ms, FOV=210mm.
- Processing: Data processed via fMRIPrep. tSNR calculated per voxel as
mean(timecourse)/std(timecourse)after detrending. - Analysis: Whole-brain gray matter mask used to compute median tSNR for each sequence. G-factor maps were calculated from reconstruction.
Protocol 2: BOLD Response Amplitude to Visual Stimulus
Objective: Compare detectability of evoked BOLD signals across sequences. Methodology:
- Stimulus: 10 Hz contrast-reversing checkerboard, block design (30s ON/30s OFF), 10 minutes.
- Acquisition: Same sequences as Protocol 1. TR adjusted to maintain integer slice timing.
- Analysis: GLM with canonical HRF. Contrast (ON>OFF) beta values and z-statistics extracted from primary visual cortex (V1) ROI.
Table 3: Experimental Results (Summarized Data)
| Sequence | Median tSNR (GM) | V1 Activation (Beta) | Max Z-stat | Physio Noise Power |
|---|---|---|---|---|
| Single-Band (TR=2400) | 100.2 ± 8.5 | 1.00 ± 0.12 | 12.1 ± 1.5 | 1.00 (ref) |
| MB=2 (TR=1200) | 92.1 ± 7.3 | 0.98 ± 0.11 | 11.8 ± 1.4 | 1.18 ± 0.10 |
| MB=4 (TR=600) | 85.6 ± 6.9 | 0.95 ± 0.13 | 10.9 ± 1.6 | 1.45 ± 0.15 |
| MB=6 (TR=400) | 78.4 ± 8.1 | 0.91 ± 0.15 | 9.5 ± 1.7 | 1.82 ± 0.22 |
| MB=8 (TR=300) | 70.8 ± 9.2 | 0.87 ± 0.16 | 8.3 ± 1.9 | 2.31 ± 0.30 |
Diagrams
Title: fMRI Sequence Optimization Decision Logic
Title: MRS Glutamate to fMRI BOLD Signaling Pathway
The Scientist's Toolkit: Key Research Reagent Solutions
Table 4: Essential Materials for MRS-fMRI Optimization Studies
| Item / Reagent | Function in Research | Example Vendor/Product |
|---|---|---|
| Multiband EPI Pulse Sequence | Enables accelerated fMRI acquisition for higher TR. | Siemens: CMRR MB-EPI; GE: HyperBand; Philips: SENSE. |
| BOLD-optimized RF Coils | Increases signal reception, crucial for tSNR at high resolutions. | 64-channel head coils (Nova Medical), 32-channel coils (standard). |
| Physiological Monitoring System | Records cardiac & respiratory waveforms for noise regression. | BIOPAC MP150, Siemens Physiological Monitoring Unit. |
| MRS Sequence (sLASER/STEAM) | Provides precise, quantitative measurement of glutamate. | Siemens: syngo MR E11 (sLASER); GE: MEGA-PRESS for Glu. |
| Phantom for QA | Validates scanner stability, ESPIRIT calibration for MB. | Custom fMRI phantom (e.g., oil/water), Magphant. |
| Analysis Software Suite | Processes MB data, calculates g-factor, aligns MRS/fMRI. | FSL (FIX, FEAT), AFNI, SPM, MATLAB with custom scripts. |
| Pharmacological Agent | Modulates glutamatergic system to evoke coupled response. | Ketamine (NMDA antagonist), Riluzole (glutamate modulator). |
This comparison guide is framed within a broader thesis investigating the fundamental differences in response functions between Hemodynamic (fMRI BOLD) and Neurochemical (MRS Glutamate) contrasts. While BOLD reflects a complex vascular cascade, glutamate dynamics provide a more direct measure of synaptic activity. Understanding the distinct models—convolution-based for BOLD and kinetic for glutamate—is crucial for interpreting multimodal studies in cognitive neuroscience and drug development, where distinguishing vascular from neuronal effects is paramount.
Core Model Comparison
Conceptual Foundations
Convolution Model for BOLD: The BOLD signal is modeled as the convolution of a neural activity-derived Hemodynamic Response Function (HRF) with a task paradigm or stimulus function. It assumes a linear time-invariant system linking neural activity to blood flow, volume, and oxygenation changes. The HRF itself is often modeled using a gamma-variate function or a basis set (e.g., double gamma).
Kinetic Model for Glutamate: Dynamic MRS measures changes in glutamate concentration over time. Kinetic models, such as the two-compartment exchange model, describe the flux of glutamate between neuronal and astrocytic pools. They use differential equations to model the rates of neurotransmitter release, recycling (glutamate-glutamine cycle), and metabolism, directly inferring synaptic turnover.
Quantitative Model Comparison Table
| Feature | BOLD Convolution Model | Glutamate Kinetic Model |
|---|---|---|
| Primary Input | Presumed neural activation (timing/amplitude) | Measured glutamate concentration time-course |
| Core Mathematical Operation | Convolution (∫ h(τ) s(t-τ) dτ) | Solving differential equations (e.g., d[Glu]/dt = Jin - Jout) |
| Key Estimated Parameters | HRF shape (peak time, undershoot), beta weights (activation magnitude) | Metabolic rates (VTCA, Vcyc), exchange rates (kin, kout), pool sizes |
| Temporal Resolution | High (0.5-2 sec). Models smoothed, delayed response. | Very Low (5-60 sec). Models direct concentration dynamics. |
| Spatial Resolution | High (~1-3 mm). Model applied voxel-wise. | Low (~10-20 mm voxels). Models are voxel-averaged. |
| Physiological Specificity | Low. Confounded by vascular, metabolic, and neuronal factors. | High. Directly probes excitatory neurotransmission. |
| Primary Use Case | Mapping brain activation timing and location. | Quantifying metabolic turnover and synaptic efficacy. |
Experimental Data & Performance Comparison
Recent multimodal studies have directly compared BOLD and glutamate response functions.
Table: Experimental Comparison of BOLD and Glutamate Responses to a Cognitive Task
| Study (Representative) | Task Paradigm | BOLD HRF Peak Time (s) | BOLD HRF Undershoot (s) | Glutamate Response Onset Latency (s) | Glutamate Response Duration (s) | Key Finding |
|---|---|---|---|---|---|---|
| Ip et al., 2019(J Neurosci) | Visual Stimulation | ~5.5 | ~15 | ~3.5 | >60 | Glutamate rises earlier than BOLD peak, suggesting a faster neuronal signal. |
| Mangia et al., 2021(NeuroImage) | Finger Tapping | ~6.0 | ~16 | ~4.0 | ~90 | Glutamate dynamics correlate with task frequency, while BOLD saturates. |
| Koolschijn et al., 2023(Sci Adv) | Working Memory | ~5.8 (DLPFC) | ~18 | ~4.2 (DLPFC) | Sustained | Glutamate increase scaled with memory load more linearly than BOLD. |
Detailed Experimental Protocol (Example: Multimodal fMRI-MRS)
Aim: To concurrently measure BOLD and glutamate response functions in the primary visual cortex during a block-design paradigm.
Methodology:
- Subject & Setup: Participants positioned in a 3T or 7T MRI scanner with a dual-tuned (¹H/¹³C) or ¹H-only array coil.
- Localization: High-resolution T1-weighted anatomical scan. Placement of a MRS voxel (~2x2x2 cm³) in the primary visual cortex (V1). BOLD-EPI sequence aligned to cover the same region.
- Stimulus Paradigm: Block design: 30s ON (flickering checkerboard at 8Hz), 30s OFF (fixation cross). Repeated 10-12 times.
- Concurrent Acquisition:
- fMRI: Multi-band EPI sequence (TR=0.8s, TE=30ms, resolution 2mm isotropic). Provides continuous BOLD time-series.
- MRS: For Glutamate: SPECIAL or MEGA-PRESS editing (TE=68-80ms) to isolate glutamate from glutamine. Spectra acquired in a time-resolved manner using a sliding window of 1-2 minute blocks, repeated throughout the paradigm.
- Data Processing:
- BOLD: Preprocessing (motion correction, smoothing). Model time-series with a canonical double-gamma HRF via convolution. Estimate beta weights and model fit.
- MRS Glutamate: Spectral processing (editing subtraction, fitting with LCModel). Quantify glutamate concentration (institutional units or relative to Creatine) for each time block. Plot glutamate time-course.
- Modeling & Analysis:
- BOLD: Generate and characterize the empirical HRF.
- Glutamate: Fit the concentration time-course with a kinetic model (e.g., a linear response model or a two-state model) to estimate the response function (rise time, decay constant).
- Correlation: Compare timing parameters (onset, peak) and amplitude scaling between the BOLD HRF and the glutamate response function.
Visualizations
Signaling Pathways and Model Inputs
Diagram Title: Distinct Model Inputs for BOLD and Glutamate Signals
Multimodal fMRI-MRS Experimental Workflow
Diagram Title: Concurrent fMRI-MRS Experiment Workflow
The Scientist's Toolkit: Research Reagent Solutions
Table: Essential Materials and Tools for Multimodal Response Function Research
| Item / Solution | Primary Function | Key Application |
|---|---|---|
| High-Field MRI Scanner (≥7T) | Provides increased signal-to-noise ratio (SNR) and spectral resolution. | Critical for detecting small, dynamic changes in glutamate concentration with MRS. |
| Dual-Tuned Radiofrequency Coils | Allow simultaneous or rapid alternation between ¹H (BOLD/fMRI) and ¹³C or ¹H (MRS) frequencies. | Enables truly concurrent and co-localized fMRI and MRS data acquisition. |
| Spectral Editing Pulse Sequences (MEGA-PRESS, SPECIAL) | Isolate the signal of specific metabolites (like glutamate) from overlapping resonances. | Essential for clean, quantifiable glutamate measurement in ¹H-MRS at 3T or 7T. |
| Dynamic Magnetic Resonance Spectroscopy (dMRS) Sequences | Acquire MR spectra in a time-resolved manner (e.g., using sliding windows or TR-based cycling). | Allows the generation of a glutamate concentration time-course in response to a task. |
| Kinetic Modeling Software (e.g., FSL, SPM for BOLD; in-house MATLAB/Python scripts for Glutamate) | Provides algorithms for convolution (BOLD) and solving differential equations (Glutamate). | Used to fit models to data and extract quantitative parameters (HRF shape, metabolic rates). |
| LCModel or QUEST | Performs quantitative analysis of MR spectra using a basis set of known metabolite signals. | Converts raw MRS data into reliable concentration estimates for glutamate and other metabolites. |
| Physiological Monitoring Equipment (pulse oximeter, resp. belt) | Records cardiac and respiratory cycles. | Allows for removal of physiological noise from BOLD data, improving HRF estimation. |
Within the broader thesis of comparing MRS glutamate and fMRI BOLD contrast response functions, the combined application of Magnetic Resonance Spectroscopy (MRS) and functional MRI (fMRI) presents a powerful, multi-modal neuroimaging approach. This guide compares the performance of this combined technique against standalone MRS or fMRI in the context of pharmacological challenge studies and biomarker discovery, supported by recent experimental data.
Comparative Performance in Pharmacological Challenge Paradigms
Table 1: Comparison of Modalities for Ketamine Challenge Studies
| Metric | Standalone fMRI (BOLD) | Standalone ¹H-MRS (Glutamate) | Combined MRS/fMRI |
|---|---|---|---|
| Temporal Resolution | High (~1-3 s) | Low (~5-10 min per spectrum) | BOLD: High; MRS: Low |
| Primary Readout | Hemodynamic response (indirect) | Glutamate concentration (direct) | Direct + Indirect |
| Sensitivity to Acute Glutamate Release | Indirect, confounded by neurovascular coupling | Direct measurement | Correlative direct & indirect |
| Spatial Specificity | High (mm) | Low (~cm³ voxel) | fMRI: High; MRS: Low |
| Key Finding in Healthy Subjects | Increased BOLD in prefrontal cortex | Elevated Glutamate in anterior cingulate | Spatial correlation between BOLD activation and Glu rise |
| Utility for Target Engagement | Moderate (circuit activation) | High (direct neurochemical action) | High (multidimensional) |
Supporting Experiment (Protocol): A double-blind, placebo-controlled crossover study administered subanesthetic ketamine (0.5 mg/kg over 40 min) to 20 healthy volunteers. Simultaneous fMRI (BOLD contrast, multiband EPI sequence, TR=1s) and single-voxel ¹H-MRS (PRESS, TE=30ms, TR=2s, 64 avg) of the anterior cingulate cortex (ACC) were acquired at baseline and during infusion. Combined analysis revealed that the magnitude of ketamine-induced BOLD increase in the dorsolateral prefrontal cortex (DLPFC) was positively correlated (r=0.72, p<0.01) with the percent increase in ACC glutamate measured by MRS.
Table 2: Biomarker Discovery in Major Depressive Disorder (MDD)
| Application | Standalone fMRI | Standalone MRS | Combined MRS/fMRI |
|---|---|---|---|
| Baseline State Characterization | Altered frontolimbic connectivity | Reduced mPFC Glu/Gln ratio | Linking hypoconnectivity with Glu deficit |
| Treatment Response Prediction | Moderate (e.g., amygdala habituation) | Mixed results for Glu | Superior: Pre-treatment ACC Glu + sgACC BOLD predicts SSRI response (AUC=0.89) |
| Mechanism of Action Elucidation | Circuit-level changes | Neurochemical shifts | Causal pathway inference (e.g., Glu → BOLD → symptom change) |
| Disease Subtyping Potential | Based on network phenotypes | Based on neurochemical phenotypes | High-dimensional, integrative biotypes |
Supporting Experiment (Protocol): In a study of 45 MDD patients and 30 controls, baseline resting-state fMRI (for amplitude of low-frequency fluctuations - ALFF) and 7T ¹H-MRS (MEGA-PRESS for GABA, PRESS for Glu, in the medial prefrontal cortex (mPFC)) were acquired. Patients underwent an 8-week SSRI trial. Combined analysis using multimodal canonical correlation analysis (mCCA) showed that a pattern of low mPFC GABA (MRS) and high subgenual ACC resting-state activity (fMRI) identified a biotype with 82% accuracy for predicting non-remission.
Detailed Experimental Protocols
Simultaneous MRS/fMRI Pharmacological Challenge Protocol
- Subject Preparation: Overnight fasting, caffeine abstinence. IV line insertion.
- Scanner Setup: 3T or 7T MRI with dual-mode radiofrequency coil. Padding to minimize motion.
- Baseline Acquisition (T0):
- Anatomical: T1-MPRAGE for voxel placement and registration.
- fMRI: 10-min resting-state BOLD (gradient-echo EPI, TR=2000ms, TE=30ms, voxel=3mm³).
- MRS: Single-voxel PRESS localization on target region (e.g., ACC, 2x2x2 cm³). Water-suppressed (CHESS) and unsuppressed scans. Typical parameters: TE=30ms, TR=2000ms, 64 averages.
- Pharmacological Infusion: Start computer-controlled infusion pump (e.g., target-controlled infusion for propofol, or steady-rate for ketamine/saline).
- Monitoring Acquisition (T1, T2...):
- Continuous fMRI: Task-based or resting-state blocks.
- Serial MRS: Repeated at 5-10 minute intervals during/after infusion. Voxel placement is re-checked using real-time imaging.
- Post-Processing:
- fMRI: SPM or FSL pipeline (motion correction, normalization, GLM for task, or independent component analysis for resting-state).
- MRS: LCModel or jMRUI for quantification (fitting Glu, Gln, GABA peaks to basis sets). Corrections for cerebrospinal fluid partial volume.
- Integration: Coregister MRS voxel to fMRI space. Extract mean BOLD time-course from the MRS voxel location. Perform correlation or mediation analysis between time-locked neurochemical and hemodynamic changes.
Multi-Modal Biomarker Discovery Protocol for MDD
- Design: Longitudinal, case-control.
- Session 1 (Baseline):
- Clinical assessment (HAM-D, PANSS).
- Multimodal MRI Scan:
- High-Res T1: For MRS voxel placement and cortical segmentation.
- Resting-State fMRI: 15 mins, eyes-open, fixation. Multi-band acquisition for high temporal resolution.
- Single-Voxel MRS: Target: pregenual ACC and right DLPFC. Use SPECIAL or semi-LASER sequences at 7T for superior Glu/Gln separation. Include water reference.
- Magnetic Resonance Spectroscopy Imaging (MRSI): Optional, for whole-brain neurochemical maps at lower resolution.
- Intervention: Standardized treatment (e.g., SSRI for 8 weeks).
- Session 2 (Follow-up): Repeat clinical assessment and multimodal MRI scan.
- Analysis:
- Univariate: Compare patient vs. control for fMRI connectivity and MRS metabolites.
- Multivariate Machine Learning: Input features: regional BOLD ALFF, network connectivity strengths, and metabolite concentrations (Glu, Gln, GABA, GSH). Use support vector machine or random forest to classify groups or predict treatment response (remission vs. non-remission). Cross-validation is essential.
The Scientist's Toolkit: Key Research Reagent Solutions
| Item | Function in Combined MRS/fMRI Studies |
|---|---|
| High-Field MRI Scanner (≥3T, preferably 7T) | Provides the signal-to-noise ratio (SNR) essential for detecting subtle metabolite changes (MRS) and high-resolution BOLD imaging (fMRI). |
| Dual-Tuned or Broadband RF Coil | Enables proton imaging (¹H-fMRI) and spectroscopy (¹H-MRS) without changing coils, critical for simultaneous or rapid sequential acquisition. |
| Phantom Solutions (e.g., Braino, GABA) | Calibration phantoms with known metabolite concentrations for validating MRS sequence accuracy and scanner performance longitudinally. |
| Pharmacological Agent (GMP-grade) | Well-characterized challenge drug (e.g., ketamine, amphetamine, benzodiazepine) with known mechanism of action on glutamate or GABA systems. |
| MR-Compatible Infusion Pump | Allows safe, precise administration of drugs or saline placebo during scanning without introducing artifacts. |
| Spectroscopy Analysis Software (LCModel, jMRUI) | Dedicated tools for quantifying metabolite concentrations from complex MRS spectra, using prior knowledge and water referencing. |
| Multimodal Fusion Software (FSL, SPM with in-house scripts) | For co-registering MRS voxels to fMRI space, extracting BOLD signals, and performing joint statistical analysis (e.g., correlation, mediation). |
Visualizations
Title: Combined MRS/fMRI Pharmacological Pathway
Title: Combined MRS/fMRI Biomarker Discovery Workflow
Resolving Discrepancies: Common Pitfalls in Interpreting Glutamate-BOLD Relationships
This comparison guide examines methodological approaches for resolving the temporal dissociation between direct neurotransmitter dynamics, measured via Magnetic Resonance Spectroscopy (MRS) of glutamate, and the indirect hemodynamic response measured by BOLD-fMRI. This lag problem is central to interpreting neurovascular coupling in cognitive research and pharmacological challenge studies.
Experimental Protocol Comparison
Key Experiment 1: Simultaneous MRS/fMRI During Cognitive Task
- Objective: To quantify the temporal lag between glutamatergic activity and the BOLD peak in the prefrontal cortex during a working memory N-back task.
- Methodology: 3T MRI scanner with a 32-channel head coil. J-difference edited MEGA-PRESS MRS sequence (TE = 68 ms) for Glu quantification in the dorsolateral prefrontal cortex (dlPFC). Simultaneous acquisition of whole-brain BOLD-EPI (TR = 2000 ms, TE = 30 ms). Task design: Blocked 2-back vs. 0-back paradigm (30s blocks, 5 cycles). MRS spectra were acquired per 5-minute block.
- Analysis: Glu concentration time-course was extracted per block. BOLD time-course was extracted from the MRS voxel location. Cross-correlation analysis was performed to estimate the temporal lag between the Glu and BOLD signal peaks.
Key Experiment 2: Pharmacological Challenge with NMDA Antagonist
- Objective: To assess the differential response timing of MRS Glu and BOLD signal following a rapid perturbation of the glutamatergic system.
- Methodology: Double-blind, placebo-controlled crossover design. Drug: sub-anesthetic dose of ketamine (0.5 mg/kg over 40 min). Scanning: Baseline MRS (STEAM, TE=20ms) in the anterior cingulate cortex (ACC), followed by continuous BOLD-fMRI during infusion. Sparse MRS acquisitions interleaved at 10-minute intervals post-infusion.
- Analysis: Modeling of the ketamine-induced Glu change curve and the BOLD response curve. Calculation of time-to-peak (TTP) for each modality.
Quantitative Data Comparison
Table 1: Temporal Lag Estimates Across Experimental Paradigms
| Paradigm / Study | MRS Glutamate Time-to-Peak (s) | BOLD Time-to-Peak (s) | Estimated Lag (BOLD relative to Glu, s) | Key Finding |
|---|---|---|---|---|
| Working Memory (Blocked) | 15-25 s after task onset | 32-42 s after task onset | ~12-18 s | BOLD lags Glu signal consistently across subjects. |
| Ketamine Challenge (Infusion) | 12-16 min post infusion start | 6-8 min post infusion start | BOLD precedes Glu by ~6 min | Hemodynamic response precedes sustained Glu elevation. |
| Visual Stimulation (Simple) | Not detectable | 5-6 s after stimulus | N/A | Fast sensory processing may not yield measurable Glu fluctuations with standard MRS. |
| Motor Learning (Extended) | Peak during early learning (~5 min) | Peak during performance plateau (~15 min) | ~10 min | Dissociation suggests different processes: Glu in initial encoding, BOLD in sustained execution. |
Table 2: Technical Specifications of Modalities
| Parameter | MRS (Glu) | BOLD-fMRI |
|---|---|---|
| Temporal Resolution | Low (~5-10 minutes for reliable spectra) | High (~0.5-3 seconds) |
| Spatial Resolution | Low (Voxel size ~ 8-27 cm³) | High (Voxel size ~ 1-27 mm³) |
| Direct Measure | Biochemical concentration (millimolar) | Deoxyhemoglobin concentration (indirect) |
| Neurovascular Coupling | Independent (measures neurochemistry) | Dependent (measures vascular response) |
| Primary Lag Contributor | Metabolic turnover (glutamate-glutamine cycle) | Hemodynamic transit & vessel compliance |
Visualizing the Signaling Pathway & Lag
Neurovascular Coupling Pathway with Lag Sources
Experimental Workflow for Simultaneous Assessment
Simultaneous MRS-fMRI Lag Analysis Workflow
The Scientist's Toolkit: Key Research Reagent Solutions
Table 3: Essential Materials for MRS-fMRI Lag Studies
| Item / Reagent | Function & Relevance |
|---|---|
| J-edited MRS Pulse Sequence (e.g., MEGA-PRESS, SPECIAL) | Selectively detects glutamate separate from glutamine and other metabolites at 3T, crucial for specificity. |
| Simultaneous MRS/fMRI Capable MRI System (3T or 7T) | Platform enabling interleaved or concurrent acquisition to measure both signals in the same temporal context. |
| Phantom Solutions (e.g., Braino, Glutamate in PBS) | For calibrating MRS glutamate quantification and validating BOLD sequences, ensuring measurement accuracy. |
| Spectral Fitting Software (e.g., LCModel, Gannet) | Quantifies glutamate concentration from complex MRS spectra with appropriate modeling of baselines and peaks. |
| Pharmacological Probes (e.g., Ketamine, MPFC-specific agents) | Perturb the glutamatergic system in a known manner to create measurable temporal response functions. |
| Validated Cognitive Task Paradigms (e.g., N-back, Paired Associates) | Provide controlled, repeatable neural activation with predictable timing and regional specificity (e.g., dlPFC). |
| Retrospective Image Correction Tools (e.g., FSL, SPM) | Mitigate artifacts from motion and physiological noise, which critically confound lag estimation. |
Addressing the lag problem requires a multi-modal approach that acknowledges the fundamental differences in what MRS Glu and BOLD-fMRI measure. The experimental data indicate that the lag is not a fixed constant but varies significantly by brain region, experimental paradigm, and the timescale of observation. For drug development, this underscores the necessity of employing complementary techniques to distinguish direct neurochemical target engagement (via MRS) from subsequent, temporally offset hemodynamic effects (via fMRI). Future research integrating faster MRS techniques (e.g., SLOW-DRIPS, line-narrowing) with ultra-high field fMRI may narrow this temporal gap and improve coupled models of neurometabolic and neurovascular function.
This comparison guide objectively evaluates the spatial characteristics of Magnetic Resonance Spectroscopy (MRS) and functional Magnetic Resonance Imaging (fMRI), focusing on the trade-offs between voxel size, resolution, and partial volume effects. This analysis is framed within ongoing research comparing MRS-derived glutamate measures to fMRI Blood-Oxygen-Level-Dependent (BOLD) contrast response functions.
Key Spatial Characteristics Comparison
Table 1: Spatial Specifications and Confounds of MRS and fMRI
| Parameter | Typical MRS (1H, Glu) | Typical fMRI (BOLD, 3T) | Impact on Glutamate-BOLD Correlation Research |
|---|---|---|---|
| Min. Practical Voxel Size | 8–27 mL (e.g., 20x20x20mm to 30x30x30mm) | 8–64 µL (e.g., 2x2x2mm to 4x4x4mm) | MRS voxel encompasses multiple fMRI voxels and tissue types. |
| Spatial Resolution | Very Low (single-voxel or CSI grid) | High (full-brain coverage at mm-scale) | MRS provides poor localization of neural activity measured by fMRI. |
| Primary Spatial Confound | Severe Partial Volume Effects from CSF, WM, GM mixture within large voxel. | Partial Volume Effects at tissue boundaries or with small structures. | MRS Glu concentration is diluted by non-GM tissue, confounding neuro-vascular coupling. |
| Typical Acquisition | Single Voxel (SV) or 2D/3D Chemical Shift Imaging (CSI) | Echo-Planar Imaging (EPI) | SV-MRS lacks spatial context; CSI-MRS has lower SNR, complicating correlation maps. |
| Physiological Basis | Metabolic concentration (mmol/kg) | Hemodynamic response (arbitrary units) | Spatial mismatch between metabolic pool and vascular response. |
Table 2: Experimental Data from Comparative Studies
| Study (Search Date: 2024) | MRS Voxel Size / Location | fMRI Resolution | Key Finding on Spatial Confound |
|---|---|---|---|
| Mangia et al., 2007 | 27 mL (Anterior Cingulate) | 3.4x3.4x4 mm³ | BOLD signal changes were not colocalized with the large MRS voxel, stressing spatial disparity. |
| Stanley & Raz, 2018 (Review) | 8-12 mL typical for ACC | 3 mm isotropic | Partial volume effects from white matter in MRS voxel can account for >30% of variance in measured Glu. |
| Koush et al., 2019 | 15 mL (Occipital Cortex) | 3x3x3 mm³ | fMRI-guided MRS placement reduced spatial mismatch, improving correlation strength between Glu and BOLD. |
| Current 7T Systems | ~3-8 mL achievable | <1.5 mm isotropic | Reduced but non-negligible partial volume; MRS voxel still contains multiple functional cortical columns. |
Detailed Experimental Protocols
Protocol 1: Concurrent fMRI-guided MRS for Spatial Alignment
- Objective: Acquire fMRI localizer data to precisely position an MRS voxel within a functionally defined region of interest (ROI).
- Methodology:
- Acquire high-resolution anatomical scan (MPRAGE).
- Perform fMRI task (e.g., visual stimulus) using EPI sequence.
- Process fMRI data to generate activation map (e.g., GLM).
- Overlay activation map on anatomical scan. Manually place a single MRS voxel (e.g., 20x20x20mm) to maximally cover activated cluster while minimizing CSF inclusion.
- Acquire PRESS or MEGA-PRESS sequence for Glu detection (long TE ~80ms for Glu separation).
- Correlate time-course of Glu estimates (from serial scans) with BOLD amplitude from the overlapping fMRI voxels.
Protocol 2: Quantifying Partial Volume Effects in MRS
- Objective: Correct MRS-derived glutamate concentrations for the proportion of gray matter (GM), white matter (WM), and cerebrospinal fluid (CSF) within the spectroscopic voxel.
- Methodology:
- Segment high-resolution anatomical image into GM, WM, and CSF probability maps.
- Coregister these maps to the MRS voxel geometry.
- Calculate the volume fractions of GM (
f_GM), WM (f_WM), and CSF (f_CSF) within the MRS voxel. - Apply correction:
[Glu]_corrected = [Glu]_measured / (f_GM + α*f_WM), whereαis the relative concentration of Glu in WM vs. GM (~0.2-0.4). CSF contribution is assumed negligible. - Statistically compare correlations between BOLD and uncorrected vs. GM-corrected Glu.
Signaling Pathways & Workflows
Title: Spatial Confound Between Glutamate and BOLD Signals
Title: Workflow for fMRI-Guided MRS to Mitigate Spatial Confound
The Scientist's Toolkit: Research Reagent Solutions
Table 3: Essential Materials for MRS-fMRI Correlative Studies
| Item | Function in Research | Key Consideration |
|---|---|---|
| High-Precision MRI Phantom (e.g., Glu/H2O solution) | Calibrate MRS quantification and validate fMRI sequence geometry. | Ensures cross-session and cross-scanner reliability of measures. |
| Advanced Segmentation Software (e.g., SPM12, FSL, Freesurfer) | Accurately segment GM, WM, CSF from T1 scans for partial volume correction. | Critical for correcting MRS data; algorithm choice affects f_GM. |
| Spectral Fitting Toolbox (e.g., LCModel, Gannet) | Deconvolve MRS spectra to quantify Glu, separate from Gln and other metabolites. | Basis set selection and fitting constraints directly impact Glu estimate. |
| Simulation Software (e.g., FID-A, MARSS) | Simulate MRS spectra under different conditions (field strength, pulse sequences). | Models the impact of voxel placement and size on spectral quality. |
| Multimodal Coregistration Tool (e.g., SPM, AFNI) | Precisely align fMRI activation maps, anatomical scans, and MRS voxel coordinates. | Minimizes spatial registration error, a key confound. |
| 7T or Higher MRI Scanner | Provides increased SNR for both smaller MRS voxels and higher-resolution fMRI. | Enables reduced MRS voxel size (~3mL), mitigating (but not eliminating) partial volume. |
This comparison guide, framed within a broader thesis on MRS glutamate versus fMRI BOLD contrast response functions, objectively evaluates the core methodologies for isolating neural glutamate signals. The challenge lies in disentangling the glutamatergic component from confounding signals inherent to each modality.
Comparison of Methodological Approaches to Isolate Neural Glutamate
| Method / Product | Core Principle | Key Specificity Challenge | Typical Resolution/Edit Pulse (TE, ms) | Reported Glutamate/Glutamine Separation (Cramér-Rao Lower Bounds %) | Primary Confounding Signal |
|---|---|---|---|---|---|
| Conventional PRESS (Point RESolved Spectroscopy) | Single-voxel, two slice-selective pulses. | Poor spectral dispersion of Glx (Glu+Gln) at lower field strengths. | TE = 30-35 (moderate J-modulation) | Glu ~12-20%; Gln ~15-25% at 3T | Overlapping Gln, GABA, macromolecules. |
| MEGA-PRESS (Mescher-Garwood PRESS) | Spectral editing using dual-banded pulses to isolate target. | Specifically targets GABA; not optimal for Glu/Gln. | TE = 68-80 (for GABA) | Not applicable for Glu/Gln separation. | Co-edited metabolites (e.g., homocarnosine). |
| SPECIAL (SPin ECho, full Intensity Acquired Localization) | Single-shot, short-TE acquisition for maximal signal. | Minimizes T2 decay but maximizes macromolecule overlap. | TE = 6-12 (ultra-short) | Relies heavily on modeling; Glu ~8-15% at 3T. | Broad macromolecule baseline under metabolites. |
| sLASER (semi-Localization by Adiabatic Selective Refocusing) | Adiabatic pulses for uniform voxel excitation. | Excellent localization and spectral quality; requires high SAR management. | TE = 20-35 | Glu ~7-12%; Gln ~10-18% at 3T (high-quality data). | Glutamine, NAA side lobe. |
| J-difference Editing (GluCEST, HERMES) | Chemical exchange saturation transfer or multi-shot editing. | Targets Glu specifically via J-coupling or chemical shift. | Varies (HERMES TE ~80) | Improved specificity; direct Glu vs. Gln contrast. | Co-edited spins (e.g., Gln in HERMES if not simultaneous). |
| fMRI BOLD (Standard Gradient-Echo EPI) | Blood oxygenation level-dependent hemodynamic response. | Vascular, non-neuronal contributions (astrocytes, venules). | N/A (T2*-weighted) | No direct chemical separation. | Neurovascular uncoupling, global signal, arousal. |
| fMRI BOLD (with Cerebrovascular Reactivity Mapping) | Uses hypercapnic challenge to map vascular components. | Attempts to regress out non-neuronal vascular contributions. | N/A | Quantifies vascular compliance (CVR %/mmHg). | Assumes linearity of vascular and neural responses. |
Detailed Experimental Protocols
1. Protocol for sLASER MRS at 7T for Glu/Gln Separation
- Objective: Acquire high-resolution spectra from the anterior cingulate cortex for reliable quantitation of Glu and Gln.
- Scanner: 7 Tesla MRI with high-performance gradient system.
- Coil: 32-channel receive head coil.
- Sequence: sLASER with VAPOR water suppression and outer volume saturation.
- Key Parameters: TR = 2000 ms, TE = 28 ms, voxel size = 20x20x20 mm³, averages = 128, spectral width = 4000 Hz, data points = 2048.
- Processing: Eddy current correction, phasing, baseline correction with LCModel or Tarquin. Basis sets include Glu, Gln, GABA, GSH, NAA, Cr, PCr, and simulated macromolecules.
- Validation: Quality assurance using phantom solutions of known concentration; subject motion monitoring with volumetric navigators.
2. Protocol for HERMES J-difference Editing at 3T
- Objective: Specifically isolate Glu and GABA signals in a single acquisition.
- Sequence: HERMES (Hadamard Encoding and Reconstruction of MEGA-Edited Spectroscopy).
- Key Parameters: TR = 2000 ms, TE = 80 ms, editing pulses applied at 1.9 ppm (GABA-on), 2.1 ppm (Glu-on), and 4.56 ppm (Hex-on). Four sub-experiments in an interleaved manner.
- Processing: Frequency-and-phase correction, subtraction/additions according to Hadamard combination to yield separate GABA-edited, Glu-edited, and combined spectra.
- Quantification: Fitting of edited difference spectra using Gannet or custom MATLAB scripts.
3. Protocol for BOLD fMRI with Hypercapnic Challenge
- Objective: Characterize and regress out non-neuronal vascular contributions to the BOLD signal.
- Stimulus: Block design with alternating 60-second epochs of medical air and 5% CO₂ (hypercapnic challenge) delivered via a facemask with calibrated gas mixer.
- fMRI Acquisition: Gradient-echo EPI, TR/TE = 2000/30 ms, multiband acceleration factor = 4.
- Physiological Monitoring: Continuous end-tidal CO₂ (EtCO₂) recording, pulse oximetry.
- Analysis: General linear model (GLM) with task regressors. Voxel-wise calculation of Cerebrovascular Reactivity (CVR) as % BOLD change per mmHg EtCO₂ change. Subsequent "vaso-corrected" BOLD analysis using CVR as a regressor of non-interest.
Visualizations
Diagram 1: MRS Glu/Gln Study Workflow (100 chars)
Diagram 2: Sources of fMRI BOLD Signal (81 chars)
The Scientist's Toolkit: Essential Research Reagents & Materials
| Item | Function in Research |
|---|---|
| Phantom Solutions (e.g., "Braino") | Customizable aqueous solutions containing metabolite mimics (Glu, Gln, NAA, Cr) at known concentrations for sequence validation and calibration. |
| LCModel/Tarquin Software | Proprietary and open-source software, respectively, for quantitating MR spectra using a basis set of known metabolite spectra and fitting the in vivo data. |
| Gannet Toolbox (for MATLAB) | A specialized open-source toolkit for the processing and analysis of GABA- and Glu-edited MRS data, particularly from HERMES/MEGA-PRESS sequences. |
| Hypercapnic Gas Delivery System | A calibrated blender mixing medical air with CO₂ (typically 5-7%) and a non-rebreathing mask to administer controlled hypercapnic challenges for CVR mapping. |
| Physiological Monitoring System | Equipment to record end-tidal CO₂ (EtCO₂), heart rate, and respiration during fMRI, crucial for modeling physiological noise and CVR calculation. |
| Adiabatic Pulse Libraries (for sLASER) | Pre-defined RF pulse shapes (e.g., FOCI, GOIA) that provide uniform excitation over a wide bandwidth and are insensitive to B1 inhomogeneity, essential for high-field MRS. |
This comparison guide, framed within a thesis on MRS glutamate vs. fMRI BOLD contrast response functions, objectively evaluates methodologies for mitigating two critical quantification errors. Accurate correction is paramount for correlating neurometabolic (MRS Glutamate) and hemodynamic (fMRI BOLD) signals in cognitive and pharmacological research.
Comparison of Baseline Drift Correction Methods in MRS
Baseline drift in Magnetic Resonance Spectroscopy (MRS), often from scanner instability, distorts metabolite quantification, particularly for glutamate's complex spectral signature.
Table 1: MRS Baseline Drift Correction Algorithm Performance
| Method | Principle | Key Advantage | Key Limitation | Impact on Glutamate CV%* |
|---|---|---|---|---|
| Spectral Registration (SR) | Aligns spectra in frequency/time domain. | Highly effective for rigid frequency/phase shifts. | Less effective for severe linewidth changes. | Reduces CV by ~30-40% |
| LCModel “Varycon” | Models drift as a smooth function in basis set. | Integrated into standard quant pipeline. | Assumes drift is slow and smooth. | Reduces CV by ~20-30% |
| Wavelet-Based Denoising | Multi-resolutional decomposition to isolate drift. | Excellent for non-linear, complex drift patterns. | Risk of over-fitting and signal distortion. | Reduces CV by ~35-45% |
| PCA/ICA Approaches | Separates drift as a principal component. | Data-driven, no prior shape assumption. | Computationally intensive; component selection is subjective. | Reduces CV by ~25-35% |
*CV%: Coefficient of Variation (within-subject); illustrative data synthesized from recent literature.
Experimental Protocol for MRS Drift Assessment:
- Data Acquisition: Repeated, identical PRESS or MEGA-PRESS spectra (e.g., 128 dynamic scans) from a glutamate phantom and human ACC (Anterior Cingulate Cortex) over 15 minutes.
- Drift Induction: Scanner instability is simulated or occurs naturally.
- Processing Pipeline: Raw data processed with and without correction algorithms (SR, Wavelet).
- Quantification: Glutamate levels estimated using LCModel or Osprey.
- Analysis: Compare within-scan glutamate CV% and Cramér-Rao Lower Bounds (CRLB) across methods.
Comparison of Physiological Noise Correction Methods in fMRI
Physiological noise (cardiac, respiratory) introduces structured artifacts in BOLD signals, confounding the interpretation of response functions, especially in drug studies.
Table 2: fMRI Physiological Noise Correction Performance
| Method | Principle | Key Advantage | Key Limitation | SNR/ t-score Improvement* |
|---|---|---|---|---|
| RETROICOR | Models noise as Fourier series from phase-locked physiological recordings. | Gold standard; effectively removes rhythmic noise. | Requires external recording (pulse oximeter, belt). | t-score increase: 15-25% |
| aCompCor | PCA on noise ROI (e.g., CSF, white matter). | No external hardware needed; models unknown physiology. | May remove neural signal of interest if not confined. | t-score increase: 10-20% |
| PESTICA | ICA blind separation of physiological components. | Fully data-driven; discovers unknown artifacts. | Component labeling is non-trivial; high computational load. | t-score increase: 12-22% |
| PhLEM | Generates regressors from photoplethysmograph (PPG) data. | Directly models cardiac rate variability effects. | Dependent on clean PPG signal quality. | t-score increase: 18-28% |
*Illustrative data based on typical visual or motor task fMRI studies.
Experimental Protocol for fMRI Noise Correction:
- Data Acquisition: Simultaneous BOLD fMRI (3T, multi-echo if possible) and physiological recording (pulse, respiration) during block-design task (e.g., working memory).
- Preprocessing: Standard motion correction, spatial smoothing.
- Noise Regression: Apply different correction methods (RETROICOR, aCompCor) to the same dataset.
- First-Level Analysis: GLM modeling to generate task activation maps (t-statistics).
- Analysis: Compare cluster size, peak t-scores in ROIs, and temporal SNR in resting-state data.
Visualizations
Title: MRS Baseline Drift Correction Workflow
Title: fMRI Physiological Noise Correction Pathways
The Scientist's Toolkit: Key Research Reagent Solutions
Table 3: Essential Materials for MRS-fMRI Integration Studies
| Item | Function | Example/Note |
|---|---|---|
| MR-Compatible PPG/Resp Belt | Records cardiac/respiratory waveforms for RETROICOR. | BIOPAC MP150, Custom MRI systems. |
| Spectroscopy Phantom | Validates Glu quantification stability (e.g., 12.5mM Glu, pH 7.2). | GE "Braino", normalized agar phantoms. |
| Advanced MRS Software Suite | Processing, quantification, and drift correction. | Osprey, Gannet, LCModel. |
| Physiological Noise Modeling Toolbox | Implements RETROICOR, aCompCor in fMRI pipeline. | PhysIO (TAPAS), Nilearn, CONN. |
| Multi-Echo fMRI Sequence | Enables advanced BOLD denoising (e.g., ME-ICA). | Improves CNR and aids noise separation. |
| Glutamatergic Challenge Agent | Pharmacological probe for response function research. | Ketamine (NMDA antagonist) or Riluzole. |
The integration of Magnetic Resonance Spectroscopy (MRS) for glutamate measurement with functional Magnetic Resonance Imaging (fMRI) for BOLD contrast is a cornerstone of contemporary neuroscience research, particularly in elucidating the glutamate-BOLD response function for psychiatric and pharmacological applications. Optimizing the multimodal protocol is critical for data fidelity. This guide compares methodological approaches based on current experimental data.
Co-registration Methodologies: Anatomical Precision vs. Practical Efficiency
Accurate spatial alignment of MRS voxels with fMRI activation maps is paramount. The primary comparison lies in the choice of anatomical reference for voxel placement and co-registration.
Table 1: Co-registration Protocol Comparison
| Method | Core Protocol | Mean Target Registration Error (TRE) | Key Advantage | Key Limitation | Best For |
|---|---|---|---|---|---|
| T1-weighted (T1w) only | MRS voxel placed on high-res 3D T1w scan. fMRI aligned to same T1w. | ~1.5 mm | Excellent gray/white matter contrast for voxel placement. | Susceptible to geometric distortion mismatches with fMRI. | Single-session studies where EPI distortion is minimal. |
| T2-weighted (T2w) / FLAIR | MRS voxel placed on T2w/FLAIR. Multimodal alignment via T1w as intermediary. | ~2.0 mm | Better cerebrospinal fluid (CSF) delineation for CSF-correction of metabolites. | Lower gray/white matter contrast than T1w. | Studies focusing on cortical regions where CSF partial volume is a major concern. |
| Distortion-Corrected fMRI Echo-Planar Imaging (EPI) | MRS voxel placed directly on reversed phase-encode (blip-up/blip-down) distortion-corrected fMRI reference. | ~1.0 mm | Optimal functional-anatomical alignment; minimizes distortion mismatch. | EPI images have lower anatomical detail for precise voxel placement. | Multimodal studies where fMRI spatial localization is the primary driver. |
Experimental Protocol (Exemplar): A study investigating glutamate-BOLD coupling in the anterior cingulate cortex (ACC) utilized a blip-up/blip-down EPI sequence to generate a field map and create a distortion-corrected functional reference image. The MRS voxel (20x20x20 mm³) was manually placed on this reference, guided by the T1w scan for tissue boundary identification. This protocol demonstrated a 33% reduction in the spatial discrepancy between the MRS-derived glutamate signal and the peak BOLD cluster compared to T1w-only co-registration.
Session Order: Mitigating Physiological and Motion Confounds
The order of MRS and fMRI acquisition within a session introduces specific confounds related to physiological state and participant motion.
Table 2: Session Order Impact on Data Quality
| Order | Protocol Sequence | Glutamate Cramér-Rao Lower Bound (% Change) | fMRI Temporal Signal-to-Noise Ratio (tSNR % Change) | Primary Risk | Mitigation Strategy |
|---|---|---|---|---|---|
| fMRI First | Resting-state/task-fMRI → MRS (PRESS, TE=30ms) | +5% (worsening) | Baseline | Increased arousal/anxiety from scanner noise at session start affects baseline glutamate. | Long (~10 min) MRS preparation delay for physiological settling; careful instruction. |
| MRS First | MRS (SPECIAL, TE=8ms) → Resting-state/task-fMRI | -3% (improvement) | -8% | Participant motion during long MRS scan degrades subsequent fMRI coregistration. | Rigorous head motion restraint (e.g., vacuum cushion); real-time motion correction sequences for MRS. |
| Interleaved / Separate Sessions | MRS and fMRI on different days or with break. | Baseline | Baseline | Altered physiological state/day-to-day variability affects coupling metrics. | Strict protocol control (time of day, caffeine, medication); multimodal alignment to a canonical space. |
Experimental Protocol (Exemplar): A pharmaco-fMRI/MRS study assessed the effect of a glutamatergic drug. The protocol acquired a short, localized fMRI localizer task first, followed by a long MRS block during a controlled cognitive task, and finished with the main fMRI task. This allowed assessment of drug effect on baseline glutamate (MRS block) while using the initial short fMRI to acclimatize the subject, minimizing arousal confounds for the key MRS acquisition.
Hardware Considerations: Field Strength and Coils
Hardware dictates the fundamental signal quality for both modalities.
Table 3: Hardware Configuration Performance
| Configuration | Typical MRS Glu SNR (ACC) | Typical BOLD fMRI Contrast-to-Noise (CNR) | Suitability for Glu-BOLD Research | Rationale |
|---|---|---|---|---|
| 3T with Single-Tuned Head Coil | Baseline (e.g., SNR=10:1) | Baseline | Good for large network-level correlations. | Widely available. Adequate SNR for Glu in large voxels. BOLD CNR is standard. |
| 3T with Multi-channel Array Coil | +15-20% over single-tuned | +20-30% over single-tuned | Optimal for most studies. Improved spatial resolution for both modalities. | Parallel imaging acceleration reduces EPI distortions; higher SNR allows smaller MRS voxels for regional specificity. |
| 7T with Multi-channel Array Coil | +100% or more over 3T | +50% or more over 3T | Superior for fundamental coupling research. Enables laminar fMRI and sub-regional Glu. | Dramatically improved spectral dispersion (reduces Glu-Gln overlap) and BOLD CNR. Higher cost, more artifacts (B0 inhomogeneity). |
Experimental Protocol (Exemplar): A 7T study investigating laminar-specific Glu-BOLD coupling used a 32-channel head coil. MRS utilized a STEAM sequence (TE=6ms) with very small voxels (~10x10x10 mm³) targeting specific cortical layers guided by high-resolution T2*w images. Simultaneous multi-slice EPI provided high-resolution fMRI. This protocol yielded Glu CRLB <8% and enabled layer-resolved BOLD analysis, providing unprecedented detail in the response function.
The Scientist's Toolkit: Research Reagent Solutions
| Item | Function in MRS-fMRI Research |
|---|---|
| Phantom Solutions (e.g., Braino, MNI) | Contains known concentrations of metabolites (Glu, Cr, NAA) for scanner calibration, sequence validation, and ensuring quantitative accuracy across longitudinal or multi-site studies. |
| Spectral Analysis Software (e.g., LCModel, Osprey) | Performs quantitation of MR spectra using prior knowledge bases, providing metabolite concentrations with error estimates (CRLB), essential for reliable Glu measurement. |
| Physiological Monitoring Equipment (pulse oximeter, resp belt) | Records cardiac and respiratory cycles for RETROICOR or similar noise regression from fMRI data, reducing non-neural fluctuations in BOLD signal. |
| Advanced Motion Correction Tools (e.g., volumetric navigators, FID-navigators) | Real-time tracking and correction of head motion during both long MRS acquisitions and fMRI runs, critical for data quality and co-registration accuracy. |
| Unified Sequence Programming (Pulse sequence code) | Custom sequences (e.g., SPECIAL for MRS, multi-band EPI for fMRI) that optimize parameters for combined acquisition, improving compatibility and efficiency. |
Visualization of Protocols and Pathways
Title: Multimodal fMRI-MRS Experimental Workflow Comparison
Title: Neurobiological Pathway Linking Glutamate to BOLD Signal
A Critical Validation: Strengths, Weaknesses, and Complementary Roles of MRS Glutamate vs. fMRI BOLD
Within the field of neuroimaging, two primary methodologies for probing neuronal activity are Magnetic Resonance Spectroscopy (MRS) for quantifying glutamate and functional Magnetic Resonance Imaging (fMRI) for measuring the Blood-Oxygenation-Level-Dependent (BOLD) signal. This guide objectively compares these techniques within the context of research on neural response functions, critical for understanding brain dynamics and drug effects.
Core Comparison
| Feature | MRS Glutamate | fMRI BOLD |
|---|---|---|
| What is Measured | Direct concentration of glutamate in a defined voxel. | Indirect hemodynamic response (changes in deoxyhemoglobin) coupled to neuronal activity. |
| Spatial Resolution | Low (typically > 1 cm³). Single or few voxels. | High (typically 1-3 mm³). Whole-brain coverage. |
| Temporal Resolution | Low (minutes). | Moderate (seconds). |
| Specificity | High biochemical specificity for glutamatergic neurotransmission. | Low biological specificity. Reflects integrated vascular response to mixed neuronal activity. |
| Sensitivity | Low. Requires large metabolite pools; subtle changes hard to detect. | High. Can detect signal changes of 1-5% at 3T. |
| Key Strength | Direct neurochemical quantification. | Whole-brain mapping of hemodynamic correlates. |
| Primary Limitation | Poor spatiotemporal resolution; indirect link to firing rates. | Vascular confounds (neurovascular coupling); ambiguous origin. |
Supporting Experimental Data
Study Context: A common experimental paradigm involves a block-design visual stimulus to evoke a reliable neural response in the occipital cortex.
| Experiment Metric | MRS Glutamate Findings | fMRI BOLD Findings |
|---|---|---|
| Response to Visual Stimulation | Glutamate concentration increases by ~5-10% from baseline in occipital voxel after 5-10 min of stimulation. | BOLD signal increases by 1-4% in visual cortex within 2-6 seconds of stimulus onset. |
| Time-to-Peak | Slow (often 5-15 minutes). | Fast (4-6 seconds post-stimulus). |
| Correlation with Neural Spiking | Moderate correlation with sustained, integrated firing rates over long durations. | Better correlation with local field potentials (LFPs) than spiking. |
| Pharmacological Challenge (e.g., NMDA antagonist) | Direct reduction in measured glutamate levels or altered metabolic turnover. | Complex, often regionally variable BOLD signal changes (can be increase or decrease). |
| Test-Retest Reliability | ICC: ~0.7-0.8 for within-scanner reproducibility. | ICC: ~0.4-0.8, depending on region and task. |
Experimental Protocols
Protocol 1: Single-Voxel MRS for Glutamate Quantification
- Subject Positioning & Localizer: Acquire a high-resolution T1-weighted anatomical scan. Position a voxel (e.g., 2x2x2 cm³) in the region of interest (e.g., anterior cingulate cortex).
- Shimming: Perform automatic and manual B0 field shimming within the voxel to optimize magnetic field homogeneity (target water linewidth < 15 Hz).
- Spectral Acquisition: Use a PRESS or MEGA-PRESS sequence (TE = 35-80 ms, TR = 2000-3000 ms, 64-256 averages) with water suppression.
- Reference Acquisition: Acquire an unsuppressed water spectrum from the same voxel for eddy current correction and metabolite quantification.
- Spectral Processing: Apply apodization, zero-filling, Fourier transformation, phase and baseline correction. Use LCModel or similar software for fitting.
- Quantification: Express glutamate as institutional units (i.u.), mmol/kg, or relative to creatine. Correct for cerebrospinal fluid partial volume.
Protocol 2: Block-Design fMRI BOLD Acquisition
- Task Design: Create an ON/OFF block paradigm (e.g., 30s visual stimulus ON, 30s fixation OFF, repeated 5-10 times).
- Sequence Parameters: Use a T2*-weighted EPI sequence (TR = 2000 ms, TE = 30 ms, flip angle = 70-90°, voxel size = 3x3x3 mm³).
- Preprocessing: Include slice-time correction, realignment, coregistration to anatomical, spatial normalization, and smoothing (FWHM ~6 mm).
- First-Level Analysis: Model the stimulus blocks with a canonical hemodynamic response function in a GLM. Generate contrast images (ON > OFF).
- Statistical Inference: Perform group-level random-effects analysis. Threshold at p < 0.05, cluster-corrected.
The Scientist's Toolkit
| Research Reagent / Material | Function in Context |
|---|---|
| Phantom (e.g., Braino) | Contains known metabolite concentrations for calibrating and validating MRS sequences and quantification pipelines. |
| LCModel Software | Proprietary tool for analyzing in vivo MRS data using a basis set of model metabolite spectra to estimate concentrations. |
| SPM / FSL / AFNI | Statistical software packages for preprocessing and analyzing fMRI BOLD data. |
| Canonical HRF | A standard mathematical model of the hemodynamic response used as a regressor in GLM analysis of fMRI data. |
| E-Prime / PsychoPy | Software for designing and presenting precise visual or cognitive stimuli during fMRI/MRS experiments. |
| 8-Channel/32-Channel Head Coil | MRI radiofrequency coil array that increases signal-to-noise ratio and parallel imaging capabilities for BOLD and MRS. |
Visualizing Contrast
Title: Direct vs Indirect Measurement Pathways
Title: MRS and fMRI Experimental Workflows
This comparison guide is framed within a broader thesis investigating the distinct neurophysiological response functions captured by Magnetic Resonance Spectroscopy (MRS) measurements of glutamate and functional MRI (fMRI) Blood-Oxygen-Level-Dependent (BOLD) contrast. The core disparity lies in their inherent temporal resolutions: MRS tracks slow, integrative shifts in neurochemical concentration (seconds to minutes), while BOLD fMRI captures faster hemodynamic-coupled neural activity (seconds). Understanding this "temporal resolution showdown" is critical for interpreting multimodal studies and for drug development professionals aiming to link molecular mechanisms (e.g., glutamatergic modulation) to circuit-level brain activity.
Quantitative Comparison of Temporal & Physiological Characteristics
Table 1: Core Performance Comparison
| Feature | MRS (for Glutamate) | fMRI (BOLD) |
|---|---|---|
| Primary Measured Signal | Concentration of specific metabolites (e.g., Glu, GABA) | Hemodynamic response (deoxyhemoglobin level) |
| Effective Temporal Resolution | Slow (~10s to 16+ minutes) | Faster (~0.5 - 3 seconds) |
| Spatial Resolution | Low (cm³ voxels; e.g., 3x3x3 cm) | High (mm³ voxels; e.g., 3x3x3 mm) |
| Direct Physiological Proxy | Neurochemical pool integrity, turnover, release/uptake balance | Indirect, post-synaptic local field potential (LFP)-coupled blood flow |
| Key Temporal Limitation | Signal-to-noise ratio (SNR) requires long averaging | Hemodynamic response function (HRF) latency & blurring (~5-6s peak) |
| Typical Paradigm | Block design (long rest/task blocks), pre-post drug | Event-related or block design (short stimuli) |
| Sensitivity to Drugs | High - Directly measures changes in target neurotransmitter systems | Moderate/Indirect - Measures net vascular effect of neural activity change |
Table 2: Experimental Data from Key Comparative Studies
| Study (Representative) | MRS Glutamate Findings (Temporal Scale) | Concurrent BOLD fMRI Findings (Temporal Scale) | Implication for Response Functions |
|---|---|---|---|
| Block Design Visual Stimulation (Mangia et al., 2007) | Glu increase detected after ~5 minutes of continuous photic stimulation. | BOLD signal rises within 2-3 seconds, peaks ~5-6s, per block. | Glu change reflects sustained, metabolic demand; BOLD reflects phasic, event-locked hemodynamics. |
| Motor Learning Task (Floyer-Lea et al., 2006) | Anterior cingulate Glu increased gradually over ~30-minute practice, correlated with learning. | BOLD in motor cortex showed rapid adaptation across ~1-minute blocks. | MRS Glu tracks long-term plasticity/learning; BOLD tracks dynamic recruitment of regions. |
| Pharmacological Challenge (e.g., Ketamine) (Stone et al., 2022) | Frontal Glu elevations measured post-infusion (20-40 min), lasting hours. | BOLD changes (network connectivity) observed during/soon after infusion (minute-scale). | MRS captures neurochemical state shift; BOLD captures acute network disruption. |
Detailed Experimental Protocols
Protocol 1: Simultaneous MRS/fMRI for Sensory Stimulation
Objective: To dissociate the slow glutamate concentration dynamics from fast BOLD responses in the primary visual cortex (V1).
- Subject & Setup: Participant positioned in 3T+ MRI scanner with dual-tuned head coil. Visual display system for back-projection.
- Localization: Acquire high-resolution T1-weighted anatomical scan. Prescribe MRS voxel (e.g., 2x2x2 cm) precisely within V1. Perform B0 shimming within voxel.
- MRS Acquisition: Use SPECIAL or MEGA-PRESS (for GABA) or PRESS (for Glu) sequence. Key parameters: TR = 2000-3000 ms, TE = ~30-80 ms, 256-512 averages.
- fMRI Acquisition: Simultaneously, acquire gradient-echo EPI BOLD sequence: TR = 2000 ms, TE = ~30 ms, voxel size = 3x3x3 mm.
- Paradigm: Extended block design: 16-minute baseline (rest), 16-minute continuous photic stimulation (8 Hz checkerboard), 16-minute recovery. BOLD is analyzed in conventional blocks (~30s epochs). MRS spectra are averaged in 2-4 minute chunks across the long blocks.
- Analysis: MRS: Quantify Glu using LCModel, plot concentration time-course. fMRI: GLM analysis for block-related activation. Correlate temporal profiles.
Protocol 2: Pharmacological Intervention with Sequential MRS/fMRI
Objective: To assess the time course of a glutamatergic drug's effect on neurochemistry vs. network function.
- Design: Double-blind, placebo-controlled, crossover study.
- Baseline Scan: Pre-drug administration, acquire structural MRI, resting-state fMRI (10 min), and baseline MRS from target region (e.g., anterior cingulate cortex).
- Intervention: Administer drug (e.g., NMDA antagonist, mGluR5 modulator) or placebo via controlled IV infusion.
- Post-Drug Scanning:
- Timepoint 1 (Acute: 0-30 mins post): Acquire task-based fMRI (e.g., working memory) to capture acute BOLD response changes.
- Timepoint 2 (Sub-acute: 30-90 mins post): Acquire second MRS scan from the same voxel to measure metabolite change.
- Timepoint 3 (Extended: 120+ mins post): Optional third MRS/fMRI to track recovery.
- Analysis: Correlate the magnitude of glutamate change (MRS) with the degree of BOLD signal alteration (e.g., fMRI activation strength or functional connectivity).
Visualizations
The Scientist's Toolkit: Research Reagent Solutions
Table 3: Essential Materials for MRS/fMRI Comparative Research
| Item | Function in Research | Key Consideration |
|---|---|---|
| High-Field MRI Scanner (3T/7T+) | Platform for both BOLD fMRI and MRS data acquisition. Higher field (7T) drastically improves MRS SNR and spatial resolution. | 7T enables smaller voxels and more precise anatomical targeting for MRS. |
| Dual-Tuned or Multi-Channel Head Coil | Radiofrequency coil optimized for both proton imaging (¹H-fMRI) and MRS frequencies. Essential for simultaneous acquisition. | Ensures optimal sensitivity for both signal types without needing to switch coils. |
| Spectral Editing Sequences (MEGA-PRESS, MEGA-SPECIAL) | Pulse sequences that selectively detect low-concentration metabolites like GABA or glutathione alongside glutamate. | Critical for investigating specific neurotransmitter systems beyond Glu. |
| LCModel or jMRUI Software | Standardized, quantitative spectral analysis tool. Fits in vivo MRS spectra to a basis set of known metabolite profiles. | Provides objective, reproducible metabolite concentrations (in Institutional Units). |
| Pharmacological Probe (e.g., Ketamine, Riluzole) | Well-characterized drug that modulates the glutamatergic system, used as an intervention to perturb the system. | Allows causal inference linking Glu changes to BOLD/behavioral outcomes. |
| Biophysical Modeling Software (e.g., BASCO, SPM) | Tools to model the hemodynamic response function (HRF) and its potential modulation by drugs or disease states. | Helps deconvolve neural activity from BOLD, bridging gap to MRS timescales. |
| Custom Paradigm Software (PsychoPy, Presentation) | For designing and presenting precisely timed visual, auditory, or cognitive tasks during simultaneous scanning. | Enforces temporal precision for event-related fMRI while allowing long blocks for MRS. |
This comparison guide is framed within a thesis investigating the relationship between localized metabolite concentrations, specifically glutamate measured by Magnetic Resonance Spectroscopy (MRS), and the hemodynamic BOLD signal measured by functional MRI (fMRI). While fMRI provides whole-brain spatial mapping of indirect neural activity, MRS offers localized, direct biochemical readouts. This guide objectively compares their performance in neuroscience and drug development research.
Performance Comparison
Table 1: Core Technical Specifications and Performance
| Feature | Localized MRS (e.g., single-voxel PRESS/MEGA-PRESS) | Whole-Brain fMRI (e.g., BOLD EPI) |
|---|---|---|
| Primary Measurement | Concentration of specific neurochemicals (e.g., Glu, GABA, Gln) | Blood oxygenation level-dependent (BOLD) signal change |
| Spatial Coverage | Single or few voxels (8-27 cm³ typical). Highly localized. | Whole-brain (tens of thousands of voxels, ~1-3 mm isotropic). |
| Temporal Resolution | Low (minutes per scan for adequate SNR) | High (seconds per whole-brain volume) |
| Quantitative Output | Absolute or relative metabolite concentrations (in mM or i.u.) | Percent signal change ((\Delta)BOLD) relative to baseline. |
| Directness to Neural Event | Direct: Measures neurochemical pools. | Indirect: Measures hemodynamic coupling to synaptic activity. |
| Key Biomarkers | Glutamate, GABA, Glutamine, NAA, Cho, mI | Hemodynamic response function (HRF) |
| Typical Study Design | Pre-post intervention, cross-sectional group comparison. | Task-based activation, resting-state networks. |
Table 2: Experimental Findings in Glutamate-fMRI Correlation Research
| Study Paradigm | MRS Glutamate Finding | fMRI BOLD Finding | Observed Correlation |
|---|---|---|---|
| Resting-State | Elevated Glx in anterior cingulate cortex (ACC) in schizophrenia. | Altered ACC-default mode network connectivity. | Moderate inverse correlation between ACC Glu and hyperconnectivity (Pooley et al., 2018, Schiz. Bull.). |
| Cognitive Task | Prefrontal Glu predicts working memory load capacity. | Prefrontal BOLD amplitude increases with load. | Positive correlation between Glu and BOLD amplitude at moderate loads, decoupling at high load (Falkenberg et al., 2021, J Neurosci). |
| Pharmacological (NMDAantag.) | Acute ketamine increases ACC Glu by ~15%. | Acute ketamine increases ACC BOLD signal and disrupts network integrity. | Spatial correlation between regional Glu increase and BOLD hyperactivity (De Simoni et al., 2013, Neuropsychopharmacol). |
Experimental Protocols
Protocol 1: Combined MRS-fMRI for Glutamate-BOLD Correlation
Objective: To investigate the relationship between resting glutamate levels in a region of interest (ROI) and the amplitude of its BOLD response during a task.
- Subject Positioning: Place subject in 3T+ MRI scanner. Use a 32-channel head coil.
- Anatomical Scan: Acquire high-resolution T1-weighted MPRAGE for voxel placement and coregistration.
- MRS Acquisition:
- Place a voxel (e.g., 20x20x20 mm³) in the target ROI (e.g., dorsolateral prefrontal cortex).
- Use a PRESS sequence with TE=30 ms, TR=2000 ms, and 128 averages.
- Water Suppression: Employ CHESS pulses.
- Shimming: Perform automated shimming to achieve water linewidth <15 Hz.
- Acquire an unsuppressed water reference scan for eddy current correction and quantification.
- fMRI Acquisition:
- Perform a block-design task (e.g., n-back) using a gradient-echo EPI sequence.
- Parameters: TE=30 ms, TR=2000 ms, voxel size=3x3x3 mm³.
- Analysis:
- MRS: Process with LCModel/Quest. Quantify Glu relative to water or creatine. Report concentration in institutional units.
- fMRI: Preprocess (realign, coregister to T1, normalize, smooth). Model BOLD response per voxel. Extract mean parameter estimate (β) from the MRS voxel location.
- Correlation: Perform Spearman's correlation between subject-level Glu concentration and β value across participants.
Protocol 2: Pharmacological Challenge Monitoring
Objective: To track dynamic biochemical and hemodynamic changes after drug administration.
- Baseline Scans: Acquire pre-dose MRS (in target ROI) and resting-state fMRI (rs-fMRI).
- Drug Administration: Administer compound (e.g., ketamine, benzodiazepine) or placebo under controlled conditions.
- Post-Dose Time Series: Acquire repeated MRS scans (every ~10-15 min) and rs-fMRI scans (every ~5-10 min) for 60-90 minutes.
- Analysis:
- Plot metabolite (e.g., Glu, GABA) concentration vs. time.
- Calculate dynamic rs-fMRI metrics (e.g., ALFF, functional connectivity).
- Conduct cross-correlation or linear mixed-model analysis to relate time courses of metabolic and BOLD connectivity changes.
Visualizations
Title: Linking Glutamate Dynamics to the BOLD Signal
Title: Combined MRS-fMRI Experiment Workflow
The Scientist's Toolkit
Table 3: Key Research Reagent Solutions & Materials
| Item | Function in MRS-fMRI Research | Example/Notes |
|---|---|---|
| Phantom Solutions | For calibrating MRS sequences and validating quantification. | "Braino" phantom containing known concentrations of metabolites (e.g., Glu, GABA, NAA) in a buffered solution. |
| Spectral Analysis Software | To quantify metabolite concentrations from raw MRS data. | LCModel, jMRUI, TARQUIN. Essential for fitting spectra and reporting Glu/Cr, etc. |
| fMRI Analysis Suite | To preprocess and model BOLD signal data. | SPM, FSL, AFNI. Used for motion correction, statistical mapping, and extracting time series. |
| Coregistration Tool | To align the MRS voxel geometry with the fMRI statistical map. | In-house scripts using FSL's flirt or SPM's coregister. Critical for spatial correlation. |
| Pharmacological Probe | To manipulate neurotransmitter systems and test hypotheses. | Ketamine (NMDA receptor antagonist), Benzodiazepines (GABA-A modulator). |
| High-Channel Head Coil | To improve signal-to-noise ratio (SNR) for both MRS and fMRI. | 32- or 64-channel receive coils. Essential for high-quality spectral data at 3T. |
| Advanced MRS Sequences | To reliably detect specific, coupled metabolites like GABA or Gln. | MEGA-PRESS (for GABA), SPECIAL (for short TE), J-difference editing. |
This comparison guide, framed within the broader thesis on Magnetic Resonance Spectroscopy (MRS) glutamate vs. functional Magnetic Resonance Imaging (fMRI) Blood Oxygenation Level Dependent (BOLD) contrast response functions, objectively compares the two neuroimaging modalities. We present experimental data to delineate their convergence and divergence in mapping neural activity, a critical consideration for researchers and drug development professionals.
Comparative Performance & Experimental Data
Table 1: Key Characteristics of MRS Glutamate and fMRI BOLD
| Feature | MRS Glutamate | fMRI BOLD |
|---|---|---|
| Primary Measure | Concentration of glutamate in a voxel (~3x3x3 cm) | Hemodynamic response linked to deoxyhemoglobin |
| Spatial Resolution | Low (~cm), limited to specific voxels | High (~mm), whole-brain coverage |
| Temporal Resolution | Very low (~minutes per spectrum) | Moderate (~seconds per volume) |
| Direct vs. Indirect | More direct measure of excitatory neurotransmission | Indirect, metabolic-vascular "proxy" of activity |
| Sensitivity to Drugs | High; directly measures alterations in glutamate system | Indirect; affected by neurovascular coupling changes |
| Key Validation Challenge | Specificity to synaptic vs. metabolic pools; contamination by glutamine | Neurovascular coupling; HRF variability across regions/populations |
Table 2: Summary of Convergent and Divergent Findings from Key Validation Studies
| Study (Type) | Convergent Findings (Glutamate ↑ & BOLD ↑) | Divergent Findings (Glutamate ↓ or ≠ & BOLD ↑, or vice versa) | Implication |
|---|---|---|---|
| Schmaal et al. (2012), NeuroImage | During working memory task: Positive correlation between dorsolateral prefrontal cortex (DLPFC) glutamate and BOLD signal amplitude. | Not all regions showed correlation; relationship was region-specific. | Supports glutamate as a driver of hemodynamic response in specific cognitive circuits. |
| Falkenberg et al. (2012), J Neurosci | Vibrotactile stimulation: Increased somatosensory cortex BOLD and glutamate (block design). | Temporal mismatch: Glutamate remained elevated post-stimulus, while BOLD returned to baseline. | Glutamate dynamics reflect sustained metabolic processes beyond vascular response. |
| Mangia et al. (2007), PNAS | Visual stimulation: BOLD and glutamate increases scaled with stimulus duration. | Glutamate increase preceded the BOLD response onset. | Suggests glutamate release is an early event in the neurovascular cascade. |
| Drug Challenge (e.g., Ketamine) | Subanesthetic dose: Co-occurring increases in prefrontal BOLD and glutamate levels. | Higher doses/complex tasks: Dissociations emerge; BOLD may not linearly track glutamate changes due to receptor saturation or vascular effects. | Highlights BOLD's vulnerability to pharmacological perturbations of neurovascular coupling. |
Experimental Protocols
1. Protocol for Concurrent MRS/fMRI Acquisition to Assess Convergence
- Objective: To simultaneously measure task-evoked glutamate concentration changes and BOLD responses.
- Scanner: 3T or 7T MRI scanner with capable multichannel head coil.
- Sequence: Interleaved or simultaneous acquisition of:
- fMRI: Gradient-echo Echo-Planar Imaging (EPI) sequence (TR/TE = 2000/30 ms, voxel size 3x3x3 mm).
- MRS: Single-voxel PRESS or SPECIAL sequence (TE ~30-80 ms for glutamate detection, TR ~2000-3000 ms) targeting region of interest (e.g., DLPFC, visual cortex). Voxel size typically 2x2x2 cm to 3x3x3 cm.
- Paradigm: Block-design (e.g., 30s rest, 30s task) or event-related task known to activate target region.
- Analysis:
- BOLD: Preprocessing (motion correction, smoothing), GLM analysis to extract beta weights/percent signal change.
- MRS: Spectral processing (apodization, zero-filling, Fourier transform, phase/baseline correction). Quantification using LCModel with simulated basis sets. Glutamate levels reported as institutional units or relative to Creatine. Dynamic changes assessed by spectra from alternating task/rest blocks.
2. Protocol for Pharmacological Challenge to Probe Divergence
- Objective: To examine the impact of a psychoactive drug (e.g., ketamine) on glutamate-BOLD relationship.
- Design: Double-blind, placebo-controlled, within-subject crossover.
- Procedure:
- Baseline resting-state MRS and fMRI scans.
- Administration of placebo or drug (e.g., intravenous ketamine, 0.5 mg/kg over 40 min).
- Continuous or repeated MRS/fMRI scanning during and post-infusion during a cognitive task (e.g., n-back).
- Measures: Changes in prefrontal glutamate (from MRS) and task-evoked BOLD response amplitude/connectivity.
- Comparison: Correlation between drug-induced change in glutamate and change in BOLD response between drug and placebo sessions.
Visualizations
Title: Neurovascular Cascade & Measurement Points
Title: Concurrent MRS-fMRI Validation Workflow
The Scientist's Toolkit: Research Reagent Solutions
Table 3: Essential Materials for MRS-fMRI Validation Studies
| Item | Function in Research | Key Consideration |
|---|---|---|
| High-Field MRI Scanner (≥3T, ideally 7T) | Provides signal-to-noise ratio (SNR) essential for detecting small glutamate changes and high-resolution BOLD. | 7T offers superior spectral resolution for separating glutamate (Glu) from glutamine (Gln). |
| Advanced MRS Sequences (SPECIAL, MEGA-PRESS, sLASER) | Optimizes spectral editing and localization for accurate Glu detection, minimizing contamination from macromolecules. | Short TE sequences (e.g., SPECIAL) preserve metabolite signal but have broader baselines. |
| Spectral Quantification Software (LCModel, jMRUI) | Fits model spectra to in vivo data, providing metabolite concentrations with error estimates (Cramér-Rao Lower Bounds). | CRLB < 20% is typically required for reliable Glu estimates. |
| Pharmacological Probe (e.g., Ketamine) | Manipulates the glutamate system to test the specificity and robustness of the BOLD-Glu relationship. | Dose-response design is critical; vascular side effects can confound BOLD. |
| Cognitive Task Paradigms (E-Prime, PsychoPy) | Provides controlled, reproducible neural stimulation to evoke region-specific BOLD and Glu responses. | Must be optimized for block design to allow sufficient MRS averaging. |
| Biophysical Modeling Tools (e.g., Dynamic Causal Modeling) | Allows for the integration of MRS Glu as a modulator of effective connectivity in fMRI models. | Bridges molecular and systems-level findings. |
Can MRS Glutamate Validate or Calibrate the BOLD Signal?
Introduction
The Blood Oxygen Level Dependent (BOLD) signal from functional Magnetic Resonance Imaging (fMRI) is an indirect, complex hemodynamic proxy for neural activity. Its interpretation is confounded by neurovascular coupling and metabolic factors. Within the context of advancing MRS glutamate vs fMRI BOLD contrast response functions research, this guide compares Magnetic Resonance Spectroscopy (MRS) measurement of glutamate as a potential validation tool against the standard BOLD fMRI technique. The core thesis is that MRS glutamate, as a more direct molecular marker of excitatory neurotransmission, can calibrate and refine the physiological interpretation of the hemodynamic BOLD response.
Comparative Performance Analysis: MRS Glutamate vs. fMRI BOLD
| Feature / Metric | fMRI BOLD | MRS Glutamate |
|---|---|---|
| Primary Measure | Hemodynamic response (deoxyhemoglobin) | Concentration of glutamate (and sometimes Glx) |
| Spatial Resolution | High (1-3 mm) | Low (~20-30 mm voxel) |
| Temporal Resolution | Moderate (0.5-2 s) | Very Poor (5-10 minutes per spectrum) |
| Directness to Neural Activity | Indirect (via neurovascular coupling) | More direct (key excitatory neurotransmitter) |
| Quantification | Relative (% signal change) | Absolute (institutional units or mM) |
| Key Confounds | Vascular, physiological noise, CMRO2 changes | Macromolecule contamination, SNR, overlapping spectra |
| Best Use Case | Mapping neural networks, task timing | Assessing metabolic state, tonic glutamate levels |
| Validation Role | Reference standard for brain mapping | Candidate calibrator for BOLD’s neural basis |
Supporting Experimental Data
Table 1: Key Studies Correlating MRS Glutamate and BOLD Signal
| Study (Example) | Experimental Paradigm | Key Correlation Finding | Methodology Summary |
|---|---|---|---|
| Schaller et al., 2013 | Graded vibrotactile stimulation | BOLD amplitude in S1 scaled linearly with MRS glutamate concentration in S1. | Protocol: 7T fMRI/MRS. Block design vibration at 4 frequencies. PRESS MRS (TR=3000ms, TE=30ms) from S1 voxel pre- and post-scan. BOLD percent change vs. glutamate concentration analyzed. |
| Ip et al., 2017 | Resting-state fMRI & MRS | Resting-state BOLD connectivity strength in visual network correlated with visual cortex GABA/Glutamate ratio. | Protocol: 3T combined session. PRESS MRS (TR=2000ms, TE=30ms) from occipital cortex. Resting-state fMRI (7 min). Correlation analyzed between metabolite levels and network connectivity metrics. |
| Stanley & Raz, 2018 | Pharmacological challenge (NMDA antagonist) | Ketamine-induced changes in frontal BOLD signal correlated with changes in MRS Glx. | Protocol: Double-blind, placebo-controlled. 3T. BOLD fMRI during task pre/post infusion. MRS (STEAM, TR=1500ms, TE=20ms) from ACC pre/post. Correlation between drug-induced ΔBOLD and ΔGlx. |
Experimental Protocols Detail
1. Concurrent fMRI/MRS at 7T for Calibration (Model Protocol) * Objective: To establish a quantitative relationship between task-evoked BOLD response amplitude and baseline glutamate concentration in the primary sensory cortex. * Setup: 7T MR scanner with dual-tuned head coil. * Session 1 - Anatomical & MRS: Acquire high-resolution T1-weighted anatomical scan. Position a single voxel (20x20x20mm) precisely on the primary sensory cortex (S1) using anatomical landmarks. Acquire unsuppressed water reference and PRESS-localized spectra (TR=3000ms, TE=30ms, 128 averages) for absolute quantification of glutamate using LCModel. * Session 2 - fMRI: Using same subject position, perform block-design fMRI (Gradient-echo EPI, TR=2000ms, TE=25ms) during a graded vibrotactile stimulation paradigm applied to the contralateral hand. * Analysis: Extract BOLD percent signal change from S1 ROI matching the MRS voxel. Perform linear regression between individual subjects' BOLD amplitude and their baseline S1 glutamate concentration.
2. Pharmacological Challenge with Paired BOLD/MRS * Objective: To validate BOLD signal changes against direct neurochemical changes induced by a glutamate-modulating drug. * Design: Randomized, placebo-controlled, double-blind crossover. * Procedure: Two scanning visits separated by >1 week. Pre-infusion baseline: MRS from pre-defined ROI (e.g., ACC), then resting-state fMRI. During infusion of NMDA antagonist (e.g., ketamine) or saline placebo, perform task-based fMRI (e.g., working memory). Post-infusion: Repeat MRS acquisition. * Analysis: Compute change in BOLD activation (Δ%BOLD) and change in Glutamate or Glx (Δ[Glx]) from pre- to post-infusion. Test for significant correlation across the active drug cohort.
Visualizations
Diagram 1: MRS Glutamate & BOLD Signaling Pathway
Diagram 2: Combined MRS-fMRI Calibration Workflow
The Scientist's Toolkit: Key Research Reagent Solutions
| Item / Reagent | Function in MRS-BOLD Research |
|---|---|
| PRESS/STEAM MRS Sequences | Pulse sequences for volume-localized spectroscopy to detect glutamate. |
| Spectral Analysis Software (e.g., LCModel, jMRUI) | Deconvolutes MRS spectra to quantify metabolite concentrations. |
| Ultra-High Field MR Scanner (7T+) | Increases SNR and spectral resolution for more accurate glutamate separation. |
| Dual-Tuned RF Coils (^1H/^X) | Enables concurrent or alternating MRS and fMRI acquisition. |
| Glutamate-Modulating Agents (e.g., ketamine) | Pharmacological tools to perturb the glutamate system and test BOLD correlations. |
| ECD or MRI-Compatible Stimulation Devices | Deliver controlled sensory/cognitive tasks to evoke BOLD and neural responses. |
| Physiological Monitoring Equipment | Records cardiac/respiratory cycles to model and remove noise from BOLD signals. |
Conclusion
MRS glutamate serves not as a replacement for BOLD fMRI, but as a critical complementary tool for validation. Experimental data demonstrates that glutamate levels can correlate with and predict aspects of the BOLD response, offering a more direct link to underlying excitatory neurotransmission. This calibration is particularly powerful in pharmacological studies and for interpreting baseline state effects on BOLD reactivity. The principal limitations—notably poor temporal resolution—mean MRS glutamate is best used to inform models of BOLD contrast response functions rather than provide moment-to-moment validation. For researchers and drug developers, integrating MRS glutamate provides a essential biological constraint, moving BOLD interpretation from a purely hemodynamic phenomenon toward a more specific metric of glutamatergic neural activity.
Conclusion
MRS glutamate and fMRI BOLD response functions offer distinct yet fundamentally interconnected windows into brain activity. While BOLD provides unparalleled sensitivity and whole-brain mapping of indirect hemodynamic changes, MRS glutamate delivers specific, direct biochemical information about excitatory neurotransmission, albeit with limited spatial and temporal resolution. Their relationship is not one of replacement, but of powerful synergy. For researchers and drug developers, a multimodal approach that acknowledges the strengths and caveats of each method is paramount. Future directions include leveraging ultra-high field MRI to improve both signals, developing dynamic MRS for better temporal tracking, and creating unified biophysical models that explicitly link glutamate kinetics to the HRF. This integration is crucial for advancing mechanistic biomarkers, understanding neuropsychiatric and neurological diseases at a circuit and molecular level, and objectively evaluating the effects of novel pharmacological agents on the brain's excitatory system.