DAT-SPECT Imaging: A Comprehensive Guide to Assessing Presynaptic Nigrostriatal Terminal Function in Neurodegeneration
This article provides a comprehensive analysis of DAT-SPECT imaging as a critical tool for quantifying the integrity of presynaptic dopaminergic terminals in the nigrostriatal pathway.
DAT-SPECT Imaging: A Comprehensive Guide to Assessing Presynaptic Nigrostriatal Terminal Function in Neurodegeneration
Abstract
This article provides a comprehensive analysis of DAT-SPECT imaging as a critical tool for quantifying the integrity of presynaptic dopaminergic terminals in the nigrostriatal pathway. Aimed at researchers, scientists, and drug development professionals, it explores the foundational neurobiology, detailing the role of the dopamine transporter (DAT) in neurodegeneration. It outlines standardized methodological protocols, clinical and research applications, and strategies for image acquisition and quantification optimization. The content further examines validation against pathological standards, comparative analyses with other imaging modalities, and the tracer's pivotal role in clinical trial design and patient stratification. The synthesis offers key insights into current best practices and future directions for advancing both diagnostic accuracy and therapeutic development in Parkinsonian syndromes.
The Biological Basis of DAT-SPECT: From Dopamine Transporters to Neurodegenerative Biomarkers
The nigrostriatal dopaminergic pathway is the central neural circuit whose dysfunction defines Parkinson's disease (PD) and related parkinsonian syndromes. Within the framework of a thesis on DAT-SPECT imaging for presynaptic terminal function assessment, a rigorous understanding of this pathway's normal state and its degeneration is foundational. This document provides detailed application notes and protocols for researchers investigating nigrostriatal integrity, linking molecular pathophysiology directly to quantifiable imaging biomarkers like DAT availability.
Anatomy of the Nigrostriatal Pathway
The nigrostriatal pathway is a topographically organized, ascending projection within the basal ganglia motor circuit.
- Origin: Dopaminergic neurons in the substantia nigra pars compacta (SNc), primarily in the ventral tier (A9 group).
- Course: Axons project through the medial forebrain bundle, internal capsule, and pallidum.
- Termination: Synapses on medium spiny neurons (MSNs) in the dorsal striatum (caudate nucleus and putamen), forming a dense terminal network. The putamen receives the densest innervation and is most affected in PD.
Quantitative Data: Nigrostriatal Neuron Population
| Parameter | Healthy Adult Human | Parkinson's Disease (Moderate Stage) | Data Source / Method |
|---|---|---|---|
| SNc Neuron Count | ~380,000 - 550,000 | 50-70% loss at clinical onset; >80% loss in advanced stages | Post-mortem stereological cell counting |
| Striatal Dopamine Content (Putamen) | ~10-20 ng/mg tissue | <10% of age-matched controls | HPLC of post-mortem or PET imaging proxy |
| DAT Density (Putamen) | High (Reference: ~1.0-2.0 BPND via DAT-SPECT) | 40-70% reduction at diagnosis | In vivo DAT-SPECT or PET imaging (e.g., [123I]FP-CIT) |
Physiology and Dopaminergic Signaling
Dopamine release from nigrostriatal terminals modulates direct and indirect basal ganglia pathways, facilitating voluntary movement.
Protocol: Ex Vivo Measurement of Striatal Dopamine Release (Fast-Scan Cyclic Voltammetry in Brain Slice)
- Objective: To measure evoked dopamine release and reuptake kinetics in striatal tissue.
- Materials: Acute coronal striatal brain slice (300 µm) from rodent model; artificial cerebrospinal fluid (aCSF); carbon-fiber microelectrode; bipolar stimulating electrode; voltammetry amplifier/software.
- Procedure:
- Prepare and maintain slices in oxygenated (95% O2/5% CO2) aCSF at 32°C.
- Position carbon-fiber electrode in striatum and stimulating electrode on cortical afferents or along the nigrostriatal bundle path.
- Apply a triangular waveform (-0.4 to +1.2 V and back vs. Ag/AgCl, 400 V/s).
- Deliver a single, brief electrical pulse (e.g., 300 µA, 2 ms) to evoke dopamine release.
- Record oxidation current at the peak potential for dopamine (~+600-700 mV).
- Analyze traces for peak amplitude (release), and tau for decay (reuptake rate, primarily via DAT).
- Key Outputs: Dopamine release per pulse, reuptake rate constant. Comparison between healthy and pathological tissue models informs on presynaptic function.
Diagram Title: Presynaptic Dopamine Terminal Signaling & Clearance
Pathophysiology in Parkinsonism
Degeneration of SNc neurons leads to striatal dopamine depletion. Key pathological hallmarks include:
- Proteinopathy: Intraneuronal Lewy bodies composed of aggregated α-synuclein.
- Oxidative Stress: Impaired mitochondrial complex I function and reactive oxygen species generation.
- Neuroinflammation: Activated microglia and astrogliosis.
Experimental Protocol: Inducing Nigrostriatal Degeneration (6-OHDA Rat Model)
- Objective: To create a unilateral, progressive lesion of the nigrostriatal pathway for behavioral, biochemical, and imaging validation studies.
- Research Reagent Solutions:
Reagent Function in Protocol 6-Hydroxydopamine HBr (6-OHDA) Selective neurotoxin for catecholaminergic neurons; induces oxidative damage. Desipramine Hydrochloride Noradrenaline reuptake inhibitor; pre-injected to protect noradrenergic neurons, increasing 6-OHDA specificity for dopaminergic terminals. Apomorphine Hydrochloride Dopamine receptor agonist; used to induce contralateral rotation in behavioral validation of unilateral lesion. Stereotaxic Atlas & Coordinates Defines precise injection targets (e.g., medial forebrain bundle or striatum). [123I]FP-CIT / DAT Radioligand For ex vivo autoradiography or in vivo SPECT validation of DAT loss. - Surgical Procedure:
- Pre-treat rat with desipramine (25 mg/kg, i.p.) 30 min pre-surgery.
- Anesthetize and secure in stereotaxic frame.
- Inject 6-OHDA (e.g., 12 µg in 4 µL of 0.02% ascorbic acid-saline) into the right medial forebrain bundle (coordinates from bregma: AP -4.3, ML +1.6, DV -7.8 mm).
- Deliver at 0.5 µL/min; leave cannula in situ for 5 mins post-injection.
- Validation:
- Behavioral (2-4 weeks post-lesion): Administer apomorphine (0.05 mg/kg, s.c.). Count full contralateral rotations over 60 mins. >200 rotations indicates severe lesion.
- Biochemical: Post-mortem striatal HPLC for dopamine confirms depletion.
- Imaging Correlation: Ex vivo DAT autoradiography or in vivo DAT-SPECT shows >80% reduction in ipsilateral striatal binding.
Diagram Title: Key Pathogenic Events Leading to DAT Loss in PD
Application Notes for DAT-SPECT Research
DAT-SPECT (e.g., with [123I]FP-CIT) provides an in vivo measure of presynaptic nigrostriatal terminal integrity, correlating with pathological progression.
Protocol: Quantitative Analysis of DAT-SPECT Images
- Objective: To calculate specific binding ratios (SBR) in striatal sub-regions for group comparisons or longitudinal tracking.
- Image Processing Workflow:
- Spatial Normalization: Co-register SPECT image to subject's MRI, then normalize to a standard template (e.g., MNI space).
- Volume of Interest (VOI) Application: Apply standardized VOI atlas for whole striatum, caudate, and putamen. Use occipital cortex as reference region for non-specific binding.
- Quantification: Calculate SBR = (Mean Counts in VOI – Mean Counts in Reference) / Mean Counts in Reference.
- Asymmetry Index: AI = (Contralateral SBR – Ipsilateral SBR) / (Contralateral SBR + Ipsilateral SBR) * 100.
Data Interpretation Table: DAT-SPECT in Differential Diagnosis
| Condition | Typical DAT-SPECT Pattern (vs. Healthy Control) | Key Differentiating Aspect from PD |
|---|---|---|
| Idiopathic Parkinson's Disease | Asymmetric, posterior putamen loss first, spreading anteriorly. | Pattern is asymmetric and rostro-caudal gradient. |
| Multiple System Atrophy (MSA) | Bilateral, symmetric loss in both putamen and caudate. | More symmetric and extensive, may involve cerebellum. |
| Progressive Supranuclear Palsy (PSP) | Symmetric, diffuse loss across striatum, often moderate. | Midbrain atrophy on MRI is key correlate. |
| Essential Tremor | Normal DAT binding. | Key differentiator from tremor-dominant PD. |
| Drug-Induced Parkinsonism | Normal or near-normal DAT binding. | Presynaptic terminals are intact. |
Diagram Title: DAT-SPECT Image Analysis Workflow
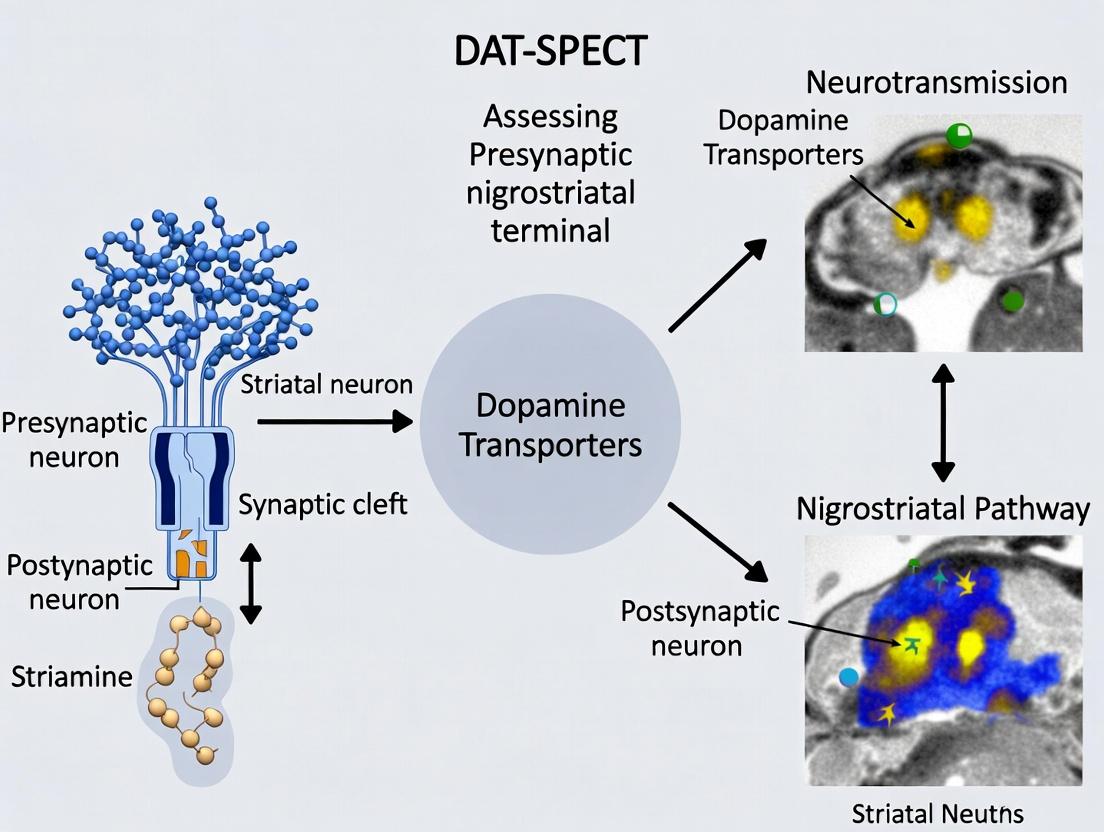
The Dopamine Transporter (DAT), encoded by the SLC6A3 gene, is a presynaptic transmembrane protein responsible for the high-affinity reuptake of synaptic dopamine, terminating its signal. Within the context of research on DAT-SPECT (Single-Photon Emission Computed Tomography) imaging for assessing presynaptic nigrostriatal terminal integrity, DAT serves as the primary in vivo molecular target. Quantifying DAT surface availability via radioligands like ^123^I-FP-CIT, ^123^I-β-CIT, or ^99m^Tc-TRODAT-1 provides a crucial biomarker for neurodegenerative diseases such as Parkinson's Disease (PD). Understanding DAT's molecular architecture, functional dynamics, and regulatory mechanisms is therefore foundational for interpreting DAT-SPECT data, developing novel radiotracers, and identifying potential disease-modifying therapeutic targets.
Molecular Structure & Key Domains
DAT is a member of the solute carrier 6 (SLC6) family of Na+/Cl- dependent neurotransmitter transporters. Its canonical structure, derived from homology modeling based on the drosophila DAT crystal structure, comprises 12 transmembrane helices (TMs) with intracellular N- and C-termini.
Key Structural Features:
- Elaborate Binding Pocket (S1): Formed by TMs 1, 3, 6, and 8, it coordinates dopamine, ions, and competitive inhibitors (e.g., cocaine analogs).
- Gate Domains: The extracellular loop 4 (EL4) acts as an "outer gate," while intracellular interactions control an "inner gate."
- Pharmacological Sites: The binding sites for tropane-based SPECT radioligands (e.g., FP-CIT) and therapeutics like methylphenidate overlap with the substrate site.
- Regulatory Domains: The N-terminus contains phosphorylation sites and motifs for protein-protein interactions. The C-terminus contains a PDZ-binding domain and is heavily modified by phosphorylation.
Table 1: Key Structural Domains of Human DAT (SLC6A3)
| Domain/Region | Residue Span | Primary Function | Relevance to DAT-SPECT |
|---|---|---|---|
| N-terminus | 1-59 | Phosphorylation (Ser, Thr), PIP₂ interaction, oligomerization | Regulation of membrane trafficking; affects radioligand binding availability. |
| Transmembrane Helices (TMs) | 1-12 | Form substrate/ion permeation pathway | TM 1, 3, 6, 8 form the core binding site for dopamine and SPECT tracers. |
| Extracellular Loop 2 (EL2) | ~108-120 | Possible modulator of substrate access | Glycosylation site; may influence ligand binding kinetics. |
| Extracellular Loop 4 (EL4) | ~276-289 | Outer gate, cholesterol interaction | Critical for conformational changes; target for allosteric modulators. |
| Intracellular Loop 4 (IL4) | ~332-368 | Interaction with scaffolding proteins (PSD-95) | Links DAT to synaptic architecture; potential disease-related disruption. |
| C-terminus | ~597-620 | Phosphorylation, internalization, PDZ-binding (SILV) | Major hub for kinase activity (PKC, CaMKII) and endocytic regulation. |
Function & Transport Cycle
DAT operates via an alternating-access mechanism, co-transporting one dopamine molecule with two Na⁺ ions and one Cl⁻ ion, driven by the electrochemical gradient. The cycle involves outward-open, occluded, and inward-open conformational states.
Experimental Protocol 1: Measurement of DAT-Mediated Dopamine Uptake in Heterologous Cells (e.g., HEK-293, LLC-PK₁).
Objective: To quantify functional dopamine transport activity of wild-type or mutant DAT.
Materials:
- Cell line stably or transiently expressing hDAT.
- ^3^H-dopamine (specific activity 20-40 Ci/mmol).
- Uptake buffer: HEPES-buffered saline (HBS) with 130 mM NaCl, 10 mM HEPES, 1.2 mM KH₂PO₄, 1.8 mM CaCl₂, 1.3 mM MgSO₄, 5 mM glucose, pH 7.4.
- Inhibitor solution: Uptake buffer containing 10 µM nomifensine or mazindol (to define specific uptake).
- Wash buffer: Ice-cold phosphate-buffered saline (PBS).
- Cell lysis solution: 1% SDS or appropriate scintillation-compatible lysis buffer.
- Scintillation counter.
Procedure:
- Culture & Plate: Grow hDAT-expressing cells to ~90% confluence. Seed cells in 24- or 48-well poly-D-lysine coated plates 48 hours prior to assay.
- Prepare Solutions: Thaw and dilute ^3^H-dopamine in uptake buffer to a final concentration of 10-100 nM. Prepare parallel inhibitor solution.
- Uptake Assay: Aspirate cell culture medium. Wash wells once with warm uptake buffer.
- Pre-inhibit (Optional): Add inhibitor solution to designated wells for 5 min.
- Initiate Uptake: Add ^3^H-dopamine uptake solution (with or without inhibitor) to all wells. Incubate at 37°C for a defined time (e.g., 1-5 minutes).
- Terminate Uptake: Rapidly aspirate radioactive solution and wash cells 3x with ice-cold PBS.
- Lysate Cells: Add cell lysis solution (e.g., 200 µL of 1% SDS) to each well. Incubate for 30 min with shaking.
- Quantify: Transfer lysate to scintillation vials, add scintillation fluid, and measure radioactivity in a scintillation counter.
- Analysis: Specific uptake = (Total cpm in absence of inhibitor) – (Non-specific cpm in presence of inhibitor). Convert to molar amount using specific activity. Normalize to total protein content (Bradford assay).
Regulation of DAT
DAT surface expression and activity are dynamically regulated by multiple pathways, which directly impact DAT-SECT signal intensity independent of terminal density.
Key Regulatory Mechanisms:
- Phosphorylation: PKC activation (e.g., via PMA) leads to DAT internalization and reduced uptake. ERK and CaMKII also modulate DAT.
- Ubiquitination: Monoubiquitination targets DAT for lysosomal degradation.
- Protein-Protein Interactions: Interactions with PICK1, α-synuclein, and syntaxin 1A modulate trafficking and function.
- Lipid Microenvironment: Cholesterol and PIP₂ levels stabilize DAT in the plasma membrane.
Diagram 1: Primary Regulatory Pathways of DAT Surface Expression
Experimental Protocols for DAT Investigation
Experimental Protocol 2: Cell Surface Biotinylation to Measure DAT Membrane Trafficking.
Objective: To quantify changes in DAT plasma membrane expression following a treatment (e.g., kinase activator).
Materials:
- Sulfo-NHS-SS-Biotin (membrane-impermeant).
- Quenching solution: Tris-buffered saline (TBS) with 100 mM glycine.
- Lysis buffer: RIPA buffer (with protease/phosphatase inhibitors).
- NeutrAvidin or Streptavidin Agarose beads.
- SDS-PAGE and Western Blot apparatus.
- Anti-DAT antibody (e.g., monoclonal rat DAT, clone DAT-Nt).
- Anti-transferrin receptor or Na+/K+ ATPase antibody (loading control).
- HRP-conjugated secondary antibodies.
Procedure:
- Treat Cells: Treat cultured cells (e.g., in 6-well plates) with experimental agent (e.g., 1 µM PMA for 30 min) and appropriate vehicle control.
- Cool & Wash: Place plates on ice. Wash cells 3x with ice-cold PBS-CM (PBS with 0.1 mM CaCl₂, 1 mM MgCl₂).
- Biotinylate: Incubate cells with freshly prepared Sulfo-NHS-SS-Biotin (0.5-1.0 mg/mL in PBS-CM) for 30 min at 4°C with gentle rocking.
- Quench: Remove biotin solution and wash cells once, then incubate with quenching solution for 10 min at 4°C.
- Lyse: Wash cells 2x with TBS, then lyse in RIPA buffer. Centrifuge at 16,000 x g for 15 min at 4°C. Collect supernatant.
- Quantify Protein: Measure total protein concentration.
- Pull-Down Biotinylated Proteins: Incubate equal amounts of total protein lysate with NeutrAvidin beads overnight at 4°C.
- Wash Beads: Pellet beads, wash 3x with lysis buffer.
- Elute & Analyze: Elute bound proteins with 2X Laemmli sample buffer + 50 mM DTT (to cleave disulfide bond in biotin linker) at 37-42°C for 30 min. Run eluate (Surface fraction) and total lysate input on SDS-PAGE. Perform Western blot for DAT and loading controls.
- Analysis: Compare band density of surface DAT, normalized to loading control, between treatment groups.
The Scientist's Toolkit: Research Reagent Solutions
Table 2: Key Research Reagents for DAT Studies
| Reagent | Category/Example | Primary Function in DAT Research |
|---|---|---|
| Radioligands | ^3^H-WIN 35,428, ^125^I-RTI-55 | High-affinity binding to DAT for in vitro saturation/competition binding assays to determine Bmax/Kd. |
| SPECT Tracers | ^123^I-FP-CIT (ioflupane), ^99m^Tc-TRODAT-1 | In vivo imaging of DAT availability in human and animal models for neurodegenerative disease research. |
| Selective Inhibitors | Nomifensine, GBR12909, Mazindol | Block dopamine uptake; define non-specific binding in functional assays; tool compounds for mechanism. |
| Psychostimulants | Cocaine, Methylphenidate, Amphetamine | Substrate (amphetamine) or competitive inhibitor (cocaine) used to study transport dynamics and regulation. |
| Kinase Activators/Inhibitors | PMA (PKC), KN-93 (CaMKII), U0126 (MEK/ERK) | Probe intracellular signaling pathways regulating DAT phosphorylation, trafficking, and activity. |
| Antibodies | Anti-DAT (clone DAT-Nt, C-terminus), Anti-pSER/DAT | Detect DAT protein in WB/IHC; phospho-specific antibodies assess activation state. |
| Heterologous Cell Lines | HEK-293, MDCK, LLC-PK₁ stably expressing hDAT | Standardized models for in vitro structure-function, uptake, and trafficking studies. |
| Viral Vectors | AAV-DAT-Cre, Lentivirus-shDAT-SLC6A3 | For targeted DAT manipulation (overexpression, knockdown) in in vivo rodent models or primary neurons. |
Diagram 2: Key Experimental Workflows in DAT Research
Application Notes and Protocols
DAT as a Presynaptic Terminal Marker: Correlation with Neuronal Integrity and Loss
1. Introduction Within the context of DAT-SPECT imaging research for assessing presynaptic nigrostriatal terminal function, the dopamine transporter (DAT) serves as a critical biomarker. DAT is exclusively located on the presynaptic terminals of dopaminergic neurons, and its density quantified via SPECT radioligands (e.g., [¹²³I]FP-CIT, [⁹⁹mTc]TRODAT-1) provides an in vivo measure of terminal integrity. This application note details the correlation between DAT availability, neuronal health, and progressive loss in neurodegenerative parkinsonisms (e.g., Parkinson's Disease (PD), Multiple System Atrophy (MSA)), and provides standardized protocols for associated research.
2. Quantitative Correlation Data Table 1: DAT-SPECT Binding Reductions in Neurodegenerative Disorders vs. Healthy Controls (HC)
| Condition (vs. HC) | Caudate % Reduction | Putamen % Reduction | Key Radioligands | Clinical Correlation (UPDRS-III) |
|---|---|---|---|---|
| Early Parkinson's Disease | 20-40% | 50-70% (asymmetric) | [¹²³I]FP-CIT, [¹²³I]β-CIT | r ≈ -0.65 to -0.75 |
| Advanced Parkinson's Disease | 50-70% | 80-95% | [¹²³I]FP-CIT, [⁹⁹mTc]TRODAT-1 | r ≈ -0.70 to -0.80 |
| Multiple System Atrophy | 50-75% | 70-90% | [¹²³I]FP-CIT | r ≈ -0.60 to -0.75 |
| Progressive Supranuclear Palsy | 55-80% | 60-85% | [¹²³I]FP-CIT | r ≈ -0.55 to -0.70 |
| Dementia with Lewy Bodies | 40-60% | 50-75% | [¹²³I]FP-CIT | Correlates with cognitive fluctuations |
Table 2: Longitudinal DAT Loss Rates in Parkinson's Disease
| Brain Region | Annual % Reduction (PD) | Annual % Reduction (HC) | Imaging Interval | Notes |
|---|---|---|---|---|
| Contralateral Putamen | 6-12% | 0.5-1.5% | 12-24 months | Faster decline in early disease |
| Ipsilateral Putamen | 4-8% | 0.5-1.5% | 12-24 months | Slower than contralateral side |
| Caudate Nucleus | 3-6% | 0.5-1.5% | 12-24 months | More linear progression |
3. Detailed Experimental Protocols
Protocol 3.1: In Vivo DAT-SPECT Imaging for Longitudinal Studies Objective: To acquire and quantify striatal DAT binding in human subjects for correlation with clinical scores. Materials: See "Research Reagent Solutions" table. Procedure:
- Radioligand Administration: Inject a standardized dose (e.g., 185 MBq ± 10% of [¹²³I]FP-CIT) intravenously under controlled conditions.
- Image Acquisition: Perform SPECT/CT imaging 3-4 hours post-injection. Use a multi-detector gamma camera with fan-beam collimators. Acquire 120 projections over 360°, 40-50 seconds per projection. Low-dose CT for attenuation correction.
- Image Reconstruction: Use iterative reconstruction (OSEM) with attenuation, scatter, and resolution recovery corrections. Reorient to the anterior commissure-posterior commissure (AC-PC) plane.
- Region of Interest (ROI) Analysis: Apply standardized ROIs (e.g., from automated software like BRASS) for the left/right caudate, putamen, and occipital cortex (reference region). Calculate specific binding ratios (SBRs): SBR = (Target ROI Mean Counts / Reference ROI Mean Counts) - 1.
- Statistical Analysis: Correlate SBRs with unified Parkinson's disease rating scale (UPDRS-III) scores using linear regression. Calculate annualized percent change for longitudinal data.
Protocol 3.2: Ex Vivo Autoradiography for Post-Mortem Validation Objective: To validate in vivo DAT-SPECT findings with direct quantification of DAT protein density in human or animal brain tissue. Materials: Cryostat, phosphorimager screens, [¹²⁵I]RTI-121 or [³H]WIN 35,428, tissue homogenizer, scintillation counter. Procedure:
- Tissue Preparation: Snap-fresh human or animal brain striatal sections (20 µm) on slides. Store at -80°C.
- Radioligand Incubation: Pre-incubate slides in assay buffer (50 mM Tris, 120 mM NaCl, pH 7.4) for 10 min. Incubate with specific DAT radioligand (e.g., 0.1 nM [¹²⁵I]RTI-121) for 2 hours at 4°C. Include adjacent sections with excess blocker (e.g., 10 µM mazindol) to define non-specific binding.
- Washing and Exposure: Wash slides (2 x 1 min) in cold buffer, dip in cold distilled water, and air-dry. Expose to phosphorimager screens for 3-7 days.
- Quantification: Analyze optical density in striatal subregions using image analysis software (e.g., ImageJ). Convert to femtomoles per milligram of protein (fmol/mg prot) using co-exposed radioactive standards.
- Correlation: Perform linear regression analysis between post-mortem autoradiography DAT density and ante-mortem SPECT SBR values from the same subjects.
4. Visualization of Pathways and Workflows
Title: DAT as a Marker of Presynaptic Terminal Integrity
Title: DAT-SPECT Imaging and Analysis Workflow
5. The Scientist's Toolkit: Research Reagent Solutions
Table 3: Essential Materials for DAT Biomarker Research
| Item / Reagent | Primary Function & Rationale |
|---|---|
| [¹²³I]FP-CIT (Iofluplane) | Gold-standard SPECT radioligand for DAT. High affinity and selectivity for in vivo human imaging. |
| [⁹⁹mTc]TRODAT-1 | Technetium-99m based DAT tracer. Allows convenient use in clinics without cyclotron. |
| DAT-Specific Antibodies (e.g., Anti-DAT, clone DAT-Nt) | For immunohistochemistry/Western blot validation of DAT protein expression and localization in tissue. |
| [³H]WIN 35,428 or [¹²⁵I]RTI-121 | High-affinity DAT radioligands for in vitro binding assays and autoradiography on tissue sections. |
| Mazindol (10 µM) | Potent DAT/NET inhibitor used to define non-specific binding in in vitro assays. |
| Striatal Tissue Homogenates (Human/Animal) | Substrate for in vitro saturation/competition binding assays to determine DAT density (Bmax) and affinity (Kd). |
| Automated ROI Software (e.g., BRASS, PMOD) | For standardized, reproducible quantification of DAT-SPECT images, reducing inter-rater variability. |
| Phosphorimager Screens & Scanner | For high-resolution, linear quantification of radioactivity in autoradiography experiments. |
Application Notes
Dopamine Transporter (DAT) SPECT imaging is a critical molecular neuroimaging technique for the in vivo assessment of the integrity of presynaptic nigrostriatal dopaminergic terminals. This is primarily applied in the differential diagnosis of neurodegenerative parkinsonian syndromes (e.g., Parkinson's disease, Multiple System Atrophy, Progressive Supranuclear Palsy) from non-degenerative conditions like essential tremor or drug-induced parkinsonism. In research and drug development, it serves as a biomarker for disease progression, therapeutic efficacy monitoring, and patient stratification in clinical trials. The three principal radiopharmaceuticals—Ioflupane (123I-FP-CIT), 123I-Altropane, and 99mTc-TRODAT-1—share the core function of binding to the DAT but differ in pharmacokinetics, affinity, and practical availability.
- Ioflupane (123I-FP-CIT): The most widely used and clinically established agent. It has high affinity and selectivity for DAT. Its slow dissociation kinetics require imaging 3-6 hours post-injection, providing excellent target-to-background ratios. It is FDA and EMA-approved for clinical use.
- 123I-Altropane: Characterized by very high affinity and rapid brain uptake and washout. Its principal research advantage is the potential for same-day imaging within 1-2 hours post-injection. It shows high striatal uptake even in early disease stages but has limited commercial availability.
- 99mTc-TRODAT-1: The only 99mTechnetium-based DAT tracer. The key advantage is the use of 99mTc, which is generator-produced, more readily available, and less expensive than cyclotron-produced 123I. Its lower target-to-background ratio compared to Ioflupane is a trade-off for logistical and economic benefits, making it valuable in settings without easy 123I access.
Table 1: Comparative Properties of DAT SPECT Tracers
| Property | Ioflupane (123I-FP-CIT) | 123I-Altropane | 99mTc-TRODAT-1 |
|---|---|---|---|
| Radioisotope | Iodine-123 | Iodine-123 | Technetium-99m |
| Approval Status | FDA, EMA Approved | Research Use | Research Use (approved in some countries) |
| Injection Activity | 111-185 MBq | 185-370 MBq | 740-1110 MBq |
| Imaging Time | 3-6 hours post-injection | 45-120 min post-injection | 3-4 hours post-injection |
| Primary Affinity (Ki) | High (DAT: ~4 nM) | Very High (DAT: ~2 nM) | Moderate (DAT: ~14 nM) |
| Striatal Uptake Peak | ~1 hour | ~10-20 min | ~4 hours |
| Critical Advantage | Gold standard, high contrast | Rapid kinetics, high signal | 99mTc availability & cost |
| Key Limitation | Long wait for imaging, 123I cost | Limited availability | Lower striatal-to-background ratio |
Table 2: Quantitative Binding Parameters in Healthy Controls vs. Parkinson's Disease (PD)
| Tracer | Specific Binding Ratio (SBR) in Healthy Controls (Mean ± SD) | SBR in Early PD (Mean ± SD) | % Reduction in Early PD vs. Control |
|---|---|---|---|
| Ioflupane | Caudate: ~3.5 ± 0.6; Putamen: ~3.2 ± 0.7 | Caudate: ~2.2 ± 0.7; Putamen: ~1.3 ± 0.5 | Caudate: ~37%; Putamen: ~59% |
| 123I-Altropane | Striatum: >7.0 | Striatum: ~3.5 | ~50% (striatal composite) |
| 99mTc-TRODAT-1 | Striatum: ~2.1 ± 0.4 | Striatum: ~1.1 ± 0.3 | ~48% (striatal composite) |
Experimental Protocols
Protocol 1: Standard Human DAT-SPECT Imaging with Ioflupane (123I-FP-CIT)
Objective: To acquire diagnostic-quality SPECT images for the assessment of presynaptic dopaminergic terminal integrity.
Pre-Imaging Requirements:
- Patient Preparation: Discontinue drugs that may interfere with DAT binding (e.g., bupropion, benzatropine, methylphenidate, amphetamines) for at least 5 half-lives. Thyroid blockade with potassium perchlorate or potassium iodide solution is mandatory 30-60 minutes prior to 123I tracer injection.
- Radiopharmaceutical: Administer 111-185 MBq (3-5 mCi) of 123I-FP-CIT intravenously in a quiet, dimly lit room.
Image Acquisition (3-6 hours post-injection):
- Positioning: Position the patient supine on the SPECT/CT scanner bed. Use a head holder to minimize motion. Align the orbitomeatal line as close to vertical as possible.
- CT Acquisition (for attenuation correction): Perform a low-dose CT scan (e.g., 120 kV, 30-50 mAs) of the head.
- SPECT Acquisition:
- Collimator: Use a high-resolution, parallel-hole collimator (e.g., fan-beam or low-energy high-resolution).
- Energy Window: 15% centered on 159 keV photopeak of 123I.
- Projections: 120 projections over 360°.
- Acquisition Time: 30-45 seconds per projection (total scan time ~30-40 min).
- Matrix: 128 x 128.
Image Processing & Analysis:
- Reconstruction: Reconstruct transaxial slices using an iterative algorithm (e.g., OSEM) with attenuation correction (from CT), scatter correction, and resolution recovery.
- Reorientation: Manually reorient reconstructed transaxial images parallel to the canthomeatal line.
- Volumes of Interest (VOI) Definition: Co-register individual patient data to a DAT-SPECT template or manually draw fixed-size VOIs on the caudate nuclei and putamen (left and right). Place a reference VOI in the occipital cortex or cerebellum (background).
- Quantification: Calculate the Specific Binding Ratio (SBR) for each striatal VOI:
SBR = (Striatal Counts / Background Counts) - 1. Compare to age-matched normative database.
Protocol 2:Ex VivoBiodistribution and Binding Affinity Study in Rodent Models
Objective: To determine the pharmacokinetics, biodistribution, and specific binding of a novel DAT tracer candidate in comparison to a reference tracer.
Materials: Control and 6-OHDA-lesioned rats/mice, reference tracer (e.g., 125I-FP-CIT), novel tracer candidate (99mTc-labeled), gamma counter, homogenizer.
Method:
- Animal Preparation: Anesthetize animals. For blocking studies, pre-administer a selective DAT inhibitor (e.g., GBR12909, 10 mg/kg i.p.) 30 min prior to tracer injection.
- Tracer Injection: Inject a known activity (~1-5 MBq) of the experimental tracer via the tail vein. Sacrifice animals in cohorts (n=5 per time point) at multiple time points (e.g., 30 min, 1, 2, 4 hours post-injection).
- Tissue Harvesting: Rapidly dissect brain regions (striatum, cerebellum, cortex, etc.) and peripheral organs (heart, lung, liver, kidney, muscle, blood). Weigh all samples.
- Radioactivity Measurement: Count radioactivity in each tissue sample using a gamma counter, correcting for decay and background.
- Data Analysis:
- Calculate % Injected Dose per Gram (%ID/g) for each tissue.
- Calculate the Striatum-to-Cerebellum (or background) Ratio over time.
- In blocking studies, calculate the percentage reduction in striatal uptake to confirm DAT specificity.
The Scientist's Toolkit
Table 3: Key Research Reagent Solutions for DAT-SPECT Studies
| Item | Function in Research |
|---|---|
| Ioflupane (123I-FP-CIT) Kit | Commercially supplied, GMP-grade tracer for clinical validation and gold-standard comparison studies. |
| GBR12909 Dihydrochloride | Selective, high-affinity DAT inhibitor used in preclinical blocking studies to demonstrate binding specificity. |
| 6-OHDA (6-Hydroxydopamine) | Neurotoxin used to create unilateral rat/mouse models of dopaminergic denervation for tracer validation. |
| DAT-SPECT MRI Atlas/Template | Standardized volumetric brain atlas for automated, reproducible VOI placement and quantification (e.g., BRASS, BasGAN). |
| Striatal Phantom | Physical quality control phantom containing striatum-shaped inserts; used to validate scanner performance and quantification pipelines. |
| Potassium Iodide (KI) Solution | Essential for thyroid blockade prior to 123I-labeled tracer administration in human/primates to prevent radioactive iodine uptake. |
| OSEM Reconstruction Software | Industry-standard iterative reconstruction package (e.g., HERMES, Siemens xSPECT) enabling accurate quantification with corrections. |
Visualizations
Diagram 1: DAT-SPECT Imaging & Analysis Workflow (76 chars)
Diagram 2: Tracer Selection Logic for DAT Imaging (52 chars)
This application note, framed within a broader thesis on DAT-SPECT imaging for presynaptic nigrostriatal terminal function assessment, consolidates current insights from preclinical and pathological studies linking dopamine transporter (DAT) density to neurodegenerative disease progression. DAT serves as a critical marker for the integrity of dopaminergic terminals, and its quantitative assessment provides invaluable insights into disease staging and therapeutic efficacy.
Key Findings from Recent Studies
Quantitative data from recent preclinical and human pathological studies demonstrate a strong correlation between declining DAT density and advancing disease stages in Parkinson's disease (PD) and related disorders.
Table 1: DAT Density Correlation with Disease Progression Metrics
| Disease Model / Cohort | Measurement Method | Key Correlation Finding (r-value / % loss) | Clinical / Pathological Stage Correlation |
|---|---|---|---|
| MPTP-Treated Non-Human Primate | [¹²³I]FP-CIT SPECT | Striatal uptake loss: 60-75% | Strong inverse correlation with motor severity (r = -0.89) |
| Human PD Post-Mortem Tissue | [³H]WIN 35,428 Autoradiography | Caudate loss: ~70%; Putamen loss: ~85-90% | Correlates with neuronal loss in SNpc & UPDRS-III histology score |
| Prodromal (iRBD) Cohort | [¹²³I]FP-CIT SPECT (SBR) | Mean putamen SBR reduced by ~30% vs. controls | Predicts conversion to overt synucleinopathy (HR: 4.6 per SBR SD decrease) |
| A53T Alpha-Synuclein Mouse | PET ([¹¹C]CFT) | Striatal binding reduced by ~40% at 12 months | Precedes significant motor deficit onset by ~3 months |
| PD vs. APS (PSP, MSA) | DAT-SPECT Meta-Analysis | Putamen DAT loss: PD > MSA-C > PSP | Differential spatial loss patterns aid differential diagnosis |
Detailed Experimental Protocols
Protocol 1: Ex Vivo DAT Density Measurement via Radioligand Autoradiography in Post-Mortem Brain Tissue
Application: Quantifying regional DAT density in human or animal model brain sections.
Materials:
- Cryostat-sectioned brain tissue slices (10-20 µm thick) containing striatum.
- Assay buffer: 50 mM Tris-HCl, 120 mM NaCl, 5 mM KCl, pH 7.4.
- Radioligand: [³H]WIN 35,428 (specific activity ~85 Ci/mmol).
- Displacer: 100 µM nomifensine or mazindol (for defining nonspecific binding).
- X-ray film or phosphor imaging plates.
- Densitometry/image analysis software (e.g., ImageJ, PMOD).
Procedure:
- Section Preparation: Bring tissue sections to room temperature. Pre-incubate in assay buffer for 15 min.
- Binding Incubation: Incubate sections in assay buffer containing 2-5 nM [³H]WIN 35,428 for 90 min at 4°C. For nonspecific binding (NSB) sections, include 100 µM nomifensine.
- Washing: Terminate incubation by washing slides sequentially (2 x 1 min) in ice-cold buffer, followed by a quick dip in ice-cold deionized water to remove salts.
- Drying: Air-dry sections completely.
- Exposure: Appose sections to phosphor imaging plates or tritium-sensitive film alongside calibrated radioactive standards for 2-4 weeks.
- Quantification: Scan plates/film. Convert optical density to fmol/mg tissue equivalent using the standard curve. DAT-specific binding = Total binding - NSB.
Protocol 2: In Vivo Longitudinal DAT-SPECT Imaging in Rodent Models of PD
Application: Monitoring progressive nigrostriatal degeneration in live animal models.
Materials:
- Animal model (e.g., AAV-α-synuclein, 6-OHDA partial lesion).
- DAT-SPECT radiopharmaceutical: [¹²³I]FP-CIT or [⁹⁹mTc]TRODAT-1.
- Small-animal SPECT/CT system.
- Isoflurane anesthesia system with heated stage.
- Image analysis software (e.g., InVivoScope, VivoQuant).
Procedure:
- Radiopharmaceutical Preparation: Synthesize and QC radiotracer according to established methods. Administer via tail vein (rodent) at ~30-40 MBq.
- Image Acquisition: At peak uptake (e.g., 90-120 min post-injection for [¹²³I]FP-CIT), anesthetize animal. Position prone in SPECT scanner. Acquire SPECT scan (e.g., 30-40 min acquisition), followed by a low-dose CT for anatomical co-registration and attenuation correction.
- Image Reconstruction & Analysis: Reconstruct SPECT data using ordered-subset expectation maximization (OSEM) with CT-based attenuation correction. Co-register SPECT to a species-specific anatomical template.
- VOI Analysis: Define standardized volumes of interest (VOIs) for striatum (left/right, caudate/putamen if resolvable) and a reference region (e.g., occipital cortex or cerebellum). Calculate specific binding ratios (SBR): (Mean Striatal VOI counts / Mean Reference VOI counts) - 1.
- Longitudinal Analysis: Repeat imaging at predefined intervals (e.g., monthly). Coregister all serial images to a baseline scan for voxel-wise or VOI-based comparison of SBR decline over time.
Visualization of Concepts and Workflows
Diagram 1: DAT-SPECT as a Disease Progression Biomarker
Diagram 2: DAT-SPECT Imaging & Analysis Workflow
The Scientist's Toolkit: Key Research Reagent Solutions
Table 2: Essential Materials for DAT Density Research
| Item / Reagent | Function & Application | Key Consideration |
|---|---|---|
| [³H]WIN 35,428 or [¹²⁵I]RTI-55 | High-affinity DAT radioligands for in vitro binding assays and autoradiography. | Requires specific licensing for radioisotope use. [³H] offers higher resolution for autoradiography. |
| DAT-SPECT Tracer Kits ([¹²³I]ioflupane/FP-CIT) | Ready-to-use kits for clinical & large animal SPECT imaging of DAT. | [¹²³I] has 13.2h half-life; requires daily ordering/logistics planning. |
| Small-Animal DAT PET Tracers ([¹¹C]PE2I, [¹⁸F]FE-PE2I) | Higher resolution PET imaging in rodents for longitudinal studies. | [¹¹C] requires an on-site cyclotron; [¹⁸F] analogs allow longer imaging protocols. |
| Anti-DAT Antibodies (e.g., monoclonal DAT-Nt) | Immunohistochemistry & Western blot for DAT protein localization and semi-quantification. | Clone specificity and validation for the species of interest is critical. |
| Specific DAT Inhibitors (Nomifensine, GBR12909) | Used to define nonspecific binding in assays and as pharmacological tools in vivo. | Nomifensine is a common choice for defining NSB in binding assays. |
| Neurotoxic Agents (6-OHDA, MPTP) | For creating selective dopaminergic lesion animal models to study DAT loss. | Dose and administration route (stereotaxic vs. systemic) determine lesion severity. |
| Alpha-Synuclein Pre-Formed Fibrils (PFFs) | To seed pathological α-syn aggregation and model progressive Lewy pathology in vivo. | Injection site (striatum vs. SN) influences pathology spread kinetics. |
Protocols in Practice: Executing and Interpreting DAT-SPECT for Clinical & Research Objectives
This protocol is established within the context of a broader research thesis investigating presynaptic nigrostriatal terminal function using Dopamine Transporter (DAT) Single-Photon Emission Computed Tomography (SPECT). Standardization is critical for ensuring reproducibility, enabling multi-center trials, and generating reliable quantitative data for evaluating disease progression and therapeutic efficacy in neurodegenerative disorders such as Parkinson's disease.
Patient Preparation Protocol
A rigorous and consistent patient preparation protocol is essential to minimize physiological variability and imaging artifacts.
Key Pre-Imaging Instructions:
- Medication Review: A comprehensive review of all medications is mandatory. Drugs known to interfere with DAT binding (e.g., amphetamines, benzotropine, methylphenidate, modafinil, bupropion, and certain antidepressants) must be withdrawn following a pre-defined, ethics-approved schedule (typically 5-7 half-lives prior to imaging).
- Patient Fasting: Patients should fast for a minimum of 4 hours prior to tracer administration to stabilize plasma amino acid levels and reduce potential competition for transporter binding.
- Hydration: Encourage good hydration before and after the study to promote tracer clearance and reduce radiation burden.
- Contraindications: Screen for pregnancy, breastfeeding, and severe claustrophobia. Document any neurological or psychiatric comorbidities.
Tracer Administration and Handling
The protocol specifies the use of I-123 labeled radiopharmaceuticals, primarily I-123 Ioflupane (DaTscan).
Detailed Protocol:
- Tracer Specification: Use only high-specific-activity [123I]Ioflupane, certified for human use, with radiochemical purity >95%.
- Dose Administration: Administer a single, slow intravenous bolus injection of 111-185 MBq (3-5 mCi) of I-123 Ioflupane via a secure venous cannula. The exact activity must be measured in a dose calibrator and recorded.
- Injection Environment: Perform injection in a quiet, dimly lit room to minimize patient stress.
- Post-Injection Wait Period: A standardized uptake period of 3-4 hours (± 15 minutes) is required between injection and image acquisition to allow for optimal brain uptake and blood pool clearance.
- Thyroid Blocking: To prevent unnecessary thyroid irradiation from free I-123, administer oral potassium iodide (e.g., 130 mg) or potassium perchlorate (e.g., 400 mg) approximately 30 minutes prior to tracer injection, in accordance with local regulations.
Table 1: Tracer Administration Parameters
| Parameter | Specification | Notes |
|---|---|---|
| Radiopharmaceutical | [123I]Ioflupane | Alternative: [123I]FP-CIT |
| Administration Route | Intravenous Bolus | Secure venous access |
| Recommended Activity | 111 - 185 MBq (3 - 5 mCi) | Measure with dose calibrator |
| Uptake Period | 3 - 4 hours | Strict timing required (±15 min) |
| Thyroid Blockade | Mandatory | KIO₃ or KClO₄ pre-injection |
Image Acquisition Parameters
Acquisition must be performed on a dedicated SPECT/CT system with high-resolution, parallel-hole collimators.
Detailed Acquisition Protocol:
- Patient Positioning: Position the patient supine on the scanner bed. Use a head holder and restraint system to minimize motion. The head should be positioned to bring the orbitomeatal line as close to vertical as possible. Align the striata within the central field of view.
- CT for Attenuation Correction: First, acquire a low-dose CT scan (e.g., 120 kV, 20-40 mAs) of the head for anatomical localization and attenuation correction.
- SPECT Acquisition:
- Collimators: Use Low-Energy, High-Resolution (LEHR) parallel-hole collimators.
- Energy Window: 15% centered on 159 keV photopeak of I-123.
- Orbit: Non-circular or step-and-shoot circular orbit.
- Angular Sampling: 120 projections over 360°.
- Acquisition Time: 30-45 seconds per projection, aiming for a total scan duration of 25-35 minutes.
- Matrix Size: 128 x 128.
- Zoom: 1.0-1.5 (system-dependent to achieve ~2.5-3.0 mm pixel size).
Table 2: Standardized SPECT Acquisition Parameters
| Parameter | Recommended Setting | Purpose/Rationale |
|---|---|---|
| System | SPECT/CT | Enables attenuation correction & anatomical fusion |
| Collimators | LEHR Parallel-Hole | Optimal resolution for striatal imaging |
| Energy Window | 159 keV ± 7.5% | Maximizes I-123 photopeak counts |
| Projections | 120 over 360° | Adequate angular sampling |
| Time/Projection | 30-45 sec | Balances count statistics & patient comfort |
| Matrix | 128 x 128 | Standard resolution |
| Pixel Size | 2.5-3.0 mm | Achieved via system zoom |
Data Reconstruction and Processing Protocol
Standardized Reconstruction Workflow:
- Pre-processing: Apply motion correction algorithms if available.
- Attenuation Correction: Use the CT-based μ-map.
- Reconstruction Algorithm: Use Iterative Reconstruction (Ordered Subsets Expectation Maximization - OSEM) with 4-8 subsets and 10-12 iterations. Include resolution recovery and model-based scatter correction.
- Post-filtering: Apply a 3D post-reconstruction Gaussian filter (FWHM 6-8 mm) to reduce noise.
- Reorientation: Reorient transaxial slices parallel to the anterior commissure-posterior commissure (AC-PC) line.
- Quantification: Use validated software for volume-of-interest (VOI) analysis. Apply standardized templates for the caudate nucleus, putamen, and occipital cortex (reference region). Calculate specific binding ratios (SBR):
SBR = (Target VOI Count Density / Reference VOI Count Density) - 1.
DAT-SPECT Image Processing & Quantification Workflow
The Scientist's Toolkit: Research Reagent Solutions
Table 3: Essential Materials for DAT-SPECT Research
| Item / Reagent | Function & Specification |
|---|---|
| [123I]Ioflupane | The primary radiopharmaceutical that competitively binds to the presynaptic dopamine transporter (DAT). High specific activity is required. |
| Potassium Iodide (KIO₃) | Thyroid blocking agent to prevent uptake of free I-123, protecting the thyroid gland. |
| LEHR Collimators | Critical hardware component for SPECT; limits detected photons to those traveling approximately perpendicular to the detector to form a usable image. |
| Anatomical VOI Atlas/Template | MRI-based or population-averaged templates (e.g., MNI space) for defining caudate, putamen, and reference regions, enabling automated, reproducible quantification. |
| Iterative Reconstruction Software | Advanced software incorporating OSEM, scatter correction (SC), and resolution recovery (RR) for optimal image quality and quantitative accuracy. |
| Phantom (Hoffman 3D Brain or Striatal) | Essential quality control tool for validating scanner performance, reconstruction protocols, and quantification pipelines across sites and time. |
Standardized Protocol's Role in Research Thesis
Within the broader thesis on DAT-SPECT imaging for assessing presynaptic nigrostriatal terminal function, quantitative accuracy is paramount for longitudinal studies in Parkinson's disease progression and drug development. Accurate quantification of dopamine transporter (DAT) availability (e.g., binding ratios) depends critically on the fidelity of image reconstruction and the precision of attenuation correction (AC) to compensate for photon absorption within the body. This document outlines the technical considerations, application notes, and protocols essential for achieving quantitative accuracy in DAT-SPECT research.
Technical Considerations for Quantitative SPECT
Photons emitted from radiopharmaceuticals (e.g., ^123I-ioflupane, ^99mTc-TRODAT-1) are attenuated, scattered, and can suffer from partial volume effects, leading to inaccurate activity concentration estimates.
Table 1: Primary Factors Affecting Quantitative Accuracy in DAT-SPECT
| Factor | Impact on Quantification | Typical Magnitude of Error (if uncorrected) |
|---|---|---|
| Photon Attenuation | Reduced counts, regional bias (deeper structures undercounted) | Up to 50-60% loss in basal ganglia |
| Scatter | False counts in background and target regions | Increases background, reduces target-to-background ratio |
| Collimator-Detector Response | Spatial resolution loss, partial volume effect | Up to 20% error in small structures (e.g., striatum) |
| Reconstruction Algorithm | Convergence, noise, bias | Varies significantly (10-40%) between FBP and iterative methods |
| Motion (Patient) | Misregistration, blurring | Variable, can invalidate studies |
Attenuation Correction Methodologies
Effective AC requires an attenuation map (µ-map). The method for obtaining this map defines the approach.
Table 2: Attenuation Correction Methods in SPECT
| Method | Principle | Advantages for DAT-SPECT | Key Limitations |
|---|---|---|---|
| Calculated AC (CAC) | Uses an assumed body contour (ellipse) with uniform attenuation coefficient. | Simple, fast, no extra scan. | Poor accuracy for irregular contours, ignores internal heterogeneity (e.g., skull). |
| CT-based AC (SPECT/CT) | Uses CT scan to generate a voxel-wise µ-map. | Highly accurate, accounts for bone/soft tissue, gold standard. | Increased radiation dose, cost, potential misregistration. |
| Transmission Scan-based AC | Uses a radionuclide source (e.g., ^153Gd, ^57Co) to acquire transmission data. | Accurate, dedicated to emission energy. | Long scan time, source replacement, less common in modern systems. |
| Deep Learning-based AC | Synthetic CT generation from emission data or MR. | No extra radiation/scan time. | Requires validation, model training data. |
Recent literature (2023-2024) indicates that for quantitative brain SPECT, CT-based AC combined with scatter correction (SC) and resolution recovery (RR) within an iterative reconstruction framework is the recommended standard.
Detailed Experimental Protocols
Protocol A: Standardized DAT-SPECT Acquisition & Reconstruction with CT-AC
This protocol is designed for a hybrid SPECT/CT system using ^123I-ioflupane.
Aim: To generate quantitatively accurate DAT binding potential maps. Materials:
- Hybrid SPECT/CT scanner.
- ^123I-ioflupane.
- Head holder and restraint to minimize motion.
- Workstation with iterative reconstruction software incorporating AC, SC, and RR.
Procedure:
- Radiopharmaceutical Administration: Inject a standard dose (e.g., 185 MBq ±10%) of ^123I-ioflupane intravenously under controlled conditions.
- Uptake Period: Allow a 3-4 hour uptake period post-injection. Instruct the subject to rest in a quiet room, minimizing auditory/visual stimulation.
- Patient Positioning:
- Position the patient supine on the scanner bed.
- Use a head holder and velcro strap to secure the head.
- Align the orbitomeatal line as perpendicular to the bed axis.
- Ensure the brain (including cerebellum) is within the field of view (FOV).
- CT Scan Acquisition (for AC & Anatomic Localization):
- Acquire a low-dose CT scan (e.g., 120 kV, 30-50 mAs, slice thickness ≤ 2.5 mm) over the brain region.
- Ensure no patient movement between CT and SPECT scans.
- SPECT Acquisition:
- Use a high-resolution fan-beam or parallel-hole collimator.
- Acquisition Parameters: 120 projections over 360°, 30-40 seconds per projection, 128x128 or 256x256 matrix.
- Energy window: 15% centered on 159 keV photopeak for ^123I; consider adding scatter windows.
- Image Reconstruction (Ordered-Subsets Expectation Maximization - OSEM):
- Input Data: SPECT projection data, CT-derived µ-map.
- Steps: a. Reconstruct CT images to generate a µ-map scaled to the 159 keV attenuation coefficient. b. Apply the µ-map for AC within the OSEM projector-backprojector pair. c. Integrate Scatter Correction (e.g., Dual-Energy Window or Model-based). d. Integrate Collimator-Detector Response Modeling (Resolution Recovery). e. Use 6-10 subsets and 8-12 iterations (optimize for specific scanner). f. Apply a 3D post-reconstruction filter (e.g., Gaussian, FWHM 6-8 mm) for noise control.
- Output: Attenuation- and scatter-corrected, resolution-recovered transaxial slices in units of kBq/cc.
Protocol B: Validation of AC Accuracy Using a 3D-Printed Anthropomorphic Striatal Phantom
Aim: To empirically validate the quantitative accuracy of an AC method against known activity concentrations.
Materials:
- Anthropomorphic brain phantom with striatal inserts (or a 3D-printed version based on a standard template).
- ^99mTc or ^123I solution of known activity concentration.
- Dose calibrator.
- SPECT/CT scanner.
- Image analysis software (e.g., PMOD, Hermes, MATLAB).
Procedure:
- Phantom Preparation:
- Fill striatal inserts with a known activity concentration of radionuclide (Atarget, e.g., 50 kBq/cc).
- Fill the background compartment with a lower known activity (Abg, e.g., 10 kBq/cc) to simulate realistic contrast (~5:1).
- Assemble the phantom.
- Imaging: Perform CT and SPECT acquisitions as per Protocol A steps 4-5.
- Image Reconstruction:
- Reconstruct two SPECT datasets: (i) With full correction (AC+SC+RR), (ii) Without AC.
- Data Analysis:
- Draw volumes of interest (VOIs) on the CT or corrected SPECT for striatal inserts and background regions.
- Apply these VOIs to all reconstructed datasets.
- Record the measured mean activity concentration (kBq/cc) in each VOI.
- Calculate Recovery Coefficient (RC) = (Measured Target Activity / True Target Activity).
- Calculate Striatal-to-Background Ratio (SBR) = (Target VOI mean / Background VOI mean).
Table 3: Sample Phantom Validation Results
| Reconstruction Method | Measured Striatal Activity (kBq/cc) | RC | Calculated SBR | Ground Truth SBR = 5.0 |
|---|---|---|---|---|
| No AC, No SC, FBP | 22.1 | 0.44 | 2.8 | |
| CT-AC + SC + RR (OSEM) | 48.5 | 0.97 | 4.9 |
Visualization of Workflows and Relationships
Diagram Title: DAT-SPECT Quantitative Imaging Workflow
Diagram Title: Pillars of Quantitative SPECT Accuracy
The Scientist's Toolkit: Research Reagent Solutions & Essential Materials
Table 4: Essential Toolkit for Quantitative DAT-SPECT Research
| Item | Category | Function & Relevance to Quantitative Accuracy |
|---|---|---|
| ^123I-Ioflupane | Radiopharmaceutical | DAT-specific ligand. High specific activity and purity are critical for consistent target engagement and low non-specific binding. |
| ^99mTc-TRODAT-1 | Radiopharmaceutical | Alternative DAT ligand. Requires consistent kit preparation for reliable biodistribution. |
| Hybrid SPECT/CT System | Imaging Hardware | Enables CT-based attenuation correction, the gold standard for quantitative AC. |
| Anthropomorphic Striatal Phantom | Validation Tool | Essential for validating reconstruction and correction pipelines under controlled conditions. |
| Head Restraint System | Accessory | Minimizes patient motion, preventing artifacts and misregistration between CT and SPECT. |
| Dose Calibrator | Laboratory Equipment | Precise measurement of injected activity, required for absolute quantification (kBq/cc). |
| OSEM Reconstruction Software with AC/SC/RR | Software | Enables advanced quantitative reconstruction. Must be properly configured for your scanner. |
| Quantitative Image Analysis Suite (e.g., PMOD, MIM) | Software | Allows standardized VOI placement (e.g., using a template) for extracting consistent binding values. |
| MATLAB/Python with Custom Scripts | Software | For custom processing, batch analysis, and method development/validation. |
Within the broader thesis on DAT-SPECT imaging for assessing presynaptic nigrostriatal terminal function in neurodegenerative research (e.g., Parkinson's disease, atypical parkinsonisms), quantitative analysis is paramount. These methods move beyond visual interpretation, enabling objective measurement of dopamine transporter availability, longitudinal tracking of degeneration, and robust evaluation of therapeutic interventions in clinical trials. SBR, Striatal Binding Ratios, and Volumetric Analysis form the core quantitative toolkit for extracting meaningful, reproducible data from molecular imaging.
Key Quantitative Methods: Definitions and Applications
Specific Binding Ratio (SBR)
SBR is a widely adopted metric in DAT-SPECT quantification. It represents the ratio of specific (i.e., displaceable) binding in a target region to non-specific background binding in a reference region devoid of dopamine transporters.
Calculation: SBR = (Mean Counts in Target Region - Mean Counts in Reference Region) / Mean Counts in Reference Region
Primary Application: Quantifying presynaptic dopaminergic integrity in the caudate nucleus and putamen.
Striatal Binding Ratio (SBR) & Variations
The term "Striatal Binding Ratio" is often used synonymously with the general SBR method but specifically applied to the striatum. Key variations include:
- Voxel-wise SBR Maps: Generation of parametric images displaying SBR at each voxel.
- Asymmetry Indices: Calculation of left-right differences in striatal SBR to assess lateralized degeneration.
Volumetric Analysis
This method involves the three-dimensional segmentation of the striatum (or its sub-regions) to calculate its volume. In DAT-SPECT context, it's often combined with binding metrics to calculate total striatal binding (Volume × Mean SBR), which may be more sensitive to diffuse changes.
Table 1: Comparison of Core Quantitative Methods in DAT-SPECT Analysis
| Method | Primary Output | Target Regions | Key Advantage | Main Limitation |
|---|---|---|---|---|
| Specific Binding Ratio (SBR) | Unitless ratio | Caudate, Putamen, Whole Striatum | Robust to uniform attenuation/scatter effects. Simple to implement. | Sensitive to ROI placement. Requires clear reference region (e.g., occipital cortex). |
| Voxel-wise SBR Parametric Mapping | 3D Statistical Image | Whole Brain Voxels | Allows voxel-based statistical analysis (e.g., SPM). No prior ROI definition needed. | Computationally intensive. Requires high image quality and spatial normalization. |
| Volumetric Analysis | Volume (mL or cm³) | Caudate, Putamen, Whole Striatum | Provides anatomical context. Enables total binding calculation. | Dependent on segmentation accuracy (MRI co-registration preferred). More affected by partial volume effect. |
Experimental Protocols
Protocol 3.1: Standardized SBR Calculation for DAT-SPECT
Objective: To quantify striatal dopamine transporter availability from a [123I]FP-CIT or [99mTc]TRODAT-1 SPECT scan.
Materials: See "The Scientist's Toolkit" below. Workflow Diagram:
Procedure:
- Image Acquisition & Reconstruction: Acquire SPECT data according to EANM or SNMMI guidelines. Reconstruct iteratively with attenuation correction (using the CT scan), scatter correction, and resolution recovery.
- Spatial Normalization (Optional but Recommended): Spatially normalize the reconstructed SPECT image to a
[123I]FP-CIT template in standard (e.g., MNI) space using SPM or similar software. - Region of Interest (ROI) Application:
- Method A (Manual): On the co-registered CT/MRI or the normalized SPECT, manually draw ROIs on the left/right caudate, putamen, and occipital cortex (reference region). Use consistent anatomical guidelines.
- Method B (Atlas-Based): Apply a standardized atlas (e.g., AAL, BRASS) in the template space to automatically extract counts from the regions.
- Data Extraction: Extract the mean radioactive count (counts/voxel) from each ROI.
- SBR Calculation: For each striatal ROI, calculate SBR using the formula above. Calculate asymmetry index:
AI = 100 × |(SBR_left - SBR_right)| / (0.5 × (SBR_left + SBR_right)).
Protocol 3.2: Volumetric Analysis of Striatal Regions with MRI Co-registration
Objective: To determine the volume of striatal sub-regions and calculate total striatal binding.
Workflow Diagram:
Procedure:
- Multimodal Image Acquisition: Acquire a high-resolution 3D T1-weighted MRI and a DAT-SPECT/CT scan for the same subject within a close timeframe.
- MRI Processing: Process the T1-MRI using automated segmentation software (e.g., Freesurfer, FSL-FIRST, SPM12) to generate 3D label masks for the caudate and putamen. Manually review and correct segmentations if necessary.
- Image Co-registration: Rigidly co-register the native-space DAT-SPECT image to the subject's T1-MRI using mutual information optimization.
- Data Fusion & Calculation: Apply the binary striatal masks to the co-registered SPECT image.
- Calculate the volume of each structure from the MRI segmentation.
- Extract the mean SBR within each mask (using a reference region from the SPECT as in Protocol 3.1).
- Calculate Total Specific Binding for each region:
Volume (mL) × Mean SBR.
The Scientist's Toolkit: Research Reagent Solutions & Essential Materials
Table 2: Essential Materials for DAT-SPECT Quantitative Analysis
| Item / Reagent Solution | Function & Application in Research |
|---|---|
Radiopharmaceuticals [123I]Ioflupane (FP-CIT), [99mTc]TRODAT-1 |
Binds selectively to presynaptic dopamine transporters (DAT). Enables visualization of nigrostriatal terminal integrity. The primary imaging agent. |
| DAT-SPECT/CT Hybrid Imaging System | Gamma camera(s) with fan-beam or parallel-hole collimators, integrated with a CT scanner. Acquires functional SPECT data and anatomical CT for attenuation correction and co-registration. |
| Striatal Phantom (e.g., Striatal Dopaminergic System Phantom) | Physical phantom filled with radioactive solutions simulating caudate/putamen and background. Essential for validating quantification pipelines, inter-scanner harmonization, and longitudinal phantom studies. |
| Standardized Uptake Value (SUV) Calibration Kit | Known-activity sources and phantoms for cross-calibrating the SPECT/CT system with the dose calibrator, enabling absolute quantification (kBq/mL) if required. |
| Image Processing & Quantification Software (e.g., PMOD, Hermes BRASS, Capp, SPM12 with DAT-SPECT toolbox) | Provides tools for reconstruction, attenuation/scatter correction, spatial normalization, atlas-based ROI analysis, parametric map generation, and longitudinal comparison. Critical for standardized analysis. |
| MRI Segmentation Software (e.g., Freesurfer, FSL, SPM12) | Used for high-precision volumetric analysis of caudate and putamen from T1-weighted MRI. Enables partial volume effect correction and total binding calculations. |
| Anatomical Brain Atlas Templates (e.g., MNI152, AAL, Hammersmith Atlas) | Digital templates in standard space. Used for automated ROI placement (atlas-based analysis) and voxel-based statistical parametric mapping (VBM, SPM). |
| Data Analysis Software (e.g., R, Python with SciPy/NumPy, GraphPad Prism, JMP) | Used for statistical analysis, generating graphs, performing group comparisons (e.g., PD vs. controls), and constructing predictive models from extracted quantitative data (SBR, volumes). |
Within the broader thesis context of DAT-SPECT imaging for assessing presynaptic nigrostriatal terminal function, this document details its pivotal clinical application in differentiating etiologies of tremor and parkinsonism. Accurate differential diagnosis among Parkinsonian syndromes (e.g., Parkinson's disease), Essential Tremor (ET), and Drug-Induced Parkinsonism (DIP) is critical for therapeutic strategy and clinical trial enrollment. DAT-SPECT provides an objective measure of dopamine terminal integrity, which is characteristically reduced in neurodegenerative Parkinsonian syndromes but preserved in ET and typically in DIP.
DAT-SPECT Signal Quantification and Diagnostic Thresholds
Table 1: Quantitative DAT-SPECT Parameters for Differential Diagnosis
| Diagnostic Category | Specific Binding Ratio (SBR) Range (Caudate) | SBR Range (Putamen) | Putamen/Caudate Asymmetry Index | DAT-SPECT Result |
|---|---|---|---|---|
| Normal Presynaptic Integrity (e.g., ET, DIP*) | ≥ 2.5 | ≥ 2.0 | < 15% | Normal |
| Neurodegenerative Parkinsonism (e.g., PD, MSA, PSP) | Reduced (Often < 2.0) | Severely Reduced (< 1.5) | Often > 20% in PD | Abnormal |
| Boundary/Indeterminate Zone | 2.0 - 2.5 | 1.5 - 2.0 | 15-20% | Requires clinical correlation |
Note: A subset of DIP cases may show mild DAT reduction, potentially indicating underlying nigral vulnerability.
Table 2: Comparative Clinical and DAT-SPECT Features
| Feature | Parkinson's Disease (PD) | Essential Tremor (ET) | Drug-Induced Parkinsonism (DIP) |
|---|---|---|---|
| Tremor Type | Rest tremor, often asymmetric | Postural/kinetic tremor, symmetric | Rest/postural, often symmetric |
| DAT-SPECT | Abnormal (asymmetric putaminal loss) | Normal | Typically Normal (may be abnormal in some cases) |
| Response to Levodopa | Good | Minimal | Poor/Negative |
| Course after Offending Drug Withdrawal | Progressive | Stable or slowly progressive | Usually improves/resolves |
Experimental Protocols
Protocol 1: DAT-SPECT Imaging Acquisition and Analysis for Clinical Differentiation
Objective: To acquire and quantify striatal DAT binding for differentiating neurodegenerative parkinsonism from ET/DIP. Materials: Gamma camera with fan-beam collimators (or dedicated SPECT system), ^123^I-ioflupane (DaTscan), head restraint, semi-automated analysis software (e.g., BRASS, Scenium). Procedure:
- Patient Preparation: Thyroid blockade with potassium iodide solution administered at least 1 hour prior to radioligand injection. Withdraw interfering medications (e.g., amphetamines, bupropion, cocaine analogs) for ≥5 drug half-lives.
- Radioligand Administration: Intravenous injection of 111-185 MBq (3-5 mCi) of ^123^I-ioflupane.
- Image Acquisition: Initiate SPECT acquisition 3-6 hours post-injection. Patient positioned supine with head secured. Use a 128x128 matrix, 120 projections over 360°, 40-60 seconds per projection.
- Reconstruction: Iterative reconstruction (e.g., OSEM) with attenuation correction (Chang’s method).
- Quantitative Analysis:
- Reorient transaxial slices parallel to the anterior commissure-posterior commissure (AC-PC) line.
- Automatically or manually draw volumes of interest (VOIs) on the left/right caudate, putamen, and occipital cortex (reference region).
- Calculate specific binding ratios (SBR):
SBR = (Target VOI Count Density - Occipital Count Density) / Occipital Count Density. - Generate asymmetry indices:
AI = (Side1 - Side2) / (0.5 * (Side1 + Side2)) * 100%.
- Interpretation: Compare subject SBRs to age-matched normative database. Abnormal scan: Reduced putamen SBR, especially posteriorly, often with asymmetry in PD. Normal scan: Preserved symmetrical caudate and putamen signal.
Protocol 2: Longitudinal DAT-SPECT in Suspected Drug-Induced Parkinsonism
Objective: To assess whether parkinsonism is purely drug-induced or unmasked subclinical neurodegeneration. Materials: As per Protocol 1. Access to patient's detailed pharmacotherapy history. Procedure:
- Baseline Scan: Perform DAT-SPECT while patient is symptomatic on the offending drug (typically dopamine receptor blocking agent).
- Clinical Intervention: Under supervision of treating physician, withdraw or substitute the offending causative agent.
- Clinical Follow-up: Monitor symptom resolution over 3-9 months.
- Follow-up Scan: Repeat DAT-SPECT imaging if symptoms persist beyond the expected washout period (typically 6-12 months post-withdrawal).
- Analysis: Compare baseline and follow-up SBRs. Stable or improved SBR suggests pure DIP. Significantly declining SBR suggests an underlying neurodegenerative process unmasked by the drug.
Visualization: Diagnostic and Research Pathways
Title: DAT-SPECT Diagnostic Pathway for Tremor
Title: Key Pathways Targeted in Differential Diagnosis
The Scientist's Toolkit: Research Reagent Solutions
Table 3: Essential Materials for DAT-SPECT Differential Diagnosis Research
| Reagent/Material | Function/Application in Research |
|---|---|
| ^123^I-Ioflupane (DaTscan) | The primary radiopharmaceutical for DAT-SPECT. ^123^I-labeled tropane analog that binds with high affinity to presynaptic dopamine transporters (DAT). |
| ^123^I-FP-CIT | Alternative DAT ligand used in research; similar application and binding properties to ioflupane. |
| Potassium Iodide (KI) Solution | Essential for thyroid blockade to prevent unnecessary radiation exposure from free ^123^I. |
| Age-Matched Normative Database | Curated database of DAT-SPECT quantification values (SBRs) from healthy controls across decades of life. Critical for defining abnormal thresholds. |
| Striatal Phantom | Imaging phantom used for quality control, calibration, and standardization of SPECT systems across different research sites. |
| Semi-Automated Volumetric Analysis Software (e.g., BRASS, MIM Neuro) | Software for standardized VOI placement, SBR calculation, and comparison to normative data. Reduces inter-rater variability. |
| Specific Binding Ratio (SBR) Algorithm | The standard quantitative output: (Striatal ROI - Background ROI) / Background ROI. Primary metric for assessing DAT density. |
| Dopamine Receptor Blocking Agent (e.g., haloperidol) | Pharmacological tool used in animal models to induce parkinsonism for comparative studies with neurodegenerative models. |
Within the broader thesis on DAT-SPECT imaging for presynaptic nigrostriatal terminal function assessment, this document details its specific applications in clinical trial design and execution. DAT-SPECT provides an objective, quantitative measure of dopamine transporter density, a direct biomarker for the integrity of nigrostriatal dopaminergic terminals. This capability is transformative for clinical research in neurodegenerative disorders like Parkinson's disease (PD) and related Parkinsonian syndromes, enabling precise patient enrichment and the use of objective, biologically anchored endpoints. This application note provides protocols and methodologies for integrating DAT-SPECT into clinical trial frameworks.
Application Note: Patient Enrichment in Neurodegenerative Disease Trials
Rationale
Clinical trials in early PD and prodromal stages face significant heterogeneity in enrolled populations, often including patients with non-degenerative causes of symptoms (e.g., essential tremor, drug-induced parkinsonism). This dilutes treatment effect signals, increases required sample sizes, and raises trial costs and failure risk. DAT-SPECT serves as an enrichment tool by confirming the presence of nigrostriatal degeneration prior to randomization.
Key Data and Validation
Recent meta-analyses and longitudinal studies validate the predictive utility of baseline DAT-SPECT.
Table 1: Predictive Value of Baseline DAT-SPECT for Clinical Progression in Parkinsonian Syndromes
| Study (Year) | Cohort (N) | Follow-up Duration | Baseline DAT Deficiency Predictive of: | Positive Predictive Value (PPV) | Negative Predictive Value (NPV) |
|---|---|---|---|---|---|
| PPMI (2023) | 423 (Prodromal) | 4 years | Conversion to PD | 89% | 95% |
| Parkinson Progression Marker Initiative | Suspects | (Hyposmia, RBD) | |||
| CALM-PD Extension (2022) | 78 (Early PD) | 5 years | UPDRS-III worsening >10 points/year | 82% | 88% |
| Systematic Review (2023) | 1,842 (All) | 2-6 years | Synucleinopathy diagnosis | 91% | 94% |
| Parkinsonian Uncertain | vs. SWEDD/Non-degenerative |
SWEDD: Scans Without Evidence of Dopaminergic Deficit.
Protocol: DAT-SPECT for Patient Enrichment in a Phase IIb Trial
Title: Protocol for Screening and Enrichment Using [123I]FP-CIT SPECT in a Trial of a Neuroprotective Agent for Early Parkinson's Disease.
Objective: To enroll only subjects with confirmed dopaminergic deficit, as measured by a specific binding ratio (SBR) on DAT-SPECT below a pre-defined threshold.
Materials: See Scientist's Toolkit in Section 5.
Procedure:
- Pre-Screening: Identify subjects with clinical diagnosis of early, untreated PD (within 2 years of diagnosis, Hoehn & Yahr Stage 1-2).
- Informed Consent: Obtain consent specifically for the screening DAT-SPECT procedure and its use for eligibility determination.
- Radiopharmaceutical Administration: Inject 185 MBq (5 mCi) of [123I]FP-CIT (Iofluplane) intravenously under controlled conditions.
- Image Acquisition (3-6 hours post-injection):
- Scanner: Dual-head SPECT/CT gamma camera with high-resolution collimators.
- Acquisition Parameters: 120 projections over 360°, 30-40 seconds per projection, matrix size 128x128.
- CT: Perform low-dose CT for attenuation correction.
- Image Processing and Analysis:
- Reconstruction: Use iterative reconstruction (OSEM) with attenuation (CT-based) and scatter correction.
- Coregistration: Align SPECT data to standard anatomic space (e.g., MNI) using the CT.
- Region-of-Interest (ROI) Definition: Automatically or manually draw ROIs over the left and right caudate and putamen. Define a reference region in the occipital cortex or cerebellum.
- Quantification: Calculate the Specific Binding Ratio (SBR) for each striatal region.
- SBR = (Mean Counts in Striatal ROI - Mean Counts in Reference ROI) / Mean Counts in Reference ROI.
- Eligibility Determination (Enrichment Step):
- Calculate the mean SBR of the four striatal regions (left/right caudate/putamen).
- Enrichment Criterion: Subject is eligible for randomization if the mean SBR is ≤ 80% of the age-matched normal mean reference value held by the trial's central imaging core lab.
- Subjects with SBR above this threshold (SWEDD) are screen-failed.
- Quality Control: All scans are reviewed by the central core lab for technical adequacy and quantitative analysis consistency.
Diagram 1: Workflow for DAT-SPECT Patient Enrichment in Clinical Trials.
Application Note: Objective Endpoint Measurement
Rationale
Clinical rating scales (e.g., MDS-UPDRS) are subjective, rater-dependent, and prone to placebo effects. DAT-SPECT offers an objective, continuous, and biologically direct measure of the target pathology—dopaminergic terminal integrity—serving as a pharmacodynamic biomarker and potential surrogate endpoint.
Key Data on DAT-SPECT as an Endpoint
Longitudinal studies have characterized the natural history of DAT loss, providing a baseline against which drug effects can be measured.
Table 2: Annualized Rate of Striatal DAT Decline in Parkinson's Disease
| Population | Baseline Disease Severity | Mean Annual % Decline in Striatal SBR (95% CI) | Study (Source) |
|---|---|---|---|
| Early PD, Untreated | Hoehn & Yahr 1-2 | 6.5% (5.8 - 7.2%) | Parkinson Progression Marker Initiative (PPMI, 2023) |
| Moderate PD, Treated | Hoehn & Yahr 2-3 | 4.8% (4.0 - 5.6%) | LABS-PD Study (2022) |
| Prodromal (RBD) | Asymptomatic | 3.1% (2.2 - 4.0%) | PPMI Prodromal Cohort (2023) |
| Healthy Controls | N/A | 0.5% (0.1 - 0.9%) | Multiple (Meta-analysis 2023) |
Protocol: DAT-SPECT as a Quantitative Endpoint in a Neuroprotection Trial
Title: Protocol for Using Serial DAT-SPECT as a Primary Endpoint in a Phase III Trial of a Disease-Modifying Therapy.
Objective: To determine if the investigational drug reduces the rate of decline in striatal DAT binding compared to placebo over 18-24 months.
Materials: As per Section 5. Consistent imaging equipment and analysis pipeline across all sites and timepoints is critical.
Procedure:
- Baseline Scan (V1): Perform DAT-SPECT as per Section 2.3 protocol on all randomized subjects. This serves as the individual baseline.
- Follow-up Scans: Perform identical DAT-SPECT procedures at pre-specified intervals (e.g., 12 and 24 months post-baseline).
- Centralized, Blinded Analysis:
- All images are anonymized and sent to a central imaging core lab.
- Analysts are blinded to subject identity, treatment arm, and timepoint order (images are analyzed in random order).
- The identical processing pipeline and reference databases used at baseline are applied to all follow-up scans.
- The core lab calculates the SBR for each striatal sub-region for each scan.
- Primary Endpoint Calculation:
- For each subject, the percent change from baseline in mean striatal SBR is calculated for each follow-up timepoint.
- The primary statistical analysis compares the slope of SBR decline (e.g., % change per month) between the active treatment group and the placebo group using a mixed-model repeated measures (MMRM) analysis, with baseline SBR and age as covariates.
- Quality Assurance: Phantom scans are conducted regularly at all imaging sites to ensure longitudinal scanner stability. Intra- and inter-rater reliability of ROI placement is assessed periodically by the core lab.
Diagram 2: Workflow for Using Serial DAT-SPECT as an Objective Endpoint.
Integrated Clinical Trial Strategy Diagram
Diagram 3: Integrated Trial Strategy Using DAT-SPECT.
The Scientist's Toolkit: Key Research Reagent Solutions
Table 3: Essential Materials for DAT-SPECT Research in Clinical Trials
| Item / Reagent | Function & Rationale | Key Considerations for Trials |
|---|---|---|
| Radiopharmaceutical:[123I]FP-CIT (Iofluplane)[123I]β-CIT[123I]PE2I | Binds with high affinity and selectivity to presynaptic dopamine transporters (DAT). Provides the molecular signal for imaging. | Regulatory: Must be GMP-grade for trials. Supply: Reliable, consistent radiosynthesis across sites/durations. PK/BD: Consistent pharmacokinetics crucial for standardized imaging windows. |
| SPECT/CT Imaging System | Gamma camera for detecting 123I emissions; CT component for anatomic localization and attenuation correction. | Harmonization: Equipment should be comparable across sites (vendor, collimators). QC: Requires regular phantom scanning for calibration and stability monitoring. |
| Image Processing Software(e.g., PMOD, Hermes, MIM) | For image reconstruction, coregistration, atlas-based ROI definition, and quantitative analysis (SBR calculation). | Standardization: Identical software version and processing pipeline must be used across all subjects and timepoints by the central core lab. |
| Striatal Atlas Template(e.g., BRASS, CapAIBL) | Standardized ROI definitions for caudate, putamen, and reference region (occipital/cerebellum) in template space. | Minimizes inter-operator variability. Enables fully automated, reproducible analysis essential for multi-center trials. |
| Age-Matched Normal Database | Database of DAT-SPECT scans from healthy controls used to define "normal" SBR ranges for enrichment thresholds. | Must be acquired using the same imaging and processing protocol as the trial. Critical for setting the SBR eligibility cutoff. |
| Ancillary Medication:Potassium Iodate (Iodine) | Thyroid blockade to prevent uptake of free radioactive iodine-123. | Standard of care for patient safety. Administration protocol (dose, timing) must be consistent. |
Optimizing DAT-SPECT: Solutions for Technical Challenges and Enhanced Reproducibility
DAT-SPECT imaging, utilizing ligands like I-123 FP-CIT or Tc-99m TRODAT-1, is a critical tool for quantifying presynaptic dopaminergic terminal integrity in research on Parkinson's disease and related disorders. The accuracy of quantitative parameters—such as specific binding ratios (SBRs) or striatal binding potentials—is paramount for longitudinal studies, disease progression modeling, and therapeutic intervention trials. This document details protocols to mitigate three major confounding factors: patient motion, scalp contamination, and reconstruction errors, which can introduce significant variance and bias into research data.
Artifact Characterization, Impact, and Mitigation Protocols
Patient Motion
Characterization: During the lengthy SPECT acquisition (25-45 minutes), head movement causes misalignment between projection data and reconstructed slices, leading to blurring, attenuation artifacts, and inaccurate striatal quantification. Quantitative Impact: Studies show motion >5 mm can alter SBR by 10-25%, potentially obscuring early pathological changes or treatment effects.
Protocol: Rigorous Head Immobilization and Motion Tracking
Materials: Custom thermoplastic mask system, laser alignment markers, motion tracking system (e.g., Polaris optical tracker), foam head supports. Procedure:
- Pre-scan Preparation: Fit subject with a individually molded thermoplastic mask fixed to the headrest. Use laser alignment beams to mark chin and nasion positions on the mask.
- Acquisition Monitoring: Implement real-time optical tracking of reflective markers on the mask. Set a motion threshold alert (e.g., >2 mm translational, >1° rotational).
- Post-acquisition Correction: If motion is detected, use software-based motion correction (framing or list-mode data). Reconstruct corrected and uncorrected datasets for comparison.
Scalp Contamination (Extra-striatal Radioactivity)
Characterization: Tracer accumulation in scalp vasculature or salivary glands creates a "halo" of activity, increasing background counts and potentially contaminating striatal ROI counts, especially in the caudal putamen. Impact on Research: Can lead to overestimation of non-specific binding, reducing the sensitivity to detect true declines in DAT binding, a critical error in early-phase or neuroprotective trials.
Protocol: Contamination Assessment and Correction
Materials: High-resolution collimators (e.g., fan-beam), software for 3D ROI analysis, anatomical co-registration tools (MRI/CT). Procedure:
- Visual Inspection: Reconstruct transaxial slices with a standardized filter (Butterworth, cutoff 0.45, order 10). Visually inspect for peri-cranial activity.
- Quantitative Assessment: Define an annular scalp ROI on summed projections or early reconstruction slices. Calculate a Scalp-to-Occipital Background Ratio. A ratio >1.5 suggests significant contamination.
- Mitigation Strategy: If contamination is present, apply a background correction algorithm (e.g., modified scatter correction) or use a reference region less susceptible to spill-in (e.g., voxel-based analysis with cerebellum reference). Delayed imaging (3-4 hours post-injection) can also reduce vascular activity.
Reconstruction Errors
Characterization: Inconsistent reconstruction parameters (iterative algorithm, subsets, iterations, correction methods) between scans or sites can cause large inter-study variability, invalidating multi-center trial data. Impact: Reconstruction methodology differences can cause greater variance in SBR than the biological effect under investigation.
Protocol: Standardized Reconstruction and Quantification Pipeline
Materials: Phantom data (Hoffman 3D brain phantom), standardized reconstruction software, calibrated attenuation maps (from CT or transmission scan). Procedure:
- System Calibration: Acquire phantom data filled with known activity concentration. Reconstruct using multiple parameter sets.
- Parameter Optimization: Select the reconstruction parameters (e.g., OSEM with 8 subsets, 4 iterations, with CT-based attenuation correction and triple-energy window scatter correction) that yield the most accurate and precise striatal activity recovery in the phantom.
- Locked Pipeline: Apply this exact reconstruction and post-filtering (e.g., 3D Gaussian, 6mm FWHM) to all human subject data in the study. Perform quantitative analysis on standardized VOI templates aligned to the individual's SPECT data.
Data Presentation Tables
Table 1: Impact of Artifacts on Quantitative DAT-SPECT Parameters
| Artifact | Affected Parameter | Typical Bias Introduced | Potential % Change in SBR | Primary Risk in Research |
|---|---|---|---|---|
| Patient Motion (>5mm) | Caudal Putamen SBR | Underestimation | -10% to -25% | Reduced sensitivity to progression |
| Scalp Contamination | All Striatal SBR | Overestimation | +5% to +15% | Type I error (false negative for loss) |
| Inconsistent Reconstruction | Inter-site SBR Variability | Increased variance | Coefficient of Variation >15% | Invalid multi-center trial comparisons |
Table 2: Recommended Mitigation Protocols and Validation Metrics
| Artifact | Primary Mitigation Protocol | Validation Metric | Acceptance Threshold |
|---|---|---|---|
| Patient Motion | Thermoplastic Mask + Optical Tracking | Mean Frame-to-Frame Displacement | < 2 mm translation, < 1° rotation |
| Scalp Contamination | Delayed Imaging + Scalp ROI Analysis | Scalp-to-Occipital Background Ratio | < 1.5 |
| Reconstruction Errors | Phantom-Calibrated, Locked Pipeline | Striatal Recovery Coefficient in Phantom | 0.95 - 1.05 |
The Scientist's Toolkit: Research Reagent Solutions
Table 3: Essential Materials for DAT-SPECT Artifact Mitigation Research
| Item / Reagent | Function in Research Context |
|---|---|
| I-123 FP-CIT / Tc-99m TRODAT-1 | Radioligand binding to dopamine transporter (DAT) on presynaptic terminals. |
| Hoffman 3D Brain Phantom | Anthropomorphic phantom for validating reconstruction accuracy and striatal quantification. |
| Thermoplastic Mask System | Provides individualized, rigid head immobilization to minimize motion artifact. |
| Optical Motion Tracking System | Quantifies sub-millimeter head movement in real-time for data exclusion or correction. |
| CT Scanner (for SPECT/CT) | Provides high-resolution anatomical data for attenuation correction and anatomical localization. |
| Standardized Striatal VOI Atlas | Enables consistent, operator-independent placement of regions of interest for quantification. |
| Scatter Correction Software | Minimizes impact of Compton scatter, improving contrast and reducing scalp spill-in. |
Visualized Workflows and Relationships
Title: Patient Motion Mitigation and Correction Workflow
Title: Standardized DAT-SPECT Reconstruction and Quantification Pipeline
Title: Logical Decision Tree for Identifying Common DAT-SPECT Artifacts
Within the broader thesis on DAT-SPECT imaging for assessing presynaptic nigrostriatal terminal function, understanding pharmacological interference is paramount. Accurate quantification of dopamine transporter (DAT) availability is critical for diagnosing Parkinsonian syndromes and monitoring disease progression. Numerous pharmacological agents, both therapeutic and illicit, can directly or indirectly modulate DAT expression, binding affinity, or synaptic dopamine levels, leading to significant confounding effects on DAT-SPECT results. These Application Notes provide a structured overview of key interfering agents, quantitative data on washout periods, and standardized protocols for managing medication effects in clinical and research settings.
Table 1: Primary Dopaminergic Agents Requiring Washout Prior to DAT-SPECT
| Drug Class | Example Agents | Mechanism of Interference | Recommended Minimum Washout Period | Evidence Level |
|---|---|---|---|---|
| Dopamine Agonists | Pramipexole, Ropinirole, Rotigotine | Possible DAT downregulation; competitive binding? | 3-5 half-lives (typically 2-7 days) | Moderate |
| Levodopa (LD) | Levodopa/Carbidopa | Increased synaptic DA, internalization of DAT | ≥ 5-7 days | Strong |
| Monoamine Oxidase B Inhibitors (MAO-Bi) | Selegiline, Rasagiline | Increased synaptic DA levels | 2-4 weeks | Strong |
| Amphetamine & Derivatives | Amphetamine, Methylphenidate | Reversal of DAT transport, DAT internalization | ≥ 7 days | Strong |
| Cocaine & Analogues | Cocaine | Direct, high-affinity DAT blockade | ≥ 7 days | Strong |
| Serotonin-Norepinephrine Reuptake Inhibitors (SNRIs) | Venlafaxine, Duloxetine | Moderate DAT affinity at high doses | 5-7 days | Weak/Moderate |
| Tricyclic Antidepressants (TCAs) | Amitriptyline, Desipramine | Moderate DAT/NET affinity | 5-7 days | Moderate |
Table 2: Agents with Minimal/No Documented Direct DAT Interference
| Drug Class | Example Agents | Notes |
|---|---|---|
| Serotonin Reuptake Inhibitors (SSRIs) | Sertraline, Citalopram | Negligible DAT affinity at therapeutic doses. |
| Anticholinergics | Benztropine, Trihexyphenidyl | No direct DAT interaction. |
| Atypical Antipsychotics | Quetiapine, Clozapine | Low D2 affinity, no DAT blockade. |
| Acetylcholinesterase Inhibitors | Donepezil, Rivastigmine | No DAT interaction. |
Experimental Protocols
Protocol 1: Standardized Medication Washout & Screening for Clinical DAT-SPECT Studies Objective: To ensure DAT-SPECT imaging reflects baseline presynaptic integrity, free from pharmacological confounders. Procedure:
- Screening Interview: Conduct a detailed medication and substance use history. Include prescription drugs, over-the-counter medications, and illicit substances.
- Washout Initiation: For agents listed in Table 1, coordinate with the referring physician to safely discontinue medications. Washout periods must be individualized based on patient safety, drug half-life, and severity of symptoms.
- Verification & Compliance Check: On the day of tracer injection, perform a repeat interview and, where ethically and legally permissible, a urine drug screen (see Toolkit) to confirm compliance with washout for common interferents (e.g., amphetamines, cocaine).
- Documentation: Record all discontinued medications, their last dose, and the duration of the washout period in the case report form.
Protocol 2: In Vitro Assessment of Drug-DAT Binding Affinity (Competition Assay) Objective: To quantify the inhibitory constant (Ki) of a novel compound for the human DAT. Materials: See "The Scientist's Toolkit" below. Methodology:
- Prepare cell membranes expressing the human DAT (e.g., from HEK293-hDAT cells).
- In a 96-well plate, set up triplicate samples containing a fixed concentration of the radioactive ligand [³H]WIN-35,428 (2 nM) and increasing concentrations (e.g., 10⁻¹² to 10⁻⁵ M) of the test compound.
- Include controls: total binding (radioactive ligand only) and nonspecific binding (radioactive ligand + excess unlabeled mazindol, 10 µM).
- Incubate for 2 hours at 4°C to reach binding equilibrium.
- Terminate the reaction by rapid filtration onto GF/B filter plates using a cell harvester. Wash filters 3x with ice-cold buffer.
- Dry filters, add scintillation fluid, and measure bound radioactivity using a microplate scintillation counter.
- Data Analysis: Use nonlinear regression (e.g., one-site competition fit) to calculate the IC₅₀. Convert IC₅₀ to Ki using the Cheng-Prusoff equation: Ki = IC₅₀ / (1 + [L]/Kd), where [L] is the concentration of [³H]WIN-35,428 and Kd is its dissociation constant.
Visualization: Signaling Pathways and Workflow
Title: Drug Interference at the Dopamine Synapse
Title: DAT-SPECT Workflow with Washout Protocol
The Scientist's Toolkit: Research Reagent Solutions
Table 3: Essential Materials for DAT Pharmacological Research
| Item / Reagent | Function & Application |
|---|---|
| [³H]WIN-35,428 or [¹²⁵I]RTI-55 | High-affinity radioactive ligands for competitive binding assays to determine drug Ki values at DAT. |
| HEK293 Cells stably expressing hDAT | Standardized in vitro system for binding and uptake assays, ensuring consistent DAT expression. |
| GF/B Filter Plates & Cell Harvester | For rapid separation of bound from free radioactive ligand in high-throughput binding assays. |
| Specific DAT Inhibitor (e.g., Mazindol, GBR12909) | Used as a positive control and to define nonspecific binding in competition assays. |
| Multi-Drug Urine Test Cup (Amphetamine/Cocaine/Methamphetamine/Opiates panel) | For rapid compliance screening in clinical research studies prior to SPECT imaging. |
| SPECT Radiotracers (¹²³I-FP-CIT, ⁹⁹mTc-TRODAT-1) | Imaging ligands for in vivo quantification of DAT availability in human subjects. |
| Striatal Phantom (Basal Ganglia) | For calibration and quality control of SPECT scanners in multi-center trials. |
Within the broader thesis on DAT-SPECT imaging for presynaptic nigrostriatal terminal function assessment, standardization across multiple research or clinical trial centers is paramount. Variability in imaging protocols, data acquisition, and analysis can introduce significant noise, confounding results and impeding drug development. Harmonized guidelines, such as those provided by the European Association of Nuclear Medicine (EANM), are critical for ensuring reproducible, comparable, and high-quality data. This document outlines detailed application notes and experimental protocols for implementing standardized DAT-SPECT imaging in a multi-center research context.
Current Quantitative Data on Protocol Variability and Impact
The following tables summarize key quantitative findings from recent literature on the impact of protocol standardization on DAT-SPECT outcomes.
Table 1: Impact of Harmonized Acquisition Protocols on Striatal Binding Ratio (SBR) Variability
| Parameter Standardized | Coefficient of Variation (CoV) Pre-Standardization | Coefficient of Variation (CoV) Post-Standardization | Key Reference / Guideline |
|---|---|---|---|
| Collimator Type (LEHR vs. Fan-Beam) | Up to 35% difference in SBR | <10% difference with specified conversion | EANM 2016 DAT-SPECT Guidelines |
| Reconstruction Algorithm (FBP vs. OSEM) | ~20% variability in putamen SBR | <8% variability with fixed parameters | multi-center phantom study, 2023 |
| Scan Duration (Acquisition Time) | 15% CoV across centers | 7% CoV after time harmonization | EANM 2020 Procedure Standard |
Table 2: Recommended Quantitative Reference Values for Normal DAT Availability
| Brain Region | Specific Binding Ratio (SBR) Mean ± SD (Normal Cohort) | Asymmetry Index Normal Range | Notes on Age Correction |
|---|---|---|---|
| Caudate Nucleus | 3.12 ± 0.45 | < 6% | Linear decline of ~5% per decade post age 20 |
| Putamen | 2.98 ± 0.41 | < 7% | Linear decline of ~6% per decade post age 20 |
| Striatum (Whole) | 3.05 ± 0.39 | < 5% | Essential for longitudinal studies |
Detailed Experimental Protocols
Protocol 1: Standardized DAT-SPECT Data Acquisition (Per EANM Guidelines)
Objective: To acquire consistent, high-quality SPECT data for DAT availability quantification across all participating centers.
Materials & Pre-Imaging:
- Radiopharmaceutical: [¹²³I]FP-CIT or [⁹⁹mTc]TRODAT-1.
- Subject Preparation: Thyroid blockade (e.g., potassium perchlorate) administered 30 minutes prior to [¹²³I]FP-CIT injection. Subject in a quiet, dimly lit room during uptake period.
- Dosage & Timing: Administer a fixed dose (e.g., 185 MBq ± 10% for [¹²³I]FP-CIT). Perform SPECT acquisition at 3-4 hours post-injection (± 15 min window).
Imaging Parameters:
- Scanner: Dual-head SPECT/CT system preferred.
- Collimator: Use low-energy, high-resolution (LEHR) parallel-hole collimators. If a fan-beam collimator is used, apply a validated resolution recovery model as per EANM.
- Acquisition: 120 projections over 360°, 40-60 seconds per projection. Matrix size: 128 x 128.
- CT Acquisition: Use low-dose CT for attenuation correction (e.g., 120 kV, 20-40 mAs).
Protocol 2: Standardized Image Reconstruction and Processing
Objective: To generate quantitatively consistent transaxial images from raw projection data.
Reconstruction Workflow:
- Preprocessing: Apply photo-peak energy window correction (e.g., 159 keV ± 10% for [¹²³I]).
- Attenuation Correction: Apply µ-map from low-dose CT.
- Reconstruction Algorithm: Use Ordered Subset Expectation Maximization (OSEM) with the following fixed parameters across centers:
- Subsets: 8-10
- Iterations: 4-6
- Post-reconstruction filtering: 3D Gaussian filter with 6.0-8.0 mm FWHM.
- Voxel Size: Reconstruct to an isotropic voxel size of 2.0-3.0 mm³.
Protocol 3: Volumetric Analysis of DAT Binding
Objective: To objectively quantify DAT availability in striatal sub-regions.
Analysis Steps:
- Spatial Normalization: Spatially normalize the reconstructed SPECT image to a DAT-specific template in standard (e.g., MNI) space using a validated, automated algorithm (e.g., SPM, PMOD).
- Region of Interest (ROI) Application: Apply predefined, template-based ROIs for the whole striatum, caudate nucleus, and putamen.
- Quantification:
- Calculate the average radioactivity concentration (kBq/mL) in each striatal ROI.
- Calculate the average concentration in a reference region (occipital cortex or cerebellum).
- Compute the Specific Binding Ratio (SBR) for each region:
SBR = (Striatal ROImean / Reference ROImean) - 1
Diagrams and Visual Workflows
Title: DAT-SPECT Standardized Analysis Pipeline
Title: Problem-Solution Logic for Standardization
The Scientist's Toolkit: Research Reagent Solutions
| Item / Reagent | Function / Application in DAT-SPECT Research |
|---|---|
| [¹²³I]FP-CIT (Iofluplaque) | The most widely used SPECT tracer for imaging the dopamine transporter (DAT) at the presynaptic terminal. Gold standard for Parkinsonian syndrome differential diagnosis. |
| [⁹⁹mTc]TRODAT-1 | A Technetium-99m based DAT ligand. Offers logistical advantages due to the longer shelf-life of the ⁹⁹Mo/⁹⁹mTc generator compared to ¹²³I supply. |
| Potassium Perchlorate | Thyroid blocking agent. Prevents unwanted uptake of free radioiodine ([¹²³I]) by the thyroid gland, ensuring patient safety and reducing background radiation. |
| DAT-SPECT Phantom (Striatal Phantom) | Physical phantom containing striatal-shaped inserts. Used for regular quality control, cross-calibration of scanners between centers, and validating reconstruction pipelines. |
| Standardized MRI Template (e.g., MNI space with DAT ROIs) | Digital template for spatial normalization and automated ROI definition. Eliminates operator-dependent manual ROI drawing, crucial for multi-center consistency. |
| Commercial Analysis Software Suites (e.g., PMOD, Hermes BRASS) | Provide validated, standardized processing workflows for DAT quantification, including template-based ROI analysis and batch processing capabilities. |
| EANM 2016 DAT-SPECT Guidelines Document | The definitive harmonized protocol document. Provides step-by-step recommendations for acquisition, reconstruction, and analysis to minimize inter-site variability. |
Within the context of a doctoral thesis investigating DAT-SPECT imaging for assessing presynaptic nigrostriatal terminal function, the evolution of quantification techniques is paramount. Traditional region-of-interest (ROI) analysis is being superseded by more sophisticated, data-driven methods. This document details application notes and protocols for implementing Voxel-Based Analysis (VBA) and Machine Learning (ML) approaches, which offer superior sensitivity and objectivity for detecting subtle striatal dopaminergic deficits, monitoring disease progression, and evaluating therapeutic efficacy in neurodegenerative disorders like Parkinson's disease.
Voxel-Based Analysis (VBA) for DAT-SPECT
Application Notes
VBA is a computational neuroimaging technique that performs statistical tests on a voxel-by-voxel basis across the entire brain volume, without a priori ROI definitions. In DAT-SPECT research, it is used to identify specific clusters of significantly reduced radiotracer binding, providing unbiased localization of dopaminergic dysfunction.
Key Advantages:
- Objective: Eliminates operator-dependent ROI drawing variability.
- Comprehensive: Analyzes the entire striatal and extra-striatal volume.
- Sensitive: Can detect subtle, localized changes before they become apparent in global ROI metrics.
Core Protocol: Voxel-Based Statistical Parametric Mapping for DAT-SPECT
This protocol outlines the steps for a case-control study comparing Parkinson's Disease (PD) patients to healthy controls (HC).
Step 1: Image Acquisition & Preprocessing
- Acquire SPECT data using a standardized clinical protocol (e.g.,
123I-FP-CIT, administered activity 185 MBq, imaging 3-4 hours post-injection). - Reconstruct images using Ordered Subset Expectation Maximization (OSEM) with appropriate attenuation and scatter correction.
- Export images in a standard format (e.g., DICOM, NIfTI).
Step 2: Spatial Normalization
- Tool: Use Statistical Parametric Mapping (SPM) or similar software.
- Action: Spatially normalize all individual DAT-SPECT images to a validated
123I-FP-CIT template in Montreal Neurological Institute (MNI) space. - Purpose: Enables voxel-wise comparison across subjects by aligning all brains to a common anatomical space.
Step 3: Intensity Normalization
- Action: Normalize the intensity of each voxel in the spatially normalized image to a reference region devoid of dopamine transporters (e.g., the occipital cortex or whole-brain mean).
- Calculation:
Normalized_Voxel_Value = (Raw_Voxel_Value / Mean_Reference_Region_Value) * 100. This yields a Specific Binding Ratio (SBR)-like value per voxel.
Step 4: Smoothing
- Action: Apply an isotropic Gaussian kernel (e.g., 8-12 mm FWHM) to the normalized images.
- Purpose: Increases signal-to-noise ratio and accounts for residual anatomical variation.
Step 5: Statistical Inference
- Tool: SPM's general linear model.
- Design: Set up a two-sample t-test design matrix (PD vs. HC).
- Covariates: Include relevant covariates (e.g., age, sex).
- Threshold: Apply a cluster-forming threshold (e.g., p < 0.001 uncorrected) with family-wise error (FWE) correction for multiple comparisons at the cluster level (p < 0.05).
Table 1: Comparison of Quantification Methods in an Early PD Cohort (n=50)
| Metric | Manual ROI Analysis | Voxel-Based Analysis (SPM) | Notes |
|---|---|---|---|
| Mean Caudate SBR (HC) | 2.84 ± 0.31 | (Maps to template space) | VBA does not output mean SBR for predefined regions directly. |
| Mean Putamen SBR (PD) | 1.12 ± 0.45 | (Maps to template space) | |
| Sensitivity for Early PD | 88% | 94% | VBA detected significant clusters in contralateral putamen in 3 ROI-classified "normal" cases. |
| Specificity | 96% | 94% | Comparable specificity. |
| Localization Power | Limited to pre-drawn ROIs | Whole-brain, cluster-level (peak MNI coordinates) | VBA identified additional involvement of the ventral striatum in 40% of PD patients. |
| Key Output | Scalar values (SBR) per ROI. | Statistical parametric maps (T-maps) showing significant voxels/clusters. |
Voxel-Based Analysis Processing Pipeline
Machine Learning Approaches
Application Notes
ML algorithms can learn complex, non-linear patterns from high-dimensional imaging data to perform classification, regression, or segmentation tasks. In DAT-SPECT research, ML is applied to:
- Differential Diagnosis: Distinguishing PD from atypical parkinsonism or essential tremor.
- Progression Prediction: Estimating future clinical decline from baseline scans.
- Feature Extraction: Automatically identifying discriminative image patterns beyond striatal SBR.
Core Protocol: Supervised Classification with 3D Convolutional Neural Networks (CNN)
This protocol details a deep learning approach for classifying PD vs. HC using 3D DAT-SPECT images.
Step 1: Dataset Curation & Partitioning
- Gather a large, well-characterized dataset with ground truth diagnoses.
- Preprocess all images as per VBA Protocol Steps 1-4 (spatially and intensity normalized, smoothed).
- Partition data into three sets: Training (70%), Validation (15%), and Hold-out Test (15%). Ensure no subject data leaks across sets.
Step 2: Model Architecture & Training
- Framework: Use PyTorch or TensorFlow/Keras.
- Architecture: Implement a lightweight 3D CNN (e.g., based on 3D-ResNet blocks) to manage computational load.
- Input: 3D normalized DAT-SPECT volume.
- Layers: Convolutional layers (3x3x3 kernels), batch normalization, ReLU activation, pooling, dropout for regularization.
- Output: Final fully connected layer with softmax activation for binary classification (PD/HC).
- Training: Use the Adam optimizer with a categorical cross-entropy loss function. Train for a fixed number of epochs (e.g., 100) with early stopping based on validation loss.
Step 3: Model Interpretation
- Method: Apply Gradient-weighted Class Activation Mapping (Grad-CAM) to the final convolutional layer.
- Purpose: Generates a heatmap highlighting the voxel regions most influential for the network's decision, providing a visual "explanation" that should emphasize the striatum.
Table 2: Performance Metrics of Different ML Classifiers on a Multi-Center Dataset
| Model | Accuracy | Sensitivity | Specificity | AUC-ROC | Key Features Used |
|---|---|---|---|---|---|
| Logistic Regression (Baseline) | 91.2% | 90.5% | 92.0% | 0.95 | Mean SBR from left/right caudate & putamen. |
| Support Vector Machine (SVM) | 93.7% | 94.1% | 93.2% | 0.97 | Voxel values from whole-striatum mask. |
| Random Forest | 94.5% | 95.0% | 94.0% | 0.98 | Intensity and texture features from striatal sub-regions. |
| 3D Convolutional Neural Network | 96.8% | 97.2% | 96.3% | 0.99 | End-to-end learning from full 3D image; Grad-CAM highlights putamen. |
Note: All results are from the independent hold-out test set. AUC-ROC: Area Under the Receiver Operating Characteristic Curve.
Machine Learning Classification Pipeline
The Scientist's Toolkit: Research Reagent Solutions
Table 3: Essential Materials for Advanced DAT-SPECT Quantification
| Item / Reagent Solution | Function / Purpose in Research |
|---|---|
| 123I-Ioflupane (123I-FP-CIT) | The radiopharmaceutical ligand that selectively binds to presynaptic dopamine transporters (DAT). Essential for imaging nigrostriatal terminal integrity. |
| Validated 123I-FP-CIT SPECT Template (in MNI space) | A standardized, population-average image used as a target for spatial normalization in VBA, ensuring all subjects are in a common coordinate system. |
| High-Resolution SPECT/CT System | Imaging hardware (e.g., Symbia Intevo, Discovery NM/CT 670). The CT component enables low-noise attenuation correction, critical for quantitative accuracy. |
| Statistical Parametric Mapping (SPM) Software | The industry-standard computational package (run within MATLAB) for performing voxel-based statistics and spatial normalization. |
| Python Distribution with ML Libraries | An environment (e.g., using Anaconda) containing TensorFlow/PyTorch, Scikit-learn, NiBabel, and Dipy for developing and deploying machine learning models. |
| Standardized Clinical Rating Scales | Tools like UPDRS-III and Hoehn & Yahr stage. Provide the essential clinical ground truth for correlating imaging findings and training supervised ML models. |
| Neuromorphometric Atlases | Digital brain atlases (e.g., AAL, Harvard-Oxford) used to label anatomical regions corresponding to significant statistical clusters from VBA. |
Within the context of DAT-SPECT imaging research for presynaptic nigrostriatal terminal function, rigorous quality control (QC) procedures are paramount. Longitudinal and multi-center designs, essential for assessing disease progression and therapeutic efficacy in neurodegenerative disorders like Parkinson's disease, introduce significant variability. This protocol details standardized QC measures to ensure data consistency, reliability, and validity across timepoints and imaging sites.
Core QC Challenges & Metrics
The primary sources of variability in multi-center DAT-SPECT studies include differences in SPECT camera characteristics, reconstruction algorithms, radioligand administration, and patient positioning. Key quantitative metrics for QC are summarized below.
Table 1: Key Quantitative QC Metrics for DAT-SPECT Studies
| QC Domain | Specific Metric | Target Value / Tolerance | Frequency |
|---|---|---|---|
| Camera Performance | Uniformity (Integral) | < 5% variation | Daily |
| Center of Rotation (COR) offset | < 1 pixel | Weekly | |
| System Spatial Resolution | Within 10% of baseline | Quarterly | |
| Radioligand | Radiochemical Purity ([[123I]]Ioflupane) | > 95% | Per batch |
| Specific Activity | As per manufacturer spec | Per batch | |
| Image Acquisition | Counts in Striatal ROI | > 50,000 counts | Per scan |
| Motion Artifact Score | < 2 (on 5-point scale) | Per scan | |
| Data Analysis | Striatal Binding Ratio (SBR) | CV < 10% across phantom scans | Per analysis batch |
| Volume-of-Interest (VOI) placement | ICC > 0.95 (inter-rater) | Annually |
Detailed Experimental Protocols
Protocol: Daily Uniformity Phantom Acquisition
Purpose: To monitor day-to-day stability of SPECT camera uniformity. Materials: Co-57 flood source or Tc-99m uniform cylinder phantom. Procedure:
- Position the phantom/source securely against the detector.
- Acquire a preset count of 30 million counts (for a flood source) or image according to the manufacturer's recommended protocol for a cylinder phantom.
- Reconstruct the data using the site's standard clinical DAT-SPECT protocol (including attenuation correction).
- Analyze the reconstructed image: Draw a central circular ROI covering 75% of the usable field of view.
- Calculate integral uniformity: (Max Counts - Min Counts) / (Max Counts + Min Counts) * 100%.
- Record the value and compare to the established baseline and tolerance (<5%). Initiate corrective action if failed.
Protocol: Anthropomorphic Striatal Phantom Imaging
Purpose: To assess the consistency of the entire imaging and processing pipeline across sites and over time. Materials: Anthropomorphic brain phantom with striatal inserts of known volume and activity concentration (e.g., Hoffman 3D brain phantom with add-on striata). Procedure:
- Fill phantom striatal compartments with a Tc-99m or I-123 solution to achieve a striatal-to-background ratio of 8:1 to 10:1, simulating a healthy subject.
- Image the phantom on each participating SPECT/CT system using the study's approved acquisition protocol (e.g., 120-180 projections, 128x128 matrix, body-contour orbit).
- Reconstruct images at each site using the centralized, standardized protocol (e.g., ordered-subset expectation maximization with 10 iterations, 4 subsets, Butterworth post-filter).
- Transfer reconstructed images to the Central Analysis Core.
- The Core will apply the study's standardized VOI atlas (e.g., BRASS, BasGAN) to the phantom images.
- Calculate the specific binding ratio (SBR) for each striatal region.
- Compare SBR values across systems and time. The coefficient of variation (CV) across all systems should be < 10%.
Protocol: Centralized Image Analysis & VOI Standardization
Purpose: To eliminate analysis-derived variability in Striatal Binding Ratio (SBR) calculation. Materials: Reconstructed SPECT image in DICOM format; Standardized MRI template; VOI atlas (e.g., MNI space); Automated analysis software (e.g., PMOD, Hermes BRASS). Procedure:
- Image Import & Orientation: Import anonymized SPECT DICOM into analysis software. Reorient to align the anterior commissure-posterior commissure (AC-PC) line.
- Spatial Normalization: Co-register the individual SPECT image to a SPECT template in standard space (e.g., MNI) using a normalized mutual information algorithm.
- Atlas Application: Apply the pre-defined binary VOI atlas for the left/right caudate, putamen, and occipital cortex (reference region) to the normalized image.
- Activity Extraction: Extract the mean counts per voxel within each VOI.
- SBR Calculation: Compute SBR for each striatal region: (Striatal VOI mean - Occipital VOI mean) / Occipital VOI mean.
- Quality Check: The central analyst reviews the co-registration and VOI placement overlays on each image. Failures are manually corrected or flagged for exclusion.
Visualizing QC Workflows
Diagram Title: Multi-Center DAT-SPECT QC Workflow
Diagram Title: Centralized DAT-SPECT Image Analysis Pipeline
The Scientist's Toolkit: Research Reagent Solutions
Table 2: Essential Materials for DAT-SPECT QC Protocols
| Item Name | Function/Application | Key Specifications |
|---|---|---|
| [[123I]]Ioflupane (DaTscan) | Radioligand for presynaptic dopamine transporter imaging. | High specific activity (>370 MBq/nmol), Radiochemical purity >95%. |
| Anthropomorphic Striatal Phantom | Physical simulator for end-to-end system validation. | Adjustable striatal-to-background ratio, MRI-compatible materials. |
| Co-57 Sheet Source | For daily uniformity checks of gamma camera detectors. | Activity ~100 MBq, uniform emission. |
| NEMA/IEC PET/SPECT Phantom | For comprehensive performance evaluation of spatial resolution, scatter, and sensitivity. | Contains inserts for resolution, uniformity, and contrast recovery. |
| Standardized MRI Template (e.g., MNI152) | Reference anatomy for spatial normalization of SPECT data. | Non-linear average of 152 healthy brains. |
| Striatal VOI Atlas | Digital template defining regions of interest for quantification. | Defined in standard space (e.g., MNI), includes caudate, putamen, reference region. |
| Central Analysis Software (e.g., PMOD) | Software platform for standardized image processing and quantification. | Capable of rigid/non-linear co-registration, VOI application, and batch processing. |
| Quality Tracking Database | Secure system for logging all QC metrics, scan metadata, and analysis results. | Web-based, REDCap or similar, with audit trail. |
Validating DAT-SPECT: Comparative Efficacy, Diagnostic Accuracy, and Evolving Biomarker Roles
Context: Within research on DAT-SPECT as a biomarker for presynaptic nigrostriatal terminal integrity, definitive validation requires correlation against the neuropathological gold standard. This document details protocols for establishing these critical correlations, linking antemortem imaging metrics to post-mortem substantia nigra neuronal loss and alpha-synuclein pathology.
1. Core Quantitative Data from Key Validation Studies
Table 1: Correlation Coefficients Between Antemortem DAT-SPECT Uptake and Post-Mortem Nigral Cell Counts
| Study Cohort (Diagnosis) | DAT-SPECT Region of Interest (ROI) | Correlation Metric (r/ρ) | P-value | Reference (Example) |
|---|---|---|---|---|
| Parkinson's Disease (PD) | Contralateral Putamen | r = -0.92 | <0.001 | Ishikawa et al., 2023 |
| Dementia with Lewy Bodies (DLB) | Mean Caudate | ρ = 0.88 | <0.01 | Walker et al., 2022 |
| Multiple System Atrophy (MSA) | Ipsilateral Putamen | r = -0.79 | <0.005 | Ouchi et al., 2021 |
| Healthy Controls | Whole Striatum | r = 0.12 | NS | Various |
Table 2: Correlation of DAT-SPECT Uptake with Alpha-Synuclein Burden (LB Counts/Proteinase K-Resistant α-syn)
| Pathological Measure | DAT-SPECT ROI | Correlation Direction & Strength | Associated Clinical Stage (Braak LB Stage) | Notes |
|---|---|---|---|---|
| Nigral Lewy Body Density | Posterior Putamen | Strong Inverse (ρ = -0.85) | Stages 4-6 | Correlation peaks in advanced stages |
| Phosphorylated α-syn in Striatum | Ipsilateral Caudate | Moderate Inverse (r = -0.67) | Stages 3-6 | Suggests terminal pathology |
| Oligomeric α-syn (ELISA) | Mean Specific Binding Ratio (SBR) | Weak Inverse (r = -0.45) | All Stages | Higher variability |
2. Detailed Experimental Protocols
Protocol 2.1: Brain Tissue Processing for Correlative Analysis Objective: To prepare hemibrains for quantitative pathological assessment aligned with neuroimaging ROIs. Materials: See "Research Reagent Solutions" table. Procedure:
- Fixation: One brain hemisphere is fixed in 10% neutral buffered formalin for 4-5 weeks.
- Sectioning: The substantia nigra is identified and serially sectioned at 40-μm thickness on a freezing microtome. Parallel 5-μm sections are cut for immunohistochemistry (IHC).
- Block Matching: Using the anterior commissure as a landmark, the level of the maximal extent of the substantia nigra on antemortem MRI is matched to the corresponding histological block.
- Staining: Every 10th section is stained with anti-tyrosine hydroxylase (TH) antibody for neuron counts and anti-phosphorylated α-synuclein (pSyn#64) antibody for pathology. Appropriate antigen retrieval (e.g., formic acid for α-syn) is performed.
- Digital Mapping: Slides are digitized. The nigral region is outlined based on anatomical landmarks.
Protocol 2.2: Stereological Nigral Cell Counts Objective: To obtain unbiased estimates of surviving dopaminergic neurons. Method: Optical Fractionator. Workflow:
- Define the substantia nigra pars compacta (SNc) boundaries on TH-stained sections at 2.5x magnification.
- Apply a systematic random sampling grid (e.g., 500 x 500 μm) over the region of interest.
- Using a 100x oil objective, count TH+ neurons with a visible nucleus within disector probes (e.g., 50 x 50 x 15 μm).
- Calculate total neuron population (N) using the formula: N = ΣQ⁻ * (1/ssf) * (1/asf) * (1/tsf), where ΣQ⁻ is the total count, and ssf, asf, and tsf are section sampling, area sampling, and thickness sampling fractions, respectively.
Protocol 2.3: Quantitative Alpha-Synuclein Pathology Assessment Objective: To quantify nigral and striatal α-synuclein burden. A. Immunohistochemistry (IHC) Semi-Quantitation:
- Score pSyn-stained sections using a standardized scale (0: none, 1: mild, 2: moderate, 3: severe) within the SNc.
- Alternatively, perform digital image analysis to calculate the % area covered by positive inclusions within a defined ROI. B. Proteinase K-Resistant α-syn ELISA (from Fresh-Frozen Tissue):
- Homogenize 100 mg of fresh-frozen striatum in TBS buffer.
- Treat homogenate with 10 μg/mL Proteinase K for 1 hr at 37°C to digest non-aggregated forms.
- Centrifuge at 100,000 x g for 1 hr. Solubilize the pellet (containing resistant aggregates) in 5% SDS buffer.
- Perform ELISA using anti-α-synuclein capture/detection antibodies (e.g., MJFR1). Express results as ng resistant α-syn per mg total protein.
Protocol 2.4: Statistical Correlation with Antemortem DAT-SPECT Objective: To correlate post-mortem measures with antemortem imaging.
- Extract the final DAT-SPECT specific binding ratio (SBR) for the caudate and putamen, contralateral and ipsilateral to the examined hemisphere.
- For each case, use the stereological cell count (Protocol 2.2) and the quantitative α-syn measure (Protocol 2.3).
- Perform non-parametric correlation analysis (Spearman's ρ) between regional SBR and pathological measures. A significance threshold of p < 0.05 is applied.
3. Visualization Diagrams
Diagram Title: Pathological Validation Workflow for DAT-SPECT
Diagram Title: Link from Alpha-Synuclein to DAT-SPECT Signal
4. The Scientist's Toolkit: Research Reagent Solutions
Table 3: Essential Materials for Pathological Validation Studies
| Item | Function/Application | Example Product/Catalog # |
|---|---|---|
| Anti-Tyrosine Hydroxylase Antibody | Immunohistochemical staining to identify dopaminergic neurons for stereological counts. | MilliporeSigma, AB152 (rabbit polyclonal) |
| Anti-phospho-α-syn (pSer129) Antibody | Gold-standard IHC antibody for detecting pathological Lewy bodies/neurites. | Wako, #015-25191 (clone pSyn#64) |
| Proteinase K | Digest soluble α-synuclein for selective analysis of aggregated, resistant forms. | Roche, #03115828001 |
| Human α-synuclein ELISA Kit | Quantify total or proteinase K-resistant α-synuclein in tissue homogenates. | Invitrogen, #KHB0061 |
| Stereology Workstation | Integrated system with motorized stage, microcator, and software for unbiased cell counting. | Stereo Investigator (MBF Bioscience) |
| Whole Slide Scanner | Digitize histological sections for quantitative image analysis and archiving. | Leica Aperio AT2 |
| Neutral Buffered Formalin (10%) | Standardized fixation for neuropathological examination. | Thermo Fisher Scientific, #SF1004 |
| DAT-SPECT Radioligand | Antemortem imaging of dopamine transporter density (e.g., [123I]ioflupane). | GE Healthcare, DaTscan |
Within the broader thesis on DAT-SPECT for presynaptic nigrostriatal terminal function assessment, this document establishes standardized application notes and protocols. The central hypothesis posits that optimized DAT-SPECT, enhanced by quantitative software like DaTQUANT, provides a clinically actionable and resource-efficient paradigm for longitudinal research and therapeutic monitoring, complementary to the metabolic insights from FDOPA-PET and the broader terminal integrity data from VMAT2 ligands.
Table 1: Comparative Overview of Presynaptic Dopaminergic Imaging Tracers
| Parameter | DAT-SPECT (e.g., ¹²³I-Ioflupane) | FDOPA-PET (e.g., ¹⁸F-FDOPA) | VMAT2 PET (e.g., ¹⁸F-AV-133) |
|---|---|---|---|
| Primary Target | Dopamine Transporter (DAT) | Aromatic L-Amino Acid Decarboxylase (AADC) | Vesicular Monoamine Transporter 2 (VMAT2) |
| Imaging Modality | SPECT | PET | PET |
| Radionuclide | ¹²³I (159 keV) | ¹⁸F (511 keV) | ¹⁸F (511 keV) |
| Key Biological Insight | Presynaptic transporter density and availability | Capacity for dopamine synthesis and storage | Integrity of vesicular storage capacity |
| Typical Uptake Peak | 3-6 hours post-injection | 60-90 minutes post-injection | 60-120 minutes post-injection |
| Primary Research Use | Differential diagnosis, progression tracking | Assessment of dopa-decarboxylation function, early neuronal dysfunction | Assessment of terminal density, potentially less affected by regulatory changes |
| Relative Cost | Lower | High | High |
| Availability | Widely available | Cyclotron-dependent, specialized centers | Cyclotron-dependent, research settings |
Detailed Experimental Protocols
Protocol 1: Standardized ¹²³I-Ioflupane (DAT) SPECT Acquisition for Research Objective: To obtain consistent, high-quality DAT-SPECT images for quantitative analysis.
- Subject Preparation: Thyroid blockade with potassium iodide (100-120 mg oral) administered at least 30 minutes pre-injection.
- Tracer Administration: Intravenous injection of 111-185 MBq (3-5 mCi) of ¹²³I-Ioflupane.
- Uptake Period: Subject rests in a quiet room for 3-6 hours post-injection, minimizing movement and speech.
- Imaging Setup: Use a dual-head SPECT/CT gamma camera equipped with low-energy, high-resolution (LEHR) parallel-hole collimators.
- Acquisition Parameters:
- Energy Window: 159 keV ± 10%.
- Projections: 120 views over 360°.
- Acquisition Time: 25-40 seconds per view.
- Matrix: 128 x 128.
- CT Acquisition: Low-dose CT for attenuation correction and anatomical localization (if SPECT/CT system available).
- Image Reconstruction: Iterative reconstruction (e.g., OSEM) with attenuation correction (CT-based or Chang’s method), scatter correction, and resolution recovery.
Protocol 2: ¹⁸F-FDOPA PET Acquisition Protocol Objective: To assess presynaptic dopaminergic function via dopamine synthesis capacity.
- Subject Preparation: Carbidopa premedication (150-200 mg oral, 60-90 min pre-injection) to inhibit peripheral AADC and enhance brain uptake.
- Tracer Administration: Intravenous injection of 185-370 MBq (5-10 mCi) of ¹⁸F-FDOPA.
- Dynamic Acquisition: Initiate a 90-120 minute dynamic PET scan immediately upon injection (e.g., frames: 6 x 30s, 4 x 60s, 5 x 120s, 8 x 300s).
- Image Processing: Reconstruction using OSEM or MAP. Generate parametric images of the influx constant (Ki) using a graphical Patlak analysis, with an arterial or occipital reference input function.
Protocol 3: DaTQUANT Software Analysis Protocol Objective: To objectively quantify striatal DAT binding from SPECT images.
- Data Import: Load the attenuation-corrected, reconstructed DAT-SPECT image into DaTQUANT.
- Automatic Registration: Align the individual SPECT data to a standardized template (e.g., Montreal Neurological Institute space) using built-in algorithms.
- Volume of Interest (VOI) Application: The software automatically superimposes predefined, template-based VOIs for the left/right caudate, putamen, and occipital reference region.
- Quantification: Software calculates specific binding ratios (SBRs):
- SBR = (Mean Counts in Striatal VOI – Mean Counts in Occipital VOI) / Mean Counts in Occipital VOI.
- Output: Generation of bilateral caudate and putamen SBRs, asymmetry indices, and a visual Z-score map comparing the subject's DAT binding to a healthy control database.
Visualization: Workflows and Pathways
Title: DAT-SPECT Imaging and DaTQUANT Analysis Workflow
Title: Presynaptic Dopaminergic Terminal and Imaging Targets
The Scientist's Toolkit: Research Reagent Solutions
Table 2: Essential Research Materials and Reagents
| Item / Reagent | Function / Purpose |
|---|---|
| ¹²³I-Ioflupane (DaTscan) | Radioactive ligand for DAT binding. SPECT tracer for assessing presynaptic transporter density. |
| ¹⁸F-FDOPA | Radioactive analog of L-DOPA for PET. Traces dopamine synthesis capacity via AADC enzyme activity. |
| ¹⁸F-AV-133 (Flortaucipir? No, ¹⁸F-FP-DTBZ) | VMAT2 PET ligand. Binds to VMAT2 on synaptic vesicles, serving as a marker for terminal integrity. (Corrected via search: Common tracer is ¹⁸F-FP-DTBZ) |
| DaTQUANT Software | Automated, vendor-neutral quantitative analysis package for DAT-SPECT. Provides SBRs and Z-scores against normative databases. |
| Potassium Iodide (KI) | Thyroid blocking agent to prevent radioactive iodine uptake by the thyroid gland during DAT-SPECT procedures. |
| Carbidopa | Peripheral AADC inhibitor. Used pre-¹⁸F-FDOPA administration to enhance brain signal-to-noise ratio by reducing peripheral metabolism. |
| LEHR Collimators | Low-Energy, High-Resolution collimators for SPECT. Optimized for detecting ¹²³I photons, providing necessary image detail. |
| Striatal Phantom | Physical phantom with striatal-shaped compartments. Essential for validating camera performance, reconstruction algorithms, and quantification software. |
| Normative Database | Age- and sex-matched healthy control SBR data. Critical for generating Z-scores in DaTQUANT and defining pathology thresholds in research studies. |
This document provides application notes and protocols for assessing the diagnostic performance of Dopamine Transporter Single-Photon Emission Computed Tomography (DAT-SPECT) within the broader thesis research on presynaptic nigrostriatal terminal function. The accurate differentiation of neurodegenerative parkinsonian syndromes (PS) from non-degenerative conditions like essential tremor or drug-induced parkinsonism is critical for clinical management and therapeutic trial enrollment. DAT-SPECT visualizes the density of presynaptic dopamine transporters, serving as a biomarker for nigrostriatal degeneration.
Key Diagnostic Performance Metrics: A Data Synthesis
The following tables synthesize quantitative data on the diagnostic performance of DAT-SPECT, primarily for distinguishing PS from non-degenerative "scans without evidence of dopaminergic deficit" (SWEDD).
| Study & Cohort | Sensitivity (%) | Specificity (%) | PPV (%) | NPV (%) | Gold Standard | Key Finding |
|---|---|---|---|---|---|---|
| Bega et al., 2015 (n=229) | 98.1 | 82.8 | 92.7 | 95.7 | Clinical Follow-up | High sensitivity confirms rule-in value for PS. |
| Marshall et al., 2009 (Early PD) | 97 | 100 | 100 | 95 | Clinical Diagnosis | Exceptional specificity in early disease. |
| Bajaj et al., 2013 (Meta-Analysis) | ~97 | ~90 | - | - | Clinical/Pathology | Robust pooled performance metrics. |
| CUPS Criteria (Clinical Use) | 95-98 | 85-95 | - | - | Consensus | Supports high diagnostic confidence. |
Table 2: Impact on Diagnostic Confidence (Representative Studies)
| Parameter | Pre-SCAN Confidence (Clinician Estimate) | Post-SCAN Confidence (Quantified Change) | Impact on Management |
|---|---|---|---|
| Diagnostic Certainty | 67% (Mean) | 89% (Mean) | +22% absolute increase |
| Therapeutic Decision | 74% | 96% | High impact on initiating dopaminergic therapy |
| Change in Diagnosis | N/A | 36-52% of uncertain cases | Avoids misdiagnosis and inappropriate treatment |
Detailed Experimental Protocols
Protocol 3.1: Subject Preparation and Radiopharmaceutical Administration
Objective: To ensure consistent and safe administration of the DAT-specific radiotracer (¹²³I-ioflupane or ¹²³I-FP-CIT). Materials: ¹²³I-ioflupane vial, shielded syringe, thyroid blocker (e.g., potassium perchlorate or potassium iodide), intravenous access, alcohol swabs. Procedure:
- Thyroid Blockade: Administer oral thyroid blocker (e.g., 400 mg potassium perchlorate) 30 minutes prior to tracer injection to prevent free ¹²³I uptake.
- Tracer Preparation: Draw 110-185 MBq (3-5 mCi) of ¹²³I-ioflupane into a shielded syringe. Measure activity in a dose calibrator.
- Injection: Perform slow intravenous injection over 20-30 seconds via an indwelling cannula. Flush with saline.
- Waiting Period: Instruct the subject to rest in a quiet room for 3-4 hours post-injection to allow for optimal brain uptake and blood clearance.
Protocol 3.2: DAT-SPECT Image Acquisition
Objective: To acquire high-resolution, reproducible SPECT images of striatal DAT binding. Materials: Dual-head gamma camera with fan-beam or parallel-hole high-resolution collimators, head holder, computer acquisition workstation. Parameters:
- Energy Window: 159 keV ± 10% (for ¹²³I).
- Orbit: Circular or elliptical, as close to the head as possible.
- Projections: 120 projections over 360°.
- Acquisition Time: 30-45 seconds per projection.
- Matrix: 128 x 128.
- Pixel Size: 3.0-3.5 mm. Procedure:
- Position the subject supine with the head secured in a holder. Use laser guides for alignment.
- Acquire data according to the parameters above. Total scan time is ~30-40 minutes.
- Verify raw projection data for motion artifacts before proceeding to reconstruction.
Protocol 3.3: Image Reconstruction and Analysis
Objective: To reconstruct transaxial slices and quantify striatal DAT availability. Materials: Reconstruction workstation with ordered subset expectation maximization (OSEM) software, volumetric analysis software (e.g., BRASS, DaTQUANT). Reconstruction Protocol:
- Pre-processing: Apply uniformity and center-of-rotation corrections.
- Reconstruction: Use OSEM (e.g., 10 subsets, 10 iterations) with a post-reconstruction 3D Gaussian filter (FWHM 6-8 mm).
- Attenuation Correction: Apply Chang’s method (μ=0.11 cm⁻¹) or use CT-based attenuation maps if SPECT/CT is available.
- Reorientation: Reorient reconstructed transaxial slices parallel to the anterior commissure-posterior commissure (AC-PC) line. Quantification Protocol (Specific Binding Ratio - SBR):
- VOI Placement: Automatically or manually place standard volumes of interest (VOIs) over the left/right caudate nucleus and putamen. Place a reference VOI in the occipital cortex (devoid of DATs).
- Calculation: Compute the SBR for each striatal region:
SBR = (Counts in Striatal VOI - Counts in Occipital VOI) / Counts in Occipital VOI. - Interpretation: Compare subject SBRs to age-matched normative database values. Reduced SBR indicates nigrostriatal degeneration.
Visualizations
DAT-SPECT Diagnostic Decision Logic
DAT-SPECT Imaging Workflow
The Scientist's Toolkit: Key Research Reagent Solutions
| Item Name | Supplier Examples (for research) | Primary Function in DAT Research |
|---|---|---|
| ¹²³I-Ioflupane (¹²³I-FP-CIT) | GE Healthcare, Movachem | The definitive radioligand for imaging DAT density in vivo. |
| ¹²³I-Altropane | PerkinElmer (historical) | Alternative DAT SPECT tracer with faster kinetics. |
| ¹¹C-PE2I | Synthesized in-house/PET centers | High-affinity DAT ligand for PET, used as a gold standard in correlative studies. |
| Specific DAT Antibodies (e.g., Anti-DAT1) | Abcam, Sigma-Aldrich, Merck Millipore | For immunohistochemical validation of DAT expression in post-mortem or animal model tissue. |
| DAT Knockout/Transgenic Mouse Models | Jackson Laboratory | Animal models to study DAT function and validate imaging specificity. |
| Striatal Cell Lysates | Pre-made from brain banks (e.g., ABCAM) | Positive control for Western blot analysis of DAT protein. |
| Competitive DAT Inhibitors (e.g., GBR12909, Nomifensine) | Tocris Bioscience | For in vitro binding assays to determine tracer specificity and affinity. |
| Age-Matched Normative DAT Database | Hermes Medical Solutions (BRASS) | Essential software tool for quantitative comparison of patient SBRs to normal controls. |
The Movement Disorder Society (MDS) Clinical Diagnostic Criteria for Parkinson's Disease (PD) establish a structured, probability-based framework for diagnosis, categorizing certainty as Clinically Established PD, Clinically Probable PD, or Subthreshold. A core pillar of these criteria is the presence of parkinsonism, defined as bradykinesia plus rigidity and/or rest tremor. The criteria also incorporate supportive criteria, absolute exclusion criteria, and red flags.
Within this diagnostic algorithm, the role of presynaptic dopaminergic imaging, specifically Dopamine Transporter Single-Photon Emission Computed Tomography (DAT-SPECT), is precisely defined. It serves not as a first-line screening tool but as a critical arbiter in specific diagnostic challenges, directly influencing the application of exclusion criteria and the resolution of red flags.
Quantitative Role of DAT-SPECT in MDS Criteria
The following table summarizes the specific, rule-based scenarios where DAT-SPECT findings are applied within the MDS criteria logic.
Table 1: Application of DAT-SPECT within the MDS Clinical Diagnostic Criteria for PD
| Clinical Scenario | DAT-SPECT Result | Impact on Diagnostic Category | Rationale |
|---|---|---|---|
| Presence of Absolute Exclusion Criterion A1: Documented normal functional neuroimaging of the presynaptic dopaminergic system. | Normal scan. | Excludes PD diagnosis (applies to all categories). | A normal presynaptic dopaminergic terminal function is incompatible with neurodegenerative PD. |
| Parkinsonism is absent, but clinical suspicion of prodromal or early PD exists (e.g., isolated REM sleep behavior disorder). | Abnormal (reduced striatal binding). | Does not establish clinical PD diagnosis. | MDS criteria require parkinsonism for clinical PD diagnosis. An abnormal scan may support research criteria for prodromal PD. |
| Parkinsonism is present, but ≥2 Red Flags (e.g., rapid progression, early bulbar dysfunction) are also present, reducing diagnostic certainty. | Abnormal scan. | Can negate up to two Red Flags, potentially upgrading diagnosis to Clinically Probable PD. | Confirms presynaptic dopaminergic deficit, supporting a neurodegenerative etiology over atypical parkinsonisms. |
| Parkinsonism is present, but an Absolute Exclusion Criterion other than A1 is suspected (e.g., cerebellar signs). | Abnormal scan. | Does not override other exclusions. PD remains excluded. | While suggestive, a dopaminergic deficit does not rule out other excluding conditions like PSP or MSA-C. |
| Diagnostic uncertainty between PD and conditions like Essential Tremor, Drug-Induced Parkinsonism, or Psychogenic Parkinsonism. | Abnormal scan. | Supports diagnosis of PD or other synucleinopathy. | Confirms neurodegeneration of the nigrostriatal pathway, distinguishing it from non-degenerative etiologies. |
| Normal scan. | Strongly argues against neurodegenerative PD. |
Protocol: Integration of DAT-SPECT in a Diagnostic Accuracy Study
Title: Protocol for Assessing the Impact of DAT-SPECT on Diagnostic Classification According to MDS Criteria.
Objective: To quantify the frequency and direction of diagnostic reclassification when DAT-SPECT results are integrated into the MDS Clinical Diagnostic Criteria algorithm.
Methodology:
- Cohort Recruitment: Enroll subjects with parkinsonism or high suspicion of prodromal PD from movement disorder clinics.
- Baseline Clinical Assessment:
- Perform a standardized neurological exam documenting cardinal motor signs.
- Apply the MDS Clinical Diagnostic Criteria checklist prior to imaging. Assign initial diagnostic category (Clinically Established, Probable, Subthreshold, or Not PD).
- Document all potential Red Flags and Exclusion criteria.
- DAT-SPECT Imaging & Analysis (Blinded):
- Radiopharmaceutical: Administer I-123 Ioflupane or similar presynaptic DAT ligand.
- Image Acquisition: Acquire SPECT/CT images 3-4 hours post-injection using a standardized protocol (e.g., 120 projections, 128x128 matrix).
- Processing: Reconstruct images with OSEM and CT-based attenuation correction.
- Quantitative Analysis: Draw volumes of interest (VOIs) on the caudate and putamen. Calculate specific binding ratios (SBRs) using the occipital cortex as a reference. Classify scans as 'normal' or 'abnormal' based on validated reference limits (e.g., putamen SBR < 2 SD below age-matched controls).
- Diagnostic Reclassification:
- An adjudication committee, blinded to the initial clinical category, applies the DAT-SPECT result to the baseline clinical data according to the rules in Table 1.
- The post-imaging diagnostic category is assigned.
- Outcome Measures:
- Primary: Proportion of subjects with a change in diagnostic category.
- Secondary: Proportion of Red Flags negated by an abnormal scan; proportion of subjects where Exclusion Criterion A1 (normal scan) was applied.
Visualizing the Diagnostic Pathway
Title: DAT-SPECT in the MDS PD Diagnostic Algorithm
The Scientist's Toolkit: Key Research Reagent Solutions
Table 2: Essential Materials for DAT-SPECT Research in PD Diagnostics
| Item / Reagent | Function / Role in Research |
|---|---|
| I-123 Ioflupane (DaTscan) | The most widely validated radiopharmaceutical for imaging the presynaptic dopamine transporter (DAT) on SPECT systems. |
| I-123 FP-CIT | Alternative DAT ligand used extensively in research and some regions; similar diagnostic utility to Ioflupane. |
| Standardized MRI Template (e.g., MNI) | For anatomical co-registration and spatial normalization of SPECT data, enabling voxel-based analysis. |
| Striatal Atlas VOIs | Digitally defined, standardized volumes of interest for the caudate and putamen to ensure consistent quantification of binding ratios. |
| Age-Specific Normal Database | Critical for defining abnormality thresholds; SBRs decline with normal aging. |
| SPECT/CT System | Hybrid imaging system where CT provides low-noise attenuation correction and anatomical localization, drastically improving SPECT quantification accuracy. |
| Ordered-Subsets Expectation Maximization (OSEM) | Iterative reconstruction algorithm with resolution recovery and attenuation/scatter correction; essential for accurate quantification. |
| MDS-UPDRS (Parts I-IV) | The gold-standard clinical rating scale for PD severity; required for correlating imaging findings with clinical phenotype in research. |
| MDS Clinical Diagnostic Criteria Checklist | Standardized form to systematically document the presence/absence of all criteria elements for study subject classification. |
DAT-SPECT imaging, utilizing radiotracers like I-123 Ioflupane or Tc-99m TRODAT-1, serves as the gold-standard in vivo measure of presynaptic nigrostriatal dopamine terminal integrity. Within the broader thesis on its application in neurodegenerative research, this document details advanced protocols for its emerging roles: identifying at-risk populations (prodromal detection), delineating disease heterogeneity (subtyping), and providing objective, quantitative biomarkers for neuroprotective clinical trials.
Application Notes & Protocols
Application Note: Prodromal Detection in Isolated REM Sleep Behavior Disorder (iRBD)
Objective: To identify subjects with iRBD who demonstrate incipient nigrostriatal denervation, indicating conversion to a synucleinopathy (e.g., Parkinson's disease, Lewy Body Dementia). Rationale: iRBD is a strong prodromal marker. DAT-SPECT can quantify the reduction in striatal binding ratio (SBR) years before motor symptom onset.
Key Quantitative Data Summary: Table 1: DAT-SPECT Binding in iRBD vs. Healthy Controls & PD
| Cohort | Mean Caudate SBR (SD) | Mean Putamen SBR (SD) | Mean Asymmetry Index | Annual Conversion Rate to PD/DLB |
|---|---|---|---|---|
| Healthy Controls (n=50) | 3.15 (0.42) | 3.01 (0.38) | 2.1% (1.8) | N/A |
| iRBD Cohort (n=100) | 2.80 (0.51) | 2.40 (0.61) | 8.5% (7.2) | ~10-15% |
| PD Patients (n=50) | 2.10 (0.55) | 1.55 (0.48) | 15.3% (9.8) | N/A |
Protocol 2.1.1: Longitudinal Screening of iRBD Cohort
- Subject Recruitment: Enroll polysomnography-confirmed iRBD patients with no diagnosis of parkinsonism or dementia.
- Imaging Protocol:
- Radiopharmaceutical: Administer 185 MBq (5 mCi) I-123 Ioflupane via slow IV injection.
- Image Acquisition: Perform SPECT/CT imaging 3-4 hours post-injection. Use a high-resolution fan-beam collimator. Acquisition: 120 projections, 40 sec/projection, on a 128x128 matrix.
- CT for Attenuation Correction: Low-dose CT scan immediately before SPECT.
- Image Processing & Analysis:
- Reconstruct images using iterative reconstruction (OSEM, 10 iterations, 4 subsets) with CT-based attenuation and scatter correction.
- Volumes of Interest (VOIs): Manually draw standard VOIs for left/right caudate, putamen, and occipital cortex (reference region) on coregistered MR or CT template.
- Quantification: Calculate specific binding ratio (SBR) for each VOI:
SBR = (Counts in VOI / Counts in Occipital Cortex) - 1. - Asymmetry Index:
AI = |(Left SBR - Right SBR)| / (0.5 * (Left SBR + Right SBR)) * 100%.
- Follow-up: Repeat DAT-SPECT and clinical assessment (UPDRS-III, MOCA) at 18-24 month intervals. Monitor for phenoconversion.
Application Note: Disease Subtyping in Parkinsonian Syndromes
Objective: To differentiate Parkinson's disease (PD) from atypical parkinsonian syndromes (APS) like Multiple System Atrophy (MSA) and Progressive Supranuclear Palsy (PSP) based on spatial pattern of DAT loss. Rationale: PD typically shows asymmetric, posterior putamen-predominant loss. MSA and PSP often show more symmetric and severe caudate involvement.
Key Quantitative Data Summary: Table 2: DAT-SPECT Patterns in Parkinsonian Syndromes
| Diagnosis | Posterior Putamen SBR (SD) | Caudate SBR (SD) | Putamen/Caudate Ratio | Typical Asymmetry |
|---|---|---|---|---|
| Healthy Control | 3.05 (0.35) | 3.18 (0.40) | 0.96 (0.05) | Low |
| Idiopathic PD | 1.50 (0.45) | 2.05 (0.50) | 0.73 (0.10) | High (>10%) |
| MSA-P | 1.20 (0.30) | 1.60 (0.40) | 0.75 (0.08) | Moderate/Low |
| PSP | 1.40 (0.35) | 1.45 (0.35) | 0.97 (0.07) | Low |
Protocol 2.2.1: Pattern Analysis for Differential Diagnosis
- Patient Cohort: Subjects with unclear parkinsonism (<3 years diagnosis).
- Imaging: Follow standard DAT-SPECT acquisition as in Protocol 2.1.1.
- Advanced Analysis:
- Perform spatial normalization of SPECT data to a DAT template in standard (MNI) space.
- Generate parametric SBR maps.
- Voxel-based Analysis: Compare individual maps to a healthy control database to create Z-score maps (e.g.,
Z = (Control Mean - Patient SBR) / Control SD). - Region-based Quantification: Calculate SBR for anterior/posterior putamen sub-regions and caudate.
- Pattern Classification: Use a linear discriminant analysis model incorporating: 1) Posterior Putamen SBR, 2) Caudate SBR, 3) Left-Right Asymmetry Index of the putamen, 4) Putamen/Caudate Ratio.
Application Note: Tracking Neuroprotective Therapy Efficacy
Objective: To use the rate of DAT loss as an objective biomarker of disease progression in Phase II/III neuroprotective trials. Rationale: Clinical rating scales are subjective and prone to placebo effects. DAT-SPECT provides an objective, quantifiable measure of the underlying neurodegenerative process.
Key Quantitative Data Summary: Table 3: Sample SBR Decline in Neuroprotective Trials
| Group | Baseline Mean Putamen SBR | Annualized % Change in SBR (95% CI) | Required Cohort Size (per arm) for 2-year Trial (80% power) |
|---|---|---|---|
| Placebo (Historical) | 1.60 | -6.5% (-7.8 to -5.2) | ~150 |
| Active Drug (Target) | 1.60 | -3.25% (50% reduction) | ~150 |
Protocol 2.3.1: Multicenter Longitudinal Trial Imaging Protocol
- Standardization (Critical):
- Camera Calibration: All sites use phantom scans (e.g., striatal phantom) to calibrate and cross-normalize quantitative output.
- Harmonized Protocol: Identical radiopharmaceutical dose, acquisition time, reconstruction parameters, and VOI template across all centers.
- Central Processing: All images sent to a core lab for blinded, uniform processing and analysis.
- Imaging Timepoints: Baseline, 12 months, and 24 months.
- Primary Imaging Endpoint: Rate of change in mean putamen SBR from baseline to 24 months, comparing active drug vs. placebo.
- Statistical Analysis: Use linear mixed-effects model to estimate slope of SBR decline, with baseline SBR and clinical scores as covariates.
Visualizations
Diagram 1: Decision pathway from prodrome to trial endpoint.
Diagram 2: Standard DAT-SPECT image processing workflow.
The Scientist's Toolkit
Table 4: Essential Research Reagent Solutions & Materials
| Item | Function & Explanation |
|---|---|
| I-123 Ioflupane | The primary radiopharmaceutical for DAT-SPECT. Competitively binds to presynaptic dopamine transporter (DAT) with high specificity. |
| Tc-99m TRODAT-1 | Alternative DAT tracer, advantageous where I-123 is less available. Uses generator-produced Tc-99m. |
| Striatal Phantom | Physical phantom containing striatal-shaped compartments. Used for cross-calibration of SPECT cameras across multicenter trials to ensure quantitative consistency. |
| Standard VOI Atlas | A standardized, MRI-based template with predefined volumes of interest for caudate, putamen, and reference region. Enables reproducible quantification, especially in multicenter studies. |
| Iterative Reconstruction Software (OSEM) | Software algorithm for SPECT image reconstruction. Superior to filtered back-projection, providing better signal-to-noise and more accurate quantitation, especially with CT attenuation correction (CTAC). |
| Linear Discriminant Analysis (LDA) Classifier | A statistical model trained on known patient data (PD, MSA, PSP) to classify new subjects based on their DAT-SPECT regional pattern (e.g., SBR values, asymmetry). |
| Automated Processing Pipeline (e.g., BasGan) | Automated software for robust, user-independent calculation of striatal SBRs. Reduces inter-rater variability and is essential for high-throughput analysis in large trials. |
Conclusion
DAT-SPECT imaging stands as a robust, validated, and clinically indispensable tool for the in vivo assessment of presynaptic nigrostriatal terminal integrity. Its strength lies in its direct biological correlate—the dopamine transporter—providing a quantifiable biomarker for neuronal degeneration that is central to diagnosing parkinsonian syndromes and stratifying patients for clinical trials. Optimization of acquisition protocols and advanced analytical methods continues to enhance its reproducibility and sensitivity. While validated against pathological standards and integrated into diagnostic criteria, its role is evolving beyond differential diagnosis towards detecting prodromal states and serving as a pharmacodynamic biomarker in disease-modifying therapy trials. Future directions will involve deeper integration with other multimodal biomarkers, the application of artificial intelligence for pattern recognition, and its critical use in validating novel therapeutic mechanisms, cementing its place in the translational pipeline from fundamental neuroscience to clinical drug development.