Adenosine Measurement in Neuroscience Research: FSCV vs. Microdialysis - A Comprehensive Technical Comparison
This article provides a detailed comparison of Fast-Scan Cyclic Voltammetry (FSCV) and microdialysis for measuring adenosine in the brain, two pivotal techniques in neuroscience and drug development.
Adenosine Measurement in Neuroscience Research: FSCV vs. Microdialysis - A Comprehensive Technical Comparison
Abstract
This article provides a detailed comparison of Fast-Scan Cyclic Voltammetry (FSCV) and microdialysis for measuring adenosine in the brain, two pivotal techniques in neuroscience and drug development. It covers foundational principles of adenosine as a neuromodulator, the core methodologies and practical applications of each technique, strategies for troubleshooting and optimizing measurements, and a rigorous validation and comparative analysis of their temporal resolution, sensitivity, and invasiveness. Aimed at researchers and pharmaceutical scientists, it serves as a guide for selecting the optimal method for specific adenosine-related research questions.
Understanding Adenosine Dynamics: Why Precise Measurement is Crucial for Neuroscience and Drug Development
Publish Comparison Guide: FSCV vs. Microdialysis for Adenosine Measurement
Accurate measurement of extracellular adenosine is critical for understanding its neuromodulatory roles. This guide compares the performance of two principal in vivo techniques: Fast-Scan Cyclic Voltammetry (FSCV) and Microdialysis.
Table 1: Performance Comparison of FSCV and Microdialysis for Adenosine Measurement
| Feature | Fast-Scan Cyclic Voltammetry (FSCV) | Microdialysis |
|---|---|---|
| Temporal Resolution | Sub-second to seconds (High) | Minutes to tens of minutes (Low) |
| Spatial Resolution | Micrometer-scale (High) | Millimeter-scale (Low) |
| Technique Type | Direct, electrochemical detection | Indirect, sample collection with offline analysis |
| Selectivity | Moderate (Requires waveform optimization & validation) | High (Couples with HPLC-MS for definitive identification) |
| Invasiveness | Moderate (Microelectrode implantation) | High (Large probe implantation, tissue damage) |
| Primary Readout | Real-time concentration changes (Δ) | Absolute basal concentrations |
| Key Limitation | Difficulty distinguishing adenosine from metabolites (e.g., inosine) without advanced waveforms. | Poor recovery of rapidly changing signals; cannot track phasic release. |
| Typical Experimental Data (Rat Basal Ganglia) | Tonic ~50-100 nM; Phasic transients can reach 200-500 nM. | Reported basal levels vary widely from 10 nM to 500 nM due to methodological differences. |
Detailed Experimental Protocols
Protocol 1: Adenosine Measurement via FSCV with a Adenosine-Tuned Waveform
- Electrode Preparation: Fabricate carbon-fiber microelectrodes (5-7 µm diameter). Apply a triangular waveform (e.g., -0.4 V to 1.45 V and back, 400 V/s) at 10 Hz for background stabilization.
- Waveform Optimization: Use an adenosine-specific waveform (e.g., Eapplied: -0.4 V → 1.45 V → -0.4 V, scan rate 1000 V/s) to oxidize adenosine at ~1.4 V.
- In Vivo Implantation: Stereotactically implant the working electrode, an Ag/AgCl reference, and a stainless-steel auxiliary electrode into the target brain region (e.g., striatum).
- Data Acquisition & Analysis: Apply the waveform. Adenosine oxidation appears as a characteristic peak in background-subtracted cyclic voltammograms. Convert current to concentration using in vitro calibration (e.g., 1-10 µM adenosine in aCSF).
Protocol 2: Adenosine Measurement via Microdialysis with HPLC-MS/MS
- Probe Implantation: Implant a concentric microdialysis probe (e.g., 2-4 mm membrane) into the target region. Perfuse with artificial cerebrospinal fluid (aCSF) at 1-2 µL/min.
- Equilibration: Allow the system to equilibrate for 60-120 minutes post-surgery.
- Sample Collection: Collect dialysate fractions every 10-30 minutes into vials containing preservative (e.g., chelating agent) to prevent degradation.
- Offline Analysis: Inject samples into an HPLC system coupled to a mass spectrometer (LC-MS/MS). Separate analytes on a reverse-phase column (C18). Quantify adenosine by multiple reaction monitoring (MRM) using a stable isotope-labeled internal standard (e.g., 13C10-adenosine).
- Recovery Correction: Perform in vitro recovery assessment of the probe to estimate true extracellular concentration (rarely done in vivo).
Visualizations
Title: FSCV vs. Microdialysis for Adenosine
Title: Adenosine Metabolism and Signaling
The Scientist's Toolkit: Key Research Reagent Solutions
| Item | Function in Adenosine Research |
|---|---|
| Carbon-Fiber Microelectrodes | The working electrode for FSCV; provides the conductive, microscale surface for adenosine oxidation. |
| Adenosine-Specific FSCV Waveform | An optimized voltage application pattern that enhances selectivity for adenosine over other electroactive compounds (e.g., ascorbate, metabolites). |
| Stable Isotope-Labeled Adenosine (e.g., 13C10) | Internal standard for LC-MS/MS microdialysis analysis; essential for accurate quantification by correcting for recovery and ionization variability. |
| Ectoenzyme Inhibitors (e.g., ABPP, α,β-methylene-ADP) | Used in microdialysis perfusate to inhibit extracellular metabolism of ATP/ADP to adenosine, stabilizing measured levels. |
| Adenosine Receptor Agonists/Antagonists (e.g., CGS 21680, SCH 58261) | Pharmacological tools to manipulate A1 or A2A receptor activity when studying adenosine's functional effects. |
| Adenosine Deaminase Inhibitor (e.g., EHNA) | Added to microdialysis samples or aCSF to prevent enzymatic degradation of adenosine post-collection. |
Thesis Context: FSCV vs. Microdialysis for Adenosine Measurement
Adenosine is a critical neuromodulator involved in sleep regulation, neuroprotection, and response to injury. Its signaling is characterized by rapid, transient extracellular fluctuations (seconds) and very low basal concentrations (nanomolar range), presenting a unique measurement challenge. This guide compares two primary in vivo sensing methodologies—Fast-Scan Cyclic Voltammetry (FSCV) and Microdialysis—within this specific context.
Performance Comparison: FSCV vs. Microdialysis for Adenosine
Table 1: Core Methodological Comparison
| Feature | Fast-Scan Cyclic Voltammetry (FSCV) | Microdialysis |
|---|---|---|
| Temporal Resolution | Sub-second to seconds (≈0.1-10 s) | Minutes to tens of minutes (5-20 min) |
| Spatial Resolution | Excellent (micrometer-scale) | Poor (millimeter-scale probe footprint) |
| Basal Level Measurement | Challenging; better for transient detection. | Standard; provides stable baseline. |
| Invasiveness | Low (single carbon-fiber microelectrode). | High (larger semi-permeable membrane probe). |
| Chemical Specificity | Requires waveform optimization & verification (e.g., via enzyme). | High with coupled analysis (HPLC, MS). |
| Ability to Track Rapid Dynamics | Excellent. Directly measures phasic, release-event transients. | Poor. Temporal blurring of fast signals. |
| Typical Experimental Duration | Hours to 1-2 days. | Days with stable perfusion. |
| Key Technical Demand | Waveform design, real-time data processing, electrode calibration. | Probe recovery calibration, low-flow systems, sensitive offline analysis. |
Table 2: Experimental Performance Data from Recent Studies
| Parameter | FSCV Performance (Adenosine) | Microdialysis Performance (Adenosine) | Supporting Study Context |
|---|---|---|---|
| Measured Basal Level | Often near limit of detection; inferred from transients. | 50 – 300 nM in rat brain. | Microdialysis: Benchmarked with no-net-flux. FSCV: Focus on event-driven changes. |
| Response Time to Electrical Stimulation | Peak adenosine increase within 1-4 seconds post-stimulus. | Measured increase in the sample collected 5-10 minutes post-stimulus. | Focal stimulation in striatum/hippocampus. |
| Reported "Recovery" Efficiency | Not applicable (direct adsorption/oxidation). | ~10-20% with low-flow rate (0.1-1 µL/min) probes. | Critical for microdialysis quantitation; varies by probe design. |
| Impact of Tissue Damage on Signal | Initial implant trauma, stabilizes quickly (~30 min). | Significant and prolonged; requires long equilibration (1-2 hrs). | Glial scarring and perturbation of analyte diffusion. |
Experimental Protocols for Key Comparisons
Protocol 1: FSCV for Transient Adenosine Detection
- Objective: Measure rapid, stimulus-evoked adenosine release in vivo.
- Electrode: Carbon-fiber microelectrode (≈7 µm diameter, 100-200 µm length).
- Waveform: Applied vs. Ag/AgCl reference: -0.4V to 1.5V and back to -0.4V at 400 V/s, repeated at 10 Hz.
- Implantation: Stereotactic placement into target brain region (e.g., rat striatum).
- Calibration: Post-experiment calibration in adenosine standards (0.5-2 µM) in artificial cerebrospinal fluid (aCSF).
- Data Analysis: Background subtraction, principal component analysis (PCA) for signal discrimination from pH or other electroactive species (e.g., dopamine).
Protocol 2: Quantitative Microdialysis for Basal Adenosine
- Objective: Determine steady-state extracellular adenosine concentration.
- Probe: Concentric design with 1-4 mm semi-permeable membrane (e.g., 20 kDa cutoff).
- Perfusion: aCSF at ultra-low flow rate (0.1-1 µL/min) to enhance relative recovery.
- Equilibration: 1-2 hours post-implantation before sample collection.
- Quantification Method: No-Net-Flux or Reverse Dialysis. Perfusate spiked with known adenosine concentrations (e.g., 0, 50, 100, 200 nM). Collected dialysate analyzed via HPLC with UV or fluorescence detection, or LC-MS/MS.
- Calculation: Plot recovered vs. perfused concentration. The point of equilibrium (where recovered = perfused) estimates true extracellular concentration.
Signaling Pathway & Experimental Workflow
Diagram 1: Adenosine Signaling & Method Selection Flow (Max width: 760px)
The Scientist's Toolkit: Key Research Reagent Solutions
Table 3: Essential Materials for Adenosine Measurement Studies
| Item | Function & Relevance |
|---|---|
| Carbon-Fiber Microelectrodes | The sensing element for FSCV. Small diameter minimizes tissue damage. |
| Tri-enzyme Polymer (e.g., ADA+Nx+SAHH) | Coated on FSCV electrodes to enhance specificity for adenosine over other purines. |
| Adenosine Receptor Antagonists (e.g., DPCPX, SCH58261) | Pharmacological tools to validate adenosine's role in observed signals or effects. |
| Low-Flow Microdialysis Probes & Pumps | Enable high relative recovery (>15%) of adenosine, crucial for accurate basal measurement. |
| HPLC Column (C18 Reverse Phase) | Essential for separating adenosine from other purines in dialysate prior to detection. |
| Adenosine Deaminase Inhibitor (e.g., EHNA) | Added to microdialysis vials/perfusate to prevent rapid enzymatic degradation of sampled adenosine. |
| Artificial Cerebrospinal Fluid (aCSF) | Physiological perfusion medium for both techniques. Must be ion-balanced and oxygenated. |
| Calibration Standards (Adenosine, ATP, etc.) | Required for quantitative calibration of both FSCV (post-hoc) and microdialysis (no-net-flux). |
Core Principles and Measurement Paradigms
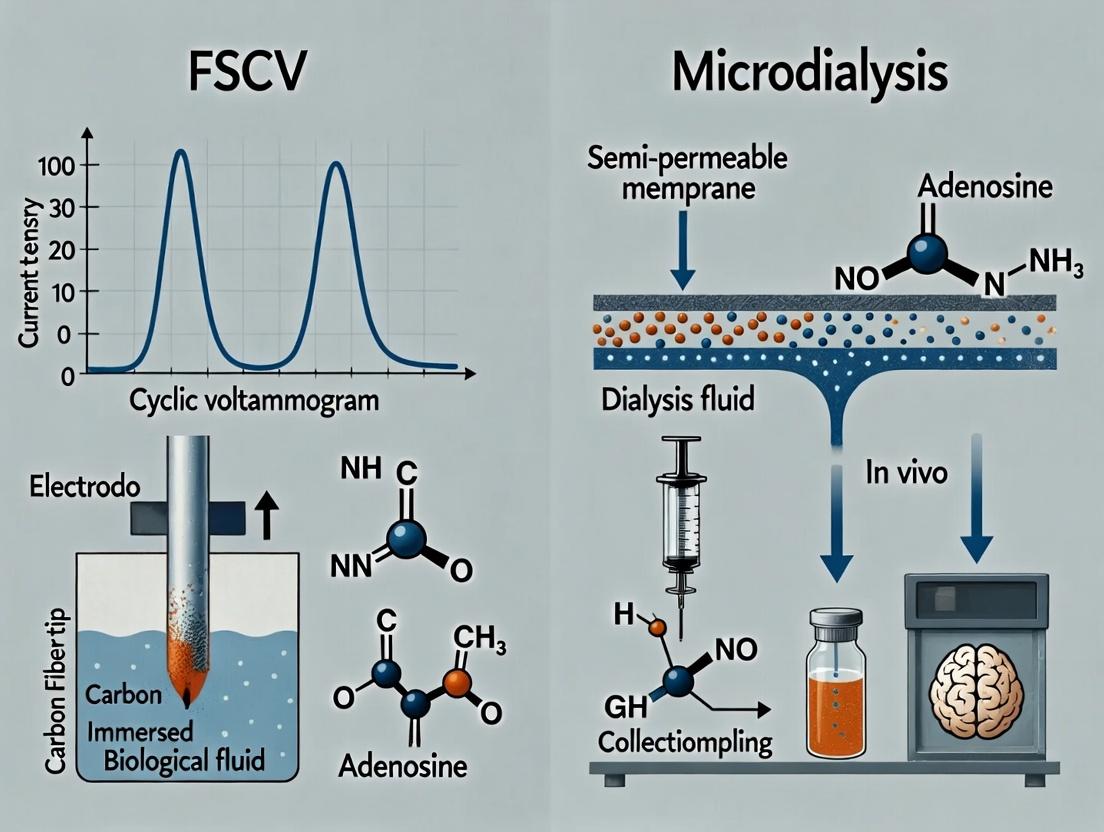
Fast-Scan Cyclic Voltammetry (FSCV) is an electrochemical technique where a carbon-fiber microelectrode is implanted into tissue and a rapid, triangular voltage waveform is applied. This induces redox reactions of electroactive molecules, generating a time-resolved current. The resulting cyclic voltammogram serves as a chemical fingerprint, allowing for analyte identification and concentration measurement with sub-second (100 ms) temporal resolution. It is primarily an electrochemical sensing method.
Microdialysis is a diffusion-based sampling technique. A probe with a semipermeable membrane is implanted into tissue and perfused with a physiologically compatible solution. Molecules from the extracellular fluid diffuse across the membrane into the dialysate, which is collected for offline or online analysis (typically via HPLC or LC-MS). It provides direct chemical samples but with poor temporal resolution (minutes). It is a biochemical sampling method.
| Feature | Fast-Scan Cyclic Voltammetry (FSCV) | Microdialysis |
|---|---|---|
| Core Principle | Electrochemical redox at an implanted electrode | Diffusion-based sampling via a semipermeable membrane |
| Temporal Resolution | Sub-second to seconds (100-1000 ms) | Minutes (typically 5-20 min per sample) |
| Spatial Resolution | Excellent (microns; single electrode tip) | Good (millimeters; membrane length) |
| Chemical Selectivity | Moderate to High (based on voltammetric signature); limited to electroactive species. | Very High (depends on analytical detector); can measure virtually any molecule. |
| Invasiveness | Low (thin carbon fiber, ~7 µm diameter) | Moderate (larger probe, ~200+ µm diameter) |
| Primary Analytes | Catecholamines (DA, NE), serotonin, adenosine, histamine, pH, O₂ | Neurotransmitters, neuromodulators, metabolites, peptides, drugs |
| Quantification | Semi-quantitative (requires calibration in vitro). Sensitive to local tissue environment. | Quantitative (absolute concentrations via no-net-flux or low-flow methods). |
| Key Advantage | Real-time, in vivo kinetics of rapid neurotransmission. | Broad, multiplexed neurochemical profiling. |
| Key Limitation | Limited chemical scope; signal interpretation can be complex. | Poor temporal resolution; relative recovery issues. |
Experimental Protocols for Adenosine Measurement
Protocol 1: FSCV for Transient Adenosine Detection
- Electrode Preparation: Carbon-fiber microelectrodes are fabricated by aspirating a single carbon fiber into a glass capillary, which is then pulled and sealed. The fiber is cut to a length of 50-100 µm.
- Waveform Application: A triangular waveform is applied (-0.4 V to +1.5 V and back vs Ag/AgCl, 400 V/s, 10 Hz). Adenosine oxidation occurs at ~+1.4 V on the forward scan.
- In Vivo Implantation: The electrode, with a Ag/AgCl reference, is stereotaxically implanted into the brain region of interest (e.g., striatum, hippocampus).
- Data Acquisition & Analysis: Current is recorded continuously. Adenosine is distinguished from other electroactive species (e.g., dopamine, pH shifts) by its unique voltammetric signature (oxidation peak potential). Background subtraction is critical.
- Calibration: Post-experiment, the electrode is calibrated in a flow cell with known adenosine concentrations (e.g., 0.5-5 µM) in artificial cerebrospinal fluid (aCSF).
Protocol 2: Microdialysis for Basal Adenosine Measurement
- Probe Implantation & Recovery: A guide cannula is surgically implanted. After 24-48 hours of recovery, a microdialysis probe (e.g., 1-2 mm membrane) is inserted.
- Perfusion: The probe is perfused with aCSF (e.g., 1 mM Mg²⁺, 1.2 mM Ca²⁺, pH 7.4) at a low flow rate (0.5-2 µL/min) to maximize recovery.
- Sample Collection: After a 1-2 hour equilibration period, dialysate is collected in vials at 5-20 minute intervals. Samples are immediately frozen or analyzed.
- Analytical Separation & Detection: Dialysate is analyzed via HPLC coupled to UV or tandem mass spectrometry (LC-MS/MS). A C18 column is used with an isocratic or gradient mobile phase.
- Quantification: Absolute extracellular concentration is determined using the no-net-flux method: the probe is perfused with varying concentrations of adenosine, and the point where inflow = outflow (zero concentration change) indicates the true tissue concentration.
Supporting Experimental Data Comparison
Table: Key Performance Metrics for Adenosine Measurement
| Metric | FSCV | Microdialysis | Supporting Data & Citation |
|---|---|---|---|
| Temporal Resolution (Reported) | ~1-4 seconds | 5-30 minutes | Swamy & Venton (2007) Anal. Chem.; Pajski & Venton (2013) ACS Chem Neurosci. |
| Baseline Concentration | Challenging to measure; detects transients. | Reliable measurement (e.g., ~100-300 nM in rat striatum). | Pajski & Venton (2010) J Neurochem.; Ballarin et al. (1991) J Neurochem. |
| Detection Limit | ~10-50 nM in vivo (for transients) | ~0.1-1 nM (post-HPLC/LC-MS) | Cechova & Venton (2008) J Neurosci Methods; HPLC-UV limit ~5nM |
| Response to Stimulus | Rapid adenosine release (<2s) after electrical or behavioral stimulus. | Slow, integrated increase over minutes post-stimulus. | Nguyen et al. (2014) ACS Chem Neurosci.; Huston et al. (1996) Neuroscience |
| Pharmacological Challenge | Can track second-by-second changes after drug injection (e.g., reuptake inhibitor). | Shows net concentration change over time post-drug. | Venton et al. (2003) J Neurochem.; Melani et al. (2012) Purinergic Signal. |
Visualizations
Title: FSCV Data Collection Workflow
Title: Microdialysis Sampling and Analysis Workflow
Title: Research Questions and Applications Framework
The Scientist's Toolkit: Essential Research Reagents & Materials
Table: Key Reagents and Materials for Adenosine Measurement Studies
| Item | Function | Typical Example / Specification |
|---|---|---|
| Carbon Fiber | The sensing element for FSCV. Provides a surface for adenosine oxidation. | Polyacrylonitrile (PAN)-based, 7-10 µm diameter. |
| Ag/AgCl Wire | Reference electrode for FSCV. Provides a stable voltage reference point. | Chloridized silver wire, 0.25 mm diameter. |
| Artificial CSF (aCSF) | Physiological perfusion fluid for microdialysis and in vitro calibration. | Contains NaCl, KCl, NaHCO₃, MgCl₂, CaCl₂, pH 7.4. |
| Microdialysis Probe | Semi-permeable hollow fiber for in vivo sampling. | CMA-style, 1-4 mm membrane length, 20kDa MWCO. |
| Adenosine Standard | For electrode/detector calibration and in vitro testing. | High-purity powder, dissolved in aCSF or mobile phase. |
| Enzyme Inhibitors | Prevent degradation of adenosine in dialysate. | Erythro-9-(2-hydroxy-3-nonyl)adenine (EHNA) for adenosine deaminase. |
| HPLC Column | Separates adenosine from other compounds in dialysate. | Reverse-phase C18 column, 2.1 x 150 mm, 3 µm particle size. |
| LC-MS/MS Mobile Phase | Solvent system for adenosine separation and ionization. | Methanol/water with 0.1% formic acid. |
Historical Context and Evolution of Adenosine Measurement Techniques
Adenosine, a ubiquitous purine nucleoside, functions as a key neuromodulator and a metabolic regulator. Accurate measurement of its rapid, spatially localized fluctuations in vivo is critical for understanding its role in physiology, neurobiology, and pathology. This guide compares the two dominant in vivo sampling techniques—Fast-Scan Cyclic Voltammetry (FSCV) and Microdialysis—framed within their historical evolution and their application in adenosine research.
Historical Timeline and Technological Evolution
| Era | Dominant Technique | Key Innovation | Limitation for Adenosine |
|---|---|---|---|
| 1970s-1980s | Bioassay / Radioimmunoassay | Tissue bath or antibody-based detection from collected samples. | Low temporal/spatial resolution, invasive sample collection. |
| 1990s-2000s | Microdialysis | Continuous sampling of extracellular fluid via semi-permeable membrane. | Minute-to-minute temporal resolution (~10-20 min samples), low spatial resolution, relative measure. |
| 2000s-Present | Fast-Scan Cyclic Voltammetry (FSCV) | High-speed electrochemical detection at carbon-fiber microelectrodes. | Selective detection challenge, electrode fouling, measures only electroactive species. |
| 2010s-Present | Enzyme-Linked FSCV | Integration of enzyme-coated electrodes (e.g., adenosine deaminase) for selectivity. | Increased complexity, potential for slower response due to enzyme kinetics. |
| 2020s-Present | Multimodal Platforms | Combination of FSCV with electrophysiology or improved microdialysis assays (UHPLC-MS/MS). | Technical complexity, data integration challenges. |
Performance Comparison: FSCV vs. Microdialysis for Adenosine
The following table synthesizes experimental data from recent literature comparing core performance metrics.
Table 1: Direct Comparison of FSCV and Microdialysis for In Vivo Adenosine Measurement
| Performance Metric | Fast-Scan Cyclic Voltammetry (FSCV) | Microdialysis | Supporting Experimental Data & Citation Context |
|---|---|---|---|
| Temporal Resolution | Sub-second to seconds (100 ms - 1 s) | Minutes (5 - 20 min per sample) | FSCV detects adenosine transients evoked by sensory stimulation within 1-2s. Microdialysis baseline samples typically require 10-30 min collection. |
| Spatial Resolution | Micrometer scale (carbon fiber tip ~5-10 µm diameter) | Millimeter scale (membrane length 1-4 mm) | FSCV measures from highly localized brain nuclei. Microdialysis samples from a larger tissue volume, causing diffusion blur. |
| Absolute vs. Relative | Provides relative concentration changes (current in nA). Calibration to absolute values (µM) is post hoc. | Can provide absolute extracellular concentrations (nM-µM) via analytical calibration. | Microdialysis recoveries (10-20%) are estimated in vitro, introducing uncertainty. FSCV signals are proportional to surface concentration. |
| Selectivity | Moderate to High with waveform optimization and enzyme-linked electrodes. Must distinguish from other electroactive species (e.g., adenosine metabolites). | Very High when coupled to HPLC or LC-MS/MS. Chromatography separates adenosine from interferents. | Enzyme-linked FSCV (ADA/MEAs) shows >95% signal loss upon enzyme inhibition. LC-MS/MS can distinguish adenosine from structurally similar molecules. |
| Invasiveness / Tissue Damage | Low (thin carbon fiber insertion). | Moderate to High (larger probe implantation, fluid perfusion). | Histology shows significantly less gliosis around carbon fiber tracks vs. microdialysis probes. |
| Suitability for Behavioral Studies | Excellent. Compatible with freely moving subjects, rapid events. | Poor. Tubing restricts movement, temporal resolution mismatches behavior. | FSCV has been used to link subsecond adenosine changes to sleep-wake transitions. Microdialysis is used for stable-state behavioral correlations. |
| Pharmacokinetic/Pharmacodynamic (PK/PD) Studies | Excellent for rapid PD (receptor antagonist effects). | Excellent for sustained PK (drug level monitoring alongside analyte). | FSCV showed adenosine increase within seconds of applying transporter blocker. Microdialysis tracked hour-long adenosine changes during drug infusion. |
| Primary Limitation | Measures only electroactive analytes; complex data interpretation. | Low temporal resolution; relative recovery estimation; large probe size. |
Detailed Experimental Protocols
Protocol 1: Adenosine Measurement using Enzyme-Linked FSCV in Rat Striatum
- Objective: Detect transient, behaviorally-evoked adenosine release.
- Electrode Preparation: A carbon-fiber microelectrode (7 µm diameter) is coated with a layer of Nafion, followed by a cross-linked mixture of adenosine deaminase (ADA) and glutamate oxidase (GluOx). ADA converts adenosine to inosine (electroactive at a different potential), allowing for differential measurement.
- FSCV Parameters: Triangular waveform applied from -0.4 V to 1.5 V and back at 400 V/s, repeated at 10 Hz.
- Surgery & Implantation: Electrode is implanted in the striatum of an anesthetized or freely-moving rat. An Ag/AgCl reference electrode is placed in contralateral brain.
- Stimulation & Data Acquisition: Electrical stimulation (60 Hz, 2s) is applied to a nearby region or a behavioral event is triggered. Current is recorded at the oxidation peak potential for inosine (generated from adenosine).
- Data Analysis: Background-subtracted cyclic voltammograms identify the inosine signature. Concentration is estimated via post-experiment calibration in adenosine standards.
Protocol 2: Adenosine Measurement using High-Performance Microdialysis coupled to UHPLC-MS/MS
- Objective: Quantify basal extracellular adenosine levels and response to systemic drug administration.
- Probe Implantation: A concentric microdialysis probe (membrane: 4 mm, 20 kDa MWCO) is implanted in the rat prefrontal cortex and perfused with artificial cerebrospinal fluid (aCSF) at 1.0 µL/min.
- Sample Collection: After 24-hr recovery, dialysate is collected every 20 minutes into vials containing chelating agent to prevent degradation.
- Analytical Method: Dialysate samples (5-10 µL) are injected directly into an UHPLC system. Adenosine is separated on a reverse-phase column (C18, 2.1 x 50 mm, 1.7 µm) and detected via tandem mass spectrometry (MS/MS) using multiple reaction monitoring (MRM).
- Quantification: Absolute concentration is determined by comparing peak areas to a standard curve. Recovery is estimated via retro-dialysis (perfusing a known concentration of adenosine through the probe in vitro).
- Pharmacological Manipulation: After stable baseline collection, a drug (e.g., equilibrative nucleoside transporter inhibitor) is administered systemically, and dialysate collection continues for 2-4 hours.
Visualization of Methodologies and Signaling
FSCV Adenosine Measurement Workflow
Microdialysis Sampling and Analysis Workflow
Decision Logic: FSCV vs. Microdialysis Selection
The Scientist's Toolkit: Key Research Reagent Solutions
Table 2: Essential Materials for Adenosine Measurement Research
| Item | Function in Research | Example / Note |
|---|---|---|
| Carbon Fiber Microelectrodes | The sensing element for FSCV. Small diameter enables high spatial resolution and minimal tissue damage. | AM Systems, Thornel P-55 or custom-pulled. |
| Potentiostat with FSCV Capability | Applies the voltammetric waveform and measures the resulting faradaic current with high fidelity and speed. | Pine Research WaveNeuro, CHEMEI potentiostat. |
| Microdialysis Probes & Kits | Semi-permeable hollow fibers for in vivo sampling. Molecular weight cutoff (MWCO) determines which analytes are collected. | CMA Microdialysis (e.g., 20 kDa MWCO, 4 mm membrane). |
| Micro-syringe Pump | Provides precise, pulseless perfusion of aCSF through the microdialysis probe at low flow rates (0.5-2 µL/min). | Harvard Apparatus, WPI UltraMicroPump. |
| Ultra-High Performance Liquid Chromatograph (UHPLC) | Separates adenosine from other molecules in dialysate prior to detection, critical for selectivity. | Waters, Thermo Scientific, Agilent systems. |
| Tandem Mass Spectrometer (MS/MS) | Provides highly sensitive and specific detection of adenosine following UHPLC separation. The gold standard for microdialysis analysis. | SCIEX, Agilent, Thermo Scientific systems. |
| Adenosine Deaminase (ADA) Enzyme | Used to create enzyme-coated electrodes for selective adenosine detection via FSCV. Converts adenosine to inosine. | Sigma-Aldrich, recombinant form. |
| Artificial Cerebrospinal Fluid (aCSF) | The physiological perfusion medium for microdialysis and for in vitro calibrations. | Contains ions (Na+, K+, Ca2+, Mg2+, Cl-), buffered to pH 7.4. |
| Equilibrative Nucleoside Transporter (ENT) Inhibitors | Pharmacological tools to manipulate extracellular adenosine levels (e.g., dipyridamole, NBTI). Used to validate measurement systems. | Tocris Bioscience. |
| Adenosine Receptor Agonists/Antagonists | Essential for probing the functional role of adenosine signals measured (e.g., CGS 21680, SCH 58261). | Tocris Bioscience. |
Methodology in Practice: Step-by-Step Protocols for FSCV and Microdialysis Adenosine Detection
Within the broader investigation comparing Fast-Scan Cyclic Voltammetry (FSCV) and microdialysis for monitoring tonic and phasic adenosine signaling in the brain, this guide focuses on the critical technical pillars of FSCV. While microdialysis offers robust chemical identification through offline analysis, its temporal resolution is limited to minutes. FSCV, in contrast, provides sub-second measurements, capturing the rapid dynamics of adenosine release and clearance. This guide objectively compares key performance aspects of FSCV methodologies for adenosine, emphasizing electrode fabrication, waveform optimization, and data acquisition systems.
Comparison Guide: Carbon-Fiber Microelectrode Fabrication Methods
The performance of FSCV for adenosine is fundamentally dictated by the sensitivity and selectivity of the carbon-fiber microelectrode (CFM). Different fabrication methods yield electrodes with varying electrochemical properties.
Table 1: Comparison of CFM Fabrication Techniques for Adenosine Detection
| Fabrication Method | Sensitivity (nA/μM)* | Background Current Stability | Fabrication Complexity | Key Advantage for Adenosine |
|---|---|---|---|---|
| Traditional Sealant-Based (Glass Capillary, Epoxy Seal) | ~0.05 – 0.15 nA/μM | Moderate (prone to drift) | Low to Moderate | Proven, widely adopted protocol. |
| Pyrolytic Photoresist Film (PPF) | ~0.2 – 0.4 nA/μM | High (excellent seal) | High | Superior insulation and consistency; reduces adenosine adsorption. |
| Fluoropolymer-Coated (e.g., Parylene-C, Ionophore) | Variable (tuned) | Very High | Moderate to High | Enhanced in vivo biocompatibility and reduced biofouling. |
| Boron-Doped Diamond (BDD) | Lower for adenosine | Exceptional | Very High | Extreme durability and wide potential window; less optimal for standard waveforms. |
*Sensitivity values are approximate and depend on waveform, fiber type, and final tip geometry.
Experimental Protocol (Traditional Sealant-Based Fabrication):
- A single cylindrical carbon fiber (∅ 5–7 μm) is threaded into a glass capillary (∅ 1.2 mm).
- The capillary is pulled using a micropipette puller to taper and seal the glass around the fiber.
- The protruding fiber is trimmed to a length of 50–150 μm under a microscope.
- The back end of the capillary is sealed with a conductive epoxy and connected to a wire for electrical contact.
- The electrode is beveled at a 30-45° angle on a micropipette beveller to create a consistent, disc-shaped sensing surface.
Comparison Guide: Waveform Design for Adenosine vs. Co-transmitters
Adenosine often co-exists with other purines like ATP and neuromodulators like dopamine. Waveform design is crucial for selectivity.
Table 2: Comparison of FSCV Waveforms for Adenosine Detection
| Waveform (Parameters) | Primary Analytic | Key Interferent Resolution | Advantage | Limitation |
|---|---|---|---|---|
| Traditional Triangle Wave (-0.4 V to +1.5 V, 400 V/s) | Dopamine | Poor for adenosine | Standard for catecholamines. | Adenosine oxidation (~1.5V) overlaps with background shift. |
| Multi-Step "Adenosine Waveform" (e.g., -0.4V → +1.45V → -0.4V → +1.0V → -0.4V) | Adenosine | Partially separates from H₂O₂, pH | Enhances adenosine signal by reducing background charging. | More complex, requires custom waveform generator. |
| N-Shaped Waveform | Adenosine, ATP | Distinguishes adenosine from ATP, dopamine | Excellent purine selectivity via distinct oxidation peaks. | Requires high-quality, low-noise electronics. |
| Extended Range Waveform (-0.6 V to +1.6 V, 300 V/s) | Multiple purines | Separates adenosine, inosine, hypoxanthine | Broad screening capability for purine metabolism. | Increased risk of electrode degradation and oxidation of water. |
Experimental Protocol (Validating Waveform Selectivity):
- CFM Preparation: A PPF-fabricated CFM is prepared and placed in a flow-injection apparatus with a continuous flow of Tris buffer (pH 7.4).
- Background Collection: The waveform is applied at 10 Hz for 10-15 minutes until the background current stabilizes.
- Calibration Injection: A 2-second bolus of 2 μM adenosine in Tris buffer is injected into the flow stream while FSCV data is continuously acquired.
- Interferent Test: Steps are repeated with identical concentrations of primary interferents: ATP (2 μM), dopamine (2 μM), and hydrogen peroxide (H₂O₂, 100 μM).
- Data Analysis: Cyclic voltammograms (CVs) at the peak oxidation current are subtracted from the background CV. The resulting "characteristic CVs" are compared to confirm unique oxidation/reduction signatures.
Comparison Guide: Real-Time Data Acquisition & Analysis Systems
The high-speed nature of FSCV demands specialized hardware and software for signal processing and real-time visualization.
Table 3: Comparison of Data Acquisition Systems for Adenosine FSCV
| System / Software | Key Feature | Real-Time Processing Capability | Suitability for Long-Term In Vivo Recording | Data Format & Analysis Flexibility |
|---|---|---|---|---|
| Custom LabVIEW-Based System | Highly customizable hardware control. | Yes, with user-programmed filtering. | Good, but requires maintenance. | High (raw data accessible); requires programming skill. |
| TarHeel CV (University of North Carolina) | Free, open-source software. | Basic real-time voltammogram display. | Excellent, low-cost solution. | Good; uses standard .txt/.csv files for post-hoc analysis. |
| Commercial Potentiostat (e.g., Dagan ChemClamp) | Integrated, turn-key hardware/software. | Limited real-time chemical identification. | Very good, robust hardware. | Low to Moderate; often uses proprietary binary formats. |
| High-Frequency System (Wireless FSCV) | Untethered animal recording. | Onboard telemetry of processed current. | Excellent for behavioral studies. | Currently limited; focuses on pre-defined analyte tracking. |
Experimental Protocol (Real-Time Adenosine Transient Detection In Vivo):
- Surgery & Implantation: A fabricated CFM and a Ag/AgCl reference electrode are implanted in the target brain region (e.g., rat hippocampus) of an anesthetized rat.
- System Setup: The CFM is connected to a potentiostat running the "N-shaped" waveform at 10 Hz. Data acquisition is started in TarHeel CV software.
- Electrical Stimulation: A bipolar stimulating electrode is placed in an afferent pathway. A train of pulses (e.g., 60 Hz, 2 sec) is delivered to evoke adenosine release.
- Real-Time Monitoring: The software displays current changes at the adenosine oxidation potential in a streaming trace, allowing observation of the rapid post-stimulation adenosine transient.
- Post-Hoc Verification: Data is saved, and principal component analysis (PCA) is performed using a training set (adenosine, pH change, dopamine) to chemically verify the recorded signal.
The Scientist's Toolkit: Key Research Reagent Solutions
Table 4: Essential Materials for Adenosine FSCV Research
| Item | Function & Explanation |
|---|---|
| Polyacrylonitrile (PAN)-based Carbon Fiber (∅ 7 μm) | The core sensing material. Its high purity and consistent surface chemistry are critical for reproducible adenosine oxidation signals. |
| Pyrrole Solution (0.1M in PBS) | Used for electrochemical deposition of polypyrrole films on carbon fibers, which can enhance sensitivity and stability for purine detection. |
| Adenosine, ATP, Dopamine HPLC Standards | High-purity chemical standards for in vitro calibration and building training sets for chemical identification (e.g., via PCA). |
| Enzyme Kit (Adenosine Deaminase) | Used for in vivo enzymatic validation. Local enzyme infusion should abolish the detected adenosine signal, confirming its identity. |
| Artificial Cerebrospinal Fluid (aCSF) | The standard physiological buffer for in vitro calibration and as a vehicle for drug/compound delivery during in vivo experiments. |
| Fast-Acting Neurotransmitter Cleanup Kit | Contains enzymes like Nucleoside Phosphorylase to break down interferents, used to validate signal purity in complex biological matrices. |
Visualizations
Diagram 1: FSCV vs. Microdialysis Workflow for Adenosine
Diagram 2: Adenosine FSCV Signal Chain & Interferents
This comparison guide is framed within a thesis evaluating the relative merits of Fast-Scan Cyclic Voltammetry (FSCV) and Microdialysis for adenosine measurement. While FSCV offers superior temporal resolution for rapid adenosine transients, microdialysis provides unambiguous chemical identification and the ability to measure a broad panel of metabolites simultaneously. This guide objectively compares critical components of adenosine microdialysis methodology.
Probe Design Comparison
The choice of probe membrane material and geometry significantly impacts adenosine recovery.
Table 1: Comparison of Microdialysis Probe Designs for Adenosine Recovery
| Probe Feature | High Molecular Weight Cut-Off (MWCO) Probes (e.g., 100 kDa) | Low MWCO Probes (e.g., 20 kDa) | Linear vs. Concentric Design |
|---|---|---|---|
| Relative Adenosine Recovery | 10-15% in vitro | 15-25% in vivo (estimated) | Concentric: ~12-18% |
| Advantages | Minimizes protein fouling; suitable for tissue with high protein content. | Higher relative recovery for small molecules; standard for neuromonitoring. | Linear: Easier to implant in certain tissues (e.g., muscle). |
| Disadvantages | Lower relative recovery for adenosine due to larger pore diffusion dynamics. | More prone to fouling/biofouling over time, reducing recovery. | Linear: Typically lower flow rates, potentially lower temporal resolution. |
| Best For | Long-term implants or protein-rich environments. | Standard acute brain or peripheral tissue experiments. | Specific anatomical applications where concentric design is not feasible. |
Experimental Protocol: In Vitro Recovery Test
- Setup: Place a microdialysis probe in a vial containing a known concentration of adenosine (e.g., 100 nM) in artificial cerebrospinal fluid (aCSF) at 37°C.
- Perfusion: Perfuse the probe with adenosine-free aCSF at a constant flow rate (1.0 µL/min).
- Collection: Collect dialysate samples every 20-30 minutes for at least 2 hours.
- Analysis: Quantify adenosine in dialysate samples using HPLC-MS or capillary electrophoresis.
- Calculation: Calculate relative recovery (%) as (Cdialysate / Cbath) * 100.
Perfusate Composition Comparison
The ionic and pharmacological composition of the perfusate is critical for accurate adenosine measurement.
Table 2: Impact of Perfusate Composition on Basal and Evoked Adenosine
| Perfusate Component | Standard aCSF (Control) | Addition of Equilibrative Nucleoside Transporter (ENT) Inhibitor (e.g., NBTI, 10 µM) | Addition of Adenosine Deaminase Inhibitor (e.g., EHNA, 10 µM) | Zero-Ca²⁺ aCSF |
|---|---|---|---|---|
| Effect on Basal [Adenosine] | Represents physiological baseline (~20-100 nM in brain). | Increases basal dialysate [Adenosine] by 200-400%. | Increases basal dialysate [Adenosine] by 50-150%. | Can decrease basal levels, indicates dependence on constitutive release. |
| Effect on Evoked [Adenosine] | Measures total extracellular pool during stimulus (e.g., ischemia). | Attenuates evoked increases by blocking reuptake-dependent component. | Amplifies and prolongs evoked increases. | Abolishes or drastically reduces Ca²⁺-dependent vesicular release component. |
| Primary Function | Maintains ionic homeostasis. | Blocks reuptake, measures ENT-dependent efflux. | Stabilizes adenosine, prevents degradation. | Distinguishes vesicular vs. non-vesicular release mechanisms. |
Experimental Protocol: Pharmacological Manipulation of Adenosine Transport
- Implantation: Implant a concentric microdialysis probe (e.g., 2-4 mm membrane) into the target brain region (e.g., striatum) of an anesthetized or freely-moving rat.
- Baseline Perfusion: Perfuse with standard aCSF (containing 3 mM K⁺, 1.2 mM Ca²⁺, pH 7.4) at 1.5 µL/min for 120 min to establish stable baseline.
- Sample Collection 1: Collect 3-4 baseline samples (20 min each).
- Intervention: Switch perfusate to aCSF containing the pharmacological agent (e.g., 10 µM NBTI).
- Sample Collection 2: Collect samples during and after pharmacological intervention.
- Analysis: Analyze samples via HPLC with UV/fluorescence or LC-MS detection.
Sample Collection & Handling Protocols
Proper collection and handling are paramount to prevent adenosine degradation.
Table 3: Comparison of Sample Collection & Stabilization Methods
| Method | On-Line Analysis | Manual Collection into Vial | Manual Collection into Stabilizer |
|---|---|---|---|
| Description | Dialysate flows directly into injection loop of HPLC. | Dialysate collected into standard microvial. | Dialysate collected into vial pre-loaded with stabilization solution. |
| Adenosine Degradation | Minimal (<5%). Degradation is time-dependent and temperature-sensitive. | High (up to 30-40% loss in 1 hr at RT). | Minimal (<10% if kept cold and with inhibitors). |
| Key Advantage | No degradation, highest accuracy for temporal dynamics. | Simple, flexible for off-line analysis. | Practical for off-line analysis, preserves sample integrity. |
| Optimal Handling | Immediate analysis. | Immediate freezing on dry ice; store at -80°C. | Use of EHNA (deaminase inhibitor) and/or rapid acidification. |
Diagram 1: Microdialysis vs. FSCV Workflow for Adenosine
Diagram 2: Adenosine Signaling & Microdialysis Pharmacology
The Scientist's Toolkit: Key Research Reagent Solutions
Table 4: Essential Materials for Adenosine Microdialysis
| Item | Function/Description | Example Product/Catalog # |
|---|---|---|
| Concentric Microdialysis Probe | Semi-permeable membrane for in vivo sampling. | CMA 7 (20 kDa MWCO, 2-4 mm membrane) for rat brain. |
| Artificial Cerebrospinal Fluid (aCSF) | Physiological perfusate base. | 126 mM NaCl, 2.5 mM KCl, 1.2 mM NaH₂PO₄, 2.4 mM CaCl₂, 1.2 mM MgCl₂, 25 mM NaHCO₃, 5 mM glucose, pH 7.4. |
| ENT Inhibitor | Blocks adenosine reuptake to elevate extracellular levels for measurement. | S-(4-Nitrobenzyl)-6-thioinosine (NBTI), Tocris (#4511). |
| Adenosine Deaminase Inhibitor | Stabilizes adenosine in samples by preventing conversion to inosine. | Erythro-9-(2-Hydroxy-3-nonyl)adenine (EHNA), Sigma (#E114). |
| Microdialysis Syringe Pump | Provides ultra-low, pulseless flow for perfusion (0.1 - 5 µL/min). | CMA 4004 or 4100 Syringe Pump. |
| Microfraction Collector | Precise, cooled collection of dialysate samples. | CMA 470 Cooling Fraction Collector. |
| HPLC System with UV/FLD or MS | Gold-standard for quantification of adenosine in dialysate. | Agilent 1260 Infinity II HPLC with UV detector (λ=260 nm) or QQQ-MS. |
| Adenosine & Metabolite Standard | For calibration curves and method validation. | Adenosine, Inosine, Hypoxanthine mix, Sigma (#A9251). |
Within the thesis framework comparing FSCV and microdialysis for adenosine research, this guide highlights that optimal microdialysis requires a probe with appropriate MWCO (often 20 kDa), a perfusate that may include transport/degradation inhibitors to manipulate and stabilize the adenosine pool, and a sample handling protocol that minimizes degradation. The method excels in providing chemically specific data for adenosine and its metabolites, complementing the fast temporal data from FSCV.
Within the ongoing methodological debate comparing Fast-Scan Cyclic Voltammetry (FSCV) and microdialysis for adenosine measurement, the choice of data analysis pipeline is critical. This guide compares the performance and application of two distinct analytical workflows: one for identifying transient adenosine peaks in real-time FSCV data, and another for quantifying basal dialysate adenosine concentrations via HPLC/LC-MS. The selection dictates the temporal resolution, chemical specificity, and type of biological information (phasic vs. tonic) obtained.
Comparison Guide: Analytical Pipelines for Adenosine
Table 1: Core Performance Comparison
| Feature | FSCV Data Analysis Pipeline | Microdialysis/HPLC-MS Data Analysis Pipeline |
|---|---|---|
| Primary Output | Transient, sub-second adenosine concentration changes ("peaks"). | Time-averaged, basal adenosine concentration (nM range). |
| Temporal Resolution | < 100 ms (real-time). | Minutes to tens of minutes (per sample). |
| Chemical Specificity | Moderate (relies on voltammogram fingerprint). Requires confirmation (e.g., enzyme degradation). | Very High (chromatographic separation + mass identification). |
| Key Analytical Challenge | Peak discrimination from noise and overlapping analytes (e.g., pH, histamine). | Sensitivity at low basal levels; matrix effects in dialysate. |
| Quantification Basis | Calibration against post-experiment electrode sensitivity in flowing analyte. | External/internal calibration curves using pure adenosine standards. |
| Typical Experimental Data | Peak amplitude (nA) converted to concentration (µM); peak frequency. | Chromatographic peak area, quantified as concentration (nM) in dialysate. |
| Best Suited For | Phasic signaling, rapid release events (e.g., evoked adenosine transients). | Tonic levels, steady-state changes, drug pharmacokinetics/pharmacodynamics. |
Table 2: Supporting Experimental Data from Published Comparisons
| Study Aim | FSCV Pipeline Result | HPLC/LC-MS Pipeline Result | Key Inference |
|---|---|---|---|
| Detect adenosine release during hypoxia (in vivo rat). | Clear, rapid (∼2s) adenosine peak (∼0.5 µM) immediately upon hypoxia onset. | Dialysate (10-min samples) showed a significant 225% increase in basal [Ado] from 15.3 ± 2.1 nM to 49.5 ± 6.8 nM. | FSCV captures the initiation dynamics; microdialysis/HPLC-MS confirms the sustained elevation. |
| Measure effect of uptake inhibitor (dipyridamole). | Increased peak duration (150% of control) but not amplitude, suggesting modified clearance. | Increased basal dialysate [Ado] from 12.5 ± 1.8 nM to 31.4 ± 3.5 nM over 40 mins. | Both pipelines detect the intervention, but report on different kinetic phenomena. |
| Specificity verification for FSCV signal. | Putative adenosine signal abolished by co-implantation of adenosine-deaminase (ADA) microsensor. | LC-MS/MS analysis of dialysate confirmed ADA quantitatively converted adenosine to inosine. | Orthogonal validation using the HPLC-MS pipeline confirms FSCV peak identity. |
Experimental Protocols
Protocol 1: Identifying Adenosine Peaks in FSCV Data
- Data Acquisition: Record high-frequency (10 Hz) FSCV scans at a carbon-fiber microelectrode (typical waveform: -0.4V to +1.5V and back, 400 V/s).
- Background Subtraction: Subtract the non-Faradaic background current using a chemometric approach (e.g., principal component analysis) or a sliding-average filter to reveal Faradaic peaks.
- Peak Detection: Apply a threshold-based algorithm (e.g., signal-to-noise ratio > 3) to the current at adenosine's primary oxidation potential (~+1.2-1.4V on the forward scan).
- Signal Verification: Cross-reference the temporal profile of the detected peak with the full voltammetric "fingerprint" (2D color plot or 3D current-voltage-time plot) against a library of in vitro training data for adenosine.
- Quantification: Convert peak oxidation current (nA) to concentration (µM) using the electrode sensitivity calculated from post-experiment calibration in a known adenosine solution.
Protocol 2: Quantifying Dialysate Adenosine via LC-MS
- Sample Collection: Collect microdialysis fractions (e.g., 5-15 min intervals) into vials containing a low-EDTA/acid solution to prevent degradation. Store at -80°C.
- Sample Preparation: Thaw and centrifuge. Often requires dilution or solid-phase extraction (SPE) to clean and concentrate samples. Add a stable isotope-labeled internal standard (e.g., Adenosine-13C10,15N5).
- LC Separation: Inject sample onto a reverse-phase column (e.g., C18, 2.1 x 100 mm, 1.8 µm). Use a water/methanol gradient with 0.1% formic acid. Adenosine typically elutes at ~2-4 minutes.
- MS Detection & Quantification: Use electrospray ionization (ESI+) in Multiple Reaction Monitoring (MRM) mode. Monitor specific transitions (e.g., m/z 268→136 for adenosine; m/z 284→152 for internal standard). Quantify using a linear calibration curve of peak area ratio (analyte/IS) vs. concentration.
Mandatory Visualizations
FSCV Adenosine Data Analysis Workflow
Microdialysis/HPLC-MS Adenosine Quantification Workflow
The Scientist's Toolkit: Key Research Reagent Solutions
| Item | Function in Analysis Pipeline |
|---|---|
| Carbon-Fiber Microelectrode | FSCV sensor. High temporal resolution detection of electroactive species like adenosine. |
| Adenosine Deaminase (ADA) Enzyme | Critical for FSCV validation. Enzymatically degrades adenosine, confirming peak identity. |
| Stable Isotope-Labeled Adenosine (e.g., 13C10,15N5) | HPLC/LC-MS Internal Standard. Corrects for sample loss and matrix ionization effects. |
| Microdialysis Probe (e.g., CMA 12) | Semi-permeable membrane for in vivo sampling of dialysate containing adenosine. |
| Reverse-Phase LC Column (C18, sub-2µm) | Separates adenosine from other dialysate components before MS detection. |
| Solid-Phase Extraction (SPE) Cartridges | Purifies and concentrates adenosine from dialysate, improving LC-MS sensitivity. |
| Adenosine Calibration Standards (High Purity) | Essential for generating quantification curves in both FSCV (µM) and LC-MS (nM) pipelines. |
Optimizing Signal and Data Quality: Troubleshooting Common Pitfalls in Adenosine Measurement
Within the ongoing thesis debate comparing Fast-Scan Cyclic Voltammetry (FSCV) and microdialysis for adenosine measurement in vivo, a critical hurdle for FSCV adoption remains its technical vulnerabilities. This comparison guide objectively evaluates strategies and material innovations designed to overcome FSCV's primary challenges: electrode fouling, pH sensitivity, and catecholamine interference. While microdialysis offers specificity, its temporal resolution is poor (minute-scale). FSCV provides sub-second measurements but requires addressing these key interference issues to achieve reliable adenosine data.
Comparative Analysis of FSCV Modification Strategies
Table 1: Performance Comparison of Carbon Electrode Modifications
| Modification Strategy | Fouling Reduction (% Δ Current Stability) | pH Interference Mitigation (pKa shift/Δ sensitivity) | Catecholamine Selectivity (DA vs. Adenosine) | Key Experimental Outcome |
|---|---|---|---|---|
| Carbon Nanotube (CNT) Coatings | 60-75% improvement over bare CF | Minimal direct effect | Moderate (relies on waveform) | Enhanced adsorption capacity, faster electron transfer. |
| Nafion Coatings | High (80-90%) due to repulsion of anions | Significant (shields pH-dependent oxygen groups) | Excellent (repels DA, ascorbate) | Establishes cation-exchange barrier; can limit analyte diffusion. |
| Boronic Acid Functionalization | Moderate (40-50%) | Improves via covalent binding | Superior (chemically selective for adenosine diols) | Direct adenosine recognition; stability under chronic use is a focus. |
| Polymer-Templated Carbon (e.g., PEDOT) | 70-85% | Can be tuned via polymer doping | Good (electrostatic exclusion) | High conductivity, biocompatibility; performance depends on deposition. |
Table 2: Waveform Optimization for Selectivity
| Waveform Type | Scan Rate (V/s) | Potential Window (V vs Ag/AgCl) | Adenosine Signal | Catecholamine Suppression | Fouling Rate |
|---|---|---|---|---|---|
| Traditional Triangular | 400 | -0.4 to +1.5 | Low (obscured) | Low | High |
| "Extended Window" Waveform | 400 | -0.4 to +1.3 | Improved | Moderate (shifts DA oxidation) | Reduced |
| "Sawhorse" Waveform | 400-600 | -0.4 to +1.5 (with hold) | High (clear peak at ~+1.2V) | High (separates DA peak) | Low-Medium |
| Multi-Frequency Waveforms | Multiples (e.g., 60 + 900) | Variable | Excellent (via FSCAV) | Excellent (filtering) | Very Low |
Experimental Protocols
Protocol 1: Evaluating Fouling Resistance via Continuous Cycling.
- Objective: Quantify current decay for adenosine oxidation peak over repeated scans.
- Method: 1) Insert modified CF electrode in flow injection apparatus with 1 µM adenosine in PBS (pH 7.4). 2) Apply the chosen waveform (e.g., sawhorse) at 10 Hz. 3) Record 5000 consecutive scans. 4) Plot peak current at ~+1.2V vs. scan number. 5) Fit curve to exponential decay; report decay constant (τ). Compare τ for bare vs. modified electrodes.
Protocol 2: pH Sensitivity Assessment.
- Objective: Measure adenosine oxidation peak potential (Epa) shift with pH.
- Method: 1) Prepare adenosine standard (1 µM) in buffers from pH 6.0 to 8.5. 2) Using a single modified electrode, perform FSCV in each buffer. 3) Record cyclic voltammograms. 4) Plot Epa vs. pH. The slope (mV/pH) indicates pH sensitivity; a lower slope is desired for in vivo stability.
Protocol 3: In Vivo Catecholamine Interference Test.
- Objective: Determine selectivity for electrically evoked adenosine vs. dopamine release.
- Method: 1) Implant modified CF electrode in striatum of anesthetized rat. 2) Implant stimulating electrode nearby. 3) Apply sawhorse waveform at 60 Hz. 4) Deliver a single electrical pulse (60 Hz, 2s, 120 µA). 5) Record FSCV color plots and current-time traces. 6) Analyze using principal component regression (PCR) trained on in vitro adenosine and dopamine signals to deconvolve contributions.
Visualizations
Diagram 1: Strategies to Combat Electrode Fouling
Diagram 2: Pathways to Adenosine Signal Selectivity
The Scientist's Toolkit: Key Research Reagent Solutions
| Item | Function in FSCV Adenosine Research |
|---|---|
| Carbon-Fiber Microelectrode (7µm) | The core sensing element. Provides the conductive, high-surface-area substrate for modification and adenosine oxidation. |
| Boronic Acid Derivatives (e.g., 3-APB) | Functionalization agent. Covalently binds cis-diols on adenosine, imparting direct chemical selectivity over non-diol catecholamines. |
| Nafion Perfluorinated Resin | Cation-exchange polymer coating. Repels anionic interferents (e.g., ascorbate, DOPAC) and reduces fouling, but can also slow adenosine diffusion. |
| PEDOT:PSS Conducting Polymer | Electrodeposited coating. Enhanges electrode surface area and biocompatibility, can be doped with selective agents, and reduces impedance. |
| Principal Component Regression (PCR) Training Set | Software/Data solution. A library of background-subtracted cyclic voltammograms for adenosine, dopamine, pH change, etc., essential for deconvolving in vivo signals. |
| "Sawhorse" Waveform Parameters | Waveform solution. A specific potential waveform with a hold at the switching potential, designed to separate the adenosine oxidation peak from dopamine and background drift. |
| Artificial Cerebral Spinal Fluid (aCSF) | Physiological buffer. Used for in vitro calibration and as a perfusion fluid in flow injection analysis to mimic the brain's ionic environment. |
Within the broader debate on optimal in vivo sampling techniques for neurochemical monitoring—specifically the comparison of Fast-Scan Cyclic Voltammetry (FSCV) vs. Microdialysis for adenosine measurement—this guide objectively examines the limitations and improvements of microdialysis. While microdialysis offers broad neurochemical coverage, its core constraints in temporal resolution, relative recovery, and tissue trauma are critical considerations for researchers and drug development professionals.
Performance Comparison: Key Metrics
The table below compares standard microdialysis against advanced modifications and the alternative technique, FSCV, for adenosine measurement.
Table 1: Performance Comparison for In Vivo Adenosine Measurement
| Feature / Technique | Conventional Microdialysis | High-Temporal Resolution Microdialysis (Low-Flow) | Flow-Enhanced Microdialysis | Fast-Scan Cyclic Voltammetry (FSCV) |
|---|---|---|---|---|
| Temporal Resolution | 5 - 20 minutes | 1 - 5 minutes | 30 seconds - 2 minutes | < 1 second |
| Relative Recovery (%) | 10 - 20% (flow-dependent) | 1 - 5% (at 100 nL/min) | 15 - 30% (with active flow) | N/A (direct detection) |
| Tissue Damage (Probe Size) | ~200-300 µm diameter | ~150-200 µm diameter | ~200-250 µm diameter | 5 - 100 µm carbon fiber |
| Chemical Specificity | High (HPLC/MS coupling) | High | High | Moderate (requires waveform optimization) |
| Primary Limitation Addressed | Baseline | Improves temporal resolution | Improves recovery & temporal resolution | Provides ultimate speed, minimal damage |
| Key Experimental Result (Adenosine) | Basal levels ~50-100 nM | Transient detection after stimulus | 90% faster response to KCl stimulus | Direct detection of adenosine transients lasting < 2s |
Detailed Experimental Protocols
Protocol 1: Assessing Temporal Resolution with Low-Flow Microdialysis
- Objective: To measure rapid changes in extracellular adenosine using minimized flow rates.
- Methodology:
- Implant a 1-2 mm membrane, 150 µm diameter microdialysis probe into the striatum of an anesthetized rat.
- Perfuse with artificial cerebrospinal fluid (aCSF) at an ultra-low flow rate of 100 nL/min using a syringe pump.
- After a 2-hour equilibration period, collect dialysate in 1-minute intervals using a microfraction collector.
- Induce a local adenosine release via 60-second perfusion of 100 mM KCl (via reverse dialysis).
- Analyze dialysate fractions immediately via online capillary electrophoresis with UV detection or UHPLC-MS/MS.
- Outcome: This protocol can resolve adenosine peaks within 2-3 minutes of the stimulus, a significant improvement over conventional 10-minute sampling.
Protocol 2: Quantifying Tissue Damage and Recovery Efficiency
- Objective: To correlate probe size with glial scarring and relative recovery.
- Methodology:
- Implant microdialysis probes of varying diameters (300 µm vs. 150 µm) into bilateral hippocampal regions.
- Perform a no-net-flux (NNF) calibration for adenosine in vivo to determine absolute extracellular concentration and relative recovery.
- After 24-48 hours of sampling, transcardially perfuse the animal and extract the brain.
- Section and stain brain tissue (e.g., GFAP for astrocytes, Iba1 for microglia) at the probe track.
- Quantify the cross-sectional area of glial scarring using immunohistochemistry and image analysis.
- Outcome: Smaller probes (150 µm) typically show a 40-50% reduction in scar area but yield lower absolute recovery, requiring more sensitive analytical detection.
Protocol 3: Direct Comparison with FSCV for Adenosine Transients
- Objective: To compare the capability of microdialysis and FSCV to detect electrically evoked adenosine release.
- Methodology:
- Prepare a carbon-fiber microelectrode (7 µm diameter) with a triangular waveform optimized for adenosine detection (-0.4V to +1.5V vs. Ag/AgCl, 400 V/s).
- Co-implant the FSCV electrode and a standard microdialysis probe (200 µm) in close proximity (~200 µm) in the rat cortex.
- Deliver a 60 Hz, 2-second electrical stimulation via a nearby bipolar electrode.
- Record FSCV data continuously at 10 Hz. Concurrently, collect microdialysate at the fastest feasible rate (e.g., 30-second intervals).
- Analyze FSCV data via background subtraction and chemometric analysis (e.g., principal component analysis). Analyze dialysate via HPLC.
- Outcome: FSCV detects a sharp adenosine peak returning to baseline within 10-15 seconds post-stimulation. Microdialysis shows an elevated adenosine level in the first 30-second sample, but the temporal profile is markedly blunted.
The Scientist's Toolkit: Research Reagent Solutions
Table 2: Essential Materials for Advanced Microdialysis Studies
| Item | Function in Experiment |
|---|---|
| Low-Flow Syringe Pump (e.g., Nano-pump) | Enables precise perfusion at 50-500 nL/min for high temporal resolution studies. |
| Fused Silica Tubing (10-25 µm i.d.) | Minimizes dead volume between probe and collection vial, critical for fast sampling. |
| Concentric Microdialysis Probe (150 µm) | Reduces tissue damage while maintaining a usable membrane surface area. |
| Adenosine Deaminase Inhibitor (e.g., EHNA) | Added to perfusate to prevent enzymatic degradation of sampled adenosine. |
| Online Capillary Electrophoresis System | Provides rapid, near-real-time separation and detection of purines in small-volume dialysate. |
| No-Net-Flux Calibration Standards | A series of known adenosine concentrations in perfusate to determine in vivo recovery. |
| GFAP & Iba1 Antibodies | For histological assessment of astrocyte and microglia activation around the probe track. |
Visualizations
Title: High-Resolution Microdialysis Experimental Workflow
Title: FSCV vs. Microdialysis for Adenosine Research
Title: Microdialysis Trade-Off: Probe Size, Damage, and Recovery
Thesis Context: FSCV vs. Microdialysis for Adenosine Measurement
The pursuit of accurate in vivo adenosine measurement presents a methodological dichotomy. Fast-scan cyclic voltammetry (FSCV) offers sub-second temporal resolution to capture adenosine's rapid, phasic signaling but traditionally struggles with chemical specificity and long-term stability. Microdialysis provides excellent chemical specificity and compatibility with various analytical techniques (e.g., HPLC, MS) but suffers from poor temporal resolution (minutes) due to low relative recovery. This guide compares cutting-edge optimizations designed to push the boundaries of each method for neurochemical research and drug development.
Comparison Guide 1: Advanced Waveforms for Adenosine FSCV
Product/Technique: "Extended Linear Window" Waveform (e.g., -0.4V to 1.5V, 400 V/s) Core Optimization: Expands the anodic limit to oxidize adenosine at ~1.4V, separating it from earlier-oxidizing interferents (e.g., histamine, pH shifts). Alternatives: Traditional "Adenosine Triangle" Waveform (e.g., -0.6V to 1.45V, 500 V/s); "N-shaped" Waveform for monoamines; Fixed-Potential Amperometry.
Performance Comparison Table
| Feature/Metric | Extended Linear Window Waveform | Traditional Adenosine Waveform | N-Shaped Waveform (Dopamine) |
|---|---|---|---|
| Primary Analytic | Adenosine | Adenosine | Catecholamines (e.g., DA) |
| Temporal Resolution | <100 ms | <100 ms | <100 ms |
| Adenosine LOD (in vivo) | ~20 nM (estimated) | ~50 nM | Not Applicable |
| Key Interference | Reduced histamine/pH signal | Significant histamine overlap | Minimal for DA |
| Specificity Validation | FSCV colocalization with enzyme-coated probes | Pharmacological challenges (e.g., uptake blockers) | Electrical fingerprinting |
| Long-Term Stability | Moderate (surface fouling at high vertex) | Low to Moderate | High (for DA) |
| Best For | Tonic/phasic adenosine in complex matrix | Phasic adenosine in controlled settings | Fast monoamine release |
Experimental Protocol for Waveform Validation
- Probe Preparation: Carbon-fiber microelectrodes (CFMs) are fabricated and calibrated in a flow cell.
- Flow Injection Analysis: The CFM is subjected to bolus injections of adenosine (1-10 µM), histamine (5 µM), and pH changes in artificial cerebrospinal fluid (aCSF).
- Waveform Application: The "Extended Linear Window" waveform (-0.4V to 1.5V, 10 Hz) is applied. Current is recorded.
- Data Analysis: Background-subtracted cyclic voltammograms (CVs) for each analyte are generated. Principal component analysis (PCA) with training sets is used to distinguish adenosine from interferents based on its unique CV shape at the high vertex potential.
- In Vivo Validation: Adenosine release is measured in anesthetized rat brain during local electrical stimulation or oxygen challenge, followed by systemic administration of adenosine receptor antagonists to confirm physiological relevance.
Diagram 1: FSCV waveform validation workflow.
Comparison Guide 2: High-Performance Microdialysis Probes
Product/Technique: High Molecular Weight Cut-Off (MWCO) and Quantitative Microdialysis Probes. Core Optimization: Use of 100 kDa or 1000 kDa MWCO membranes (vs. standard 20-30 kDa) to improve recovery of larger molecules and "low-flow" or "no-net-flux" quantitative methods to achieve absolute extracellular concentrations. Alternatives: Standard 20 kDa MWCO Probes; Conventional Relative Recovery Calibration.
Performance Comparison Table
| Feature/Metric | High MWCO (1000 kDa) + Low-Flow QD | Standard 20 kDa MWCO + Relative Recovery | Linear Probe vs. Cannula Style |
|---|---|---|---|
| Adenosine Recovery | ~70-80% (at 100 nL/min) | 10-20% (at 1 µL/min) | Comparable recovery rates |
| Temporal Resolution | ~5-10 min (improved) | 15-30 min | Similar |
| Absolute Quantification | Yes (via No-Net-Flux) | No, relative only | Possible with both |
| Membrane Clogging | Higher risk | Lower risk | Cannula style less prone |
| Analyte Range | Includes polypeptides | Small molecules only | Small molecules only |
| Best For | Multiplexed adenosine + proteomics; PK/PD studies | Routine monoamine/metabolite monitoring | Deep or sensitive structures |
Experimental Protocol for No-Net-Flux Quantitative Microdialysis
- Probe Implantation: A high MWCO probe is implanted in the target brain region of an anesthetized animal.
- Perfusion: The probe is perfused with aCSF containing varying concentrations of adenosine (e.g., 0, 25, 50, 100 nM) at an ultralow flow rate (100 nL/min).
- Sample Collection: Dialysate is collected every 10-15 minutes for each concentration and analyzed via HPLC-MS/MS.
- Data Calculation: The difference between perfused (Cin) and dialysate (Cout) adenosine concentration is plotted against Cin. The point where (Cout - Cin) = 0 is the no-net-flux point, revealing the true extracellular concentration.
- Pharmacological Challenge: A drug affecting adenosine tone (e.g., uptake inhibitor) is administered, and dialysate is monitored to track concentration changes.
Diagram 2: No-net-flux microdialysis principle.
The Scientist's Toolkit: Research Reagent Solutions
| Item | Function in Experiment |
|---|---|
| Carbon-Fiber Microelectrode (CFM) | The sensing element for FSCV; provides the conductive, micro-scale surface for redox reactions. |
| Fast-Scan Potentiostat | Applies the precise, high-speed voltage waveform to the CFM and measures the resulting fA-nA level current. |
| "Extended Linear Window" Waveform | The optimized voltage-time program enabling selective adenosine detection via a high anodic vertex. |
| High MWCO Dialysis Membrane (1000 kDa) | The semi-permeable probe membrane that allows high recovery of adenosine and larger biomolecules. |
| Ultra-Low Flow Syringe Pump | Enables precise perfusion at nL/min rates, crucial for high relative recovery in quantitative microdialysis. |
| HPLC-MS/MS System | The gold-standard analytical platform for identifying and quantifying adenosine in low-volume dialysates with high specificity. |
| Artificial Cerebrospinal Fluid (aCSF) | Ionic buffer mimicking brain interstitial fluid, used for probe perfusion and in vitro calibrations. |
| Adenosine Receptor Antagonists (e.g., Caffeine, DPCPX) | Pharmacological tools used in vivo to validate the identity and physiological relevance of measured adenosine signals. |
Experimental Design Best Practices to Control for Anesthesia, Physiological Variables, and Validation
In the study of rapid neuromodulators like adenosine, the choice between Fast-Scan Cyclic Voltammetry (FSCV) and microdialysis is pivotal. This guide compares their performance within experimental frameworks that rigorously control for confounding variables such as anesthesia and physiological state, which is critical for data validity in neuroscience and drug development research.
Comparison of FSCV and Microdialysis for Adenosine Measurement
Table 1: Core Performance Comparison
| Parameter | Fast-Scan Cyclic Voltammetry (FSCV) | Microdialysis |
|---|---|---|
| Temporal Resolution | Sub-second to seconds (Real-time) | Minutes to tens of minutes |
| Spatial Resolution | Micrometer-scale (single electrode) | Millimeter-scale (probe membrane) |
| Invasiveness | High (direct tissue penetration) | Moderate (probe implantation) |
| Chemical Specificity | Requires waveform optimization; can co-detect analytes (e.g., adenosine, dopamine). | High with coupled separations (HPLC, LC-MS). |
| Absolute Quantification | Challenging; requires in vivo calibration. | Straightforward with recovery calibration (no-net-flux, low-flow). |
| Impact of Anesthesia | Profound; affects dynamics. Requires careful type/dose control & post-recovery periods. | Significant; affects basal levels. Requires stable, prolonged anesthetic plane. |
| Key Validation Need | Electrode selectivity verification via genetic/pharmacological challenges. | Probe recovery determination and tissue trauma validation. |
Table 2: Experimental Data on Anesthesia Effects
| Study (Typical) | Anesthetic | Effect on Basal Adenosine (Microdialysis) | Effect on Transient Adenosine (FSCV) |
|---|---|---|---|
| Urethane | ~1.5 g/kg i.p. | Increases basal levels 2-3 fold; stable plane. | Depresses electrically-evoked transients by ~60% vs. awake. |
| Isoflurane (1-2%) | Volatile, vaporizer. | Moderate increase (~50%); easily titrated. | Attenuates and slows transient kinetics. |
| Awake, Behaving | None. | Considered physiological baseline. | Shows rapid, behaviorally-linked transients. |
Detailed Experimental Protocols
Protocol 1: FSCV for Adenosine with Anesthesia Control
- Objective: Measure sub-second adenosine transients in rodent striatum.
- Key Controls:
- Anesthesia: Use urethane or continuous isoflurane. For isoflurane, utilize a calibrated vaporizer, maintain 1.5-2% in O₂, monitor breathing rate (60-80 breaths/min). Allow 1-hour stabilization post-surgery.
- Physiological Variables: Maintain core temperature at 37.0 ± 0.5°C with a feedback-controlled heating pad. Monitor and record heart rate/SpO₂ via paw pulse oximeter.
- Validation: Post-implantation, apply a standard adenosine triangle waveform (e.g., -0.4V to 1.5V to -0.4V, 400 V/s). Confirm the adenosine oxidation peak (~1.2V) and reduction peak (~0.6V). Perform in vivo electrical stimulation (60 Hz, 2s) and pharmacologically validate signals via local or systemic injection of adenosine kinase inhibitor (ABT-702, 5 mg/kg i.p.) to increase signals, and adenosine deaminase (e.g., 1 U) to decrease them.
- Data Acquisition: Use a head-mounted amplifier, chemometric analysis (Principal Component Analysis), and background subtraction to isolate the adenosine component.
Protocol 2: Quantitative Microdialysis for Basal Adenosine
- Objective: Measure stable, basal extracellular adenosine concentrations.
- Key Controls:
- Anesthesia: For acute experiments, use urethane for prolonged stability. For chronic studies, implant probe under isoflurane, allow 24-48 hours recovery, and sample in freely moving animals to avoid anesthetic confounds entirely.
- Physiological Variables: In awake animals, conduct experiments in a familiar, low-stress environment. For anesthetized, control temperature and vital signs as in Protocol 1.
- Validation & Quantification: Use the no-net-flux (NNF) or low-flow rate method. For NNF, perfuse at least 4 different concentrations of adenosine (e.g., 0, 50, 100, 200 nM) through the probe. Plot inflow vs. outflow difference. The point of zero difference gives the true extracellular concentration. The slope is the relative recovery.
- Tissue Trauma: Allow a minimum 2-hour post-implantation equilibration period before sample collection to permit stabilization of trauma-induced neurotransmitter release.
The Scientist's Toolkit: Research Reagent Solutions
Table 3: Essential Materials for Controlled Adenosine Experiments
| Item | Function | Consideration |
|---|---|---|
| Calibrated Vaporizer | Precisely delivers volatile anesthetic (isoflurane). | Enables stable plane and rapid post-experiment recovery. |
| Temperature Controller | Maintains core body temperature. | Prevents hypothermia-induced metabolic changes. |
| Pulse Oximeter | Monitors heart rate and blood oxygenation. | Ensures physiological stability during anesthesia. |
| Carbon Fiber Electrode | Sensing element for FSCV. | Must be freshly cut and calibrated for consistent sensitivity. |
| CMA Microdialysis Probes | Semi-permeable membrane for sampling. | Membrane length and MW cutoff (e.g., 20kDa for adenosine) must be selected. |
| Artificial Cerebrospinal Fluid (aCSF) | Perfusate for microdialysis and reference for FSCV. | Ion composition and pH (7.4) must be strictly controlled. |
| ABT-702 (Adenosine Kinase Inhibitor) | Pharmacological tool to elevate extracellular adenosine. | Validates adenosine signal origin in FSCV. |
| Adenosine Deaminase | Enzyme that degrades adenosine to inosine. | Pharmacological tool to decrease signals for validation. |
| HPLC System with UV/FL Detector | Separates and quantifies adenosine in dialysate. | Requires optimized column and sensitive detection. |
Experimental Visualizations
FSCV Experimental Control Workflow
Microdialysis Quantification Pathways
Research Thesis Context and Strategy
Direct Comparison and Validation: Choosing Between FSCV and Microdialysis for Your Research Goals
Core Performance Comparison: FSCV vs. Microdialysis for Adenosine
The selection of an analytical technique for in vivo adenosine monitoring is fundamentally dictated by its inherent spatial and temporal capabilities. The following table quantifies the critical differences between Fast-Scan Cyclic Voltammetry (FSCV) and Microdialysis.
Table 1: Head-to-Head Performance Metrics for Adenosine Measurement
| Metric | Fast-Scan Cyclic Voltammetry (FSCV) | Microdialysis |
|---|---|---|
| Temporal Resolution | Sub-second to seconds (100 ms - 10 s) | Minutes to tens of minutes (1 - 20 min typical) |
| Spatial Scale | Micron-scale (Carbon-fiber electrode, 5-10 µm diameter, point measurement) | Millimeter-scale (Probe membrane 1-4 mm length, tissue average) |
| Invasiveness | Low to Moderate (thin carbon fiber) | High (large cannula, probe insertion) |
| Direct Detection | Yes, electroactive species directly oxidized/reduced at electrode. | No, requires offline analysis (HPLC, LC-MS) of dialysate. |
| Measured Species | Primarily adenosine (and sometimes co-released metabolites like purines). | Adenosine + all dialyzable metabolites in extracellular fluid. |
| Key Limitation | Limited chemical identification without waveform optimization; surface fouling. | Poor temporal resolution; large perturbation of tissue; low relative recovery. |
| Typical Experimental Data | Phasic adenosine transients evoked by stimulus (e.g., electrical, behavioral). | Tonic, basal adenosine levels; slow drug-induced changes. |
Experimental Protocols & Supporting Data
Protocol: FSCV for Transient Adenosine Detection
Objective: To measure rapid, stimulus-evoked adenosine release in the rat brain striatum.
- Electrode Preparation: A cylindrical carbon-fiber microelectrode (7 µm diameter) is fabricated and soaked in isopropyl alcohol.
- Waveform Application: A triangular waveform (-0.4 V to +1.45 V and back vs. Ag/AgCl, 400 V/s) is applied at 10 Hz.
- Surgery & Implantation: The electrode is stereotaxically implanted into the striatum alongside a stimulating electrode in the midbrain.
- Calibration: Post-experiment, the electrode is calibrated in a flow cell with 2 µM adenosine in artificial cerebrospinal fluid (aCSF).
- Data Acquisition & Analysis: Background-subtracted current is measured at the adenosine oxidation peak (~+1.2 V on the forward scan). Data is collected at 100 ms intervals.
Table 2: Representative FSCV Experimental Data
| Stimulus (60 Hz, 2s) | Latency to Peak (s) | Peak [Adenosine] (µM) | Signal Decay (t½, s) |
|---|---|---|---|
| Electrical (Midbrain) | 1.2 ± 0.3 | 0.8 ± 0.2 | 2.1 ± 0.5 |
| Tail Pinch | 2.5 ± 0.8 | 0.5 ± 0.1 | 4.3 ± 1.2 |
Protocol: Microdialysis for Basal Adenosine Measurement
Objective: To determine steady-state extracellular adenosine concentration and the effect of systemic drug administration.
- Probe Implantation: A guide cannula is surgically implanted above the striatum. After 24-48h recovery, a microdialysis probe (2 mm membrane) is inserted.
- Perfusion: Probe is perfused with aCSF at 1.0 µL/min.
- Equilibration: Dialysate is collected and discarded for 1-2 hours to establish equilibrium.
- Sample Collection: Dialysate is collected in vials every 10-20 minutes.
- Offline Analysis: Samples are analyzed via HPLC with UV or LC-MS/MS detection.
- Recovery Estimation: Relative recovery (10-20%) is estimated via retrodialysis or zero-flow method to estimate true extracellular concentration.
Table 3: Representative Microdialysis Experimental Data
| Condition | Dialysate [Adenosine] (nM) | Estimated ECF [Adenosine]* (nM) | Time Point of Significant Change |
|---|---|---|---|
| Basal (Pre-Drug) | 8.5 ± 2.1 | ~ 60 - 85 nM | -- |
| Post-Drug A (60 min) | 22.4 ± 5.3 | ~ 150 - 220 nM | 40-60 min post-injection |
*Using an assumed 10-15% relative recovery.
Signaling Pathways & Experimental Workflows
Diagram 1: Adenosine Dynamics and Technique Selection Logic
Diagram 2: FSCV Workflow for Adenosine
Diagram 3: Microdialysis Workflow for Adenosine
The Scientist's Toolkit: Research Reagent Solutions
Table 4: Essential Materials for FSCV and Microdialysis Adenosine Research
| Item | Function/Description | Typical Use In |
|---|---|---|
| Carbon-Fiber Microelectrode | Cylindrical or disk-shaped carbon fiber (5-10 µm diameter) serves as the working electrode for high-speed electrochemical detection. | FSCV |
| Triethylamine (TEA) / Sodium Chloride | Added to the aCSF for FSCV to enhance adenosine oxidation signal and provide ionic strength. | FSCV |
| Custom FSCV Waveform Software | Software (e.g., TarHeel CV, HDCV) to apply the high-voltage scan, collect current, and perform background subtraction. | FSCV |
| Microdialysis Probe | concentric design with a semi-permeable membrane (e.g., polyethersulfone, 20-100 kDa MWCO) to allow diffusion of analytes. | Microdialysis |
| Artificial Cerebrospinal Fluid (aCSF) | Physiological perfusion fluid (NaCl, KCl, CaCl2, MgCl2, NaHCO3, etc.) used to perfuse the microdialysis probe. | Microdialysis, FSCV |
| Inverse Dialysis Calibrator | A known concentration of adenosine (or an inert compound like dexamethasone) perfused through the probe to estimate in vivo recovery. | Microdialysis |
| LC-MS/MS Adenosine Assay Kit | Optimized reagents, columns, and standards for sensitive, specific quantification of adenosine in dialysate samples. | Microdialysis |
| Stereotaxic Atlas & Frame | Precise surgical apparatus for targeting specific brain coordinates in rodent models. | FSCV, Microdialysis |
| Adenosine Receptor Agonists/Antagonists | Pharmacological tools (e.g., CGS 21680, SCH 58261) to manipulate adenosine signaling and validate measured responses. | FSCV, Microdialysis |
Within the ongoing methodological debate comparing Fast-Scan Cyclic Voltammetry (FSCV) and microdialysis for adenosine measurement in neuroscience and drug development research, the principles of sensitivity and specificity are paramount. This guide objectively compares the performance of these two principal techniques in quantifying extracellular adenosine, focusing on their respective limits of detection (LOD) and the strategies required for analytic confirmation. The choice of method critically influences data interpretation in studies of neuromodulation, ischemia, and therapeutic response.
Performance Comparison: FSCV vs. Microdialysis for Adenosine
The following table summarizes key performance metrics based on recent experimental literature.
Table 1: Comparative Performance of FSCV and Microdialysis for Adenosine Measurement
| Parameter | Fast-Scan Cyclic Voltammetry (FSCV) | Microdialysis |
|---|---|---|
| Typical Limit of Detection (LOD) | 10-50 nM | 0.5-2 nM (with HPLC/LC-MS detection) |
| Temporal Resolution | Sub-second to seconds (≤ 100 ms) | Minutes to tens of minutes (5-20 min samples) |
| Spatial Resolution | Excellent (micrometer-scale at carbon fiber electrode) | Poor (millimeter-scale probe membrane) |
| Chemical Specificity (Inline) | Moderate (relies on voltammetric fingerprint) | High (post-sample analysis via HPLC/LC-MS) |
| Tissue Damage/Invasiveness | Low (single microelectrode penetration) | High (larger probe implantation, flow perturbation) |
| Ability for Analytic Confirmation | Requires adjunct techniques (e.g., enzyme assays, pharmacology) | Built-in via chromatographic separation & mass spec |
| Primary Strength | Real-time kinetics of adenosine release/uptake | High specificity, ability to multiplex many analytes |
| Key Limitation | Challenges in definitively confirming analyte identity | Low temporal resolution, diffusional blurring |
Experimental Protocols for Key Comparisons
Protocol 1: Determining Adenosine LOD via FSCV
Objective: To establish the lowest detectable concentration of adenosine using FSCV at a carbon-fiber microelectrode. Methodology:
- Electrode Preparation: A single carbon-fiber microelectrode (diameter 5-7 µm) is sealed in a pulled glass capillary and back-filled with electrolyte. It is conditioned via successive voltammetric scans.
- FSCV Parameters: Apply a triangular waveform (-0.4 V to +1.5 V and back vs. Ag/AgCl, 400 V/s, 10 Hz repetition rate). The current at the adenosine oxidation peak (~+1.2 V) is monitored.
- Calibration: Perform flow injection analysis with a series of adenosine standards in artificial cerebrospinal fluid (aCSF; e.g., 0, 25, 50, 100, 250, 500 nM).
- Data Analysis: Plot background-subtracted oxidation current against concentration. The LOD is calculated as three times the standard deviation of the current from the blank (0 nM) solution divided by the slope of the calibration curve.
Protocol 2: Determining Adenosine LOD via Microdialysis with LC-MS/MS
Objective: To establish the LOD for adenosine in collected microdialysate. Methodology:
- Probe Implantation & Perfusion: A concentric microdialysis probe (e.g., 1-4 mm membrane) is implanted in the target brain region. aCSF is perfused at 1 µL/min.
- Sample Collection: Dialysate is collected in vials containing a stabilizer (e.g., EDTA, adenosine deaminase inhibitor) at 10-20 minute intervals.
- LC-MS/MS Analysis: Samples are injected onto a reverse-phase C18 column. Adenosine is separated isocratically or via a gradient (mobile phase: water/methanol with 0.1% formic acid).
- Detection & Quantification: Adenosine is detected via tandem mass spectrometry in Multiple Reaction Monitoring (MRM) mode using a characteristic precursor→product ion transition (e.g., m/z 268→136). A calibration curve is constructed from standard samples.
- LOD Calculation: The LOD is defined as the concentration yielding a signal-to-noise ratio of 3:1 in the chromatogram.
Visualizing the Analytic Confirmation Workflow
A critical distinction between techniques is the pathway to confirming that the measured signal is adenosine.
Figure 1: Confirmation Pathways for Adenosine Measurement
The Scientist's Toolkit: Key Research Reagent Solutions
Table 2: Essential Materials for Adenosine Measurement Research
| Item | Function & Relevance |
|---|---|
| Carbon-Fiber Microelectrodes | The sensing element for FSCV. Small diameter minimizes tissue damage and enables high spatial resolution for detecting local adenosine fluctuations. |
| Adenosine Deaminase Inhibitor (e.g., EHNA) | Critical reagent for microdialysis sample stabilization. Prevents enzymatic degradation of adenosine in collected dialysate, preserving accurate concentration. |
| Artificial Cerebrospinal Fluid (aCSF) | Ionic buffer mimicking brain extracellular fluid. Used for electrode calibration (FSCV), as perfusate (microdialysis), and in vivo applications. |
| Adenosine Receptor Agonists/Antagonists (e.g., CGS-21680, SCH-442416) | Pharmacological tools for confirmatory experiments. Used to manipulate adenosine signaling or verify the source of a voltammetric signal in FSCV. |
| LC-MS/MS Grade Solvents & Standards | Essential for achieving low nM-pM LODs in microdialysis. High-purity adenosine isotope-labeled internal standards (e.g., 13C10-adenosine) enable precise quantification. |
| Enzyme-linked Assay Kits (for validation) | Provide an orthogonal method for adenosine quantification. Often used post-FSCV experiment to chemically confirm analyte identity from tissue samples. |
| High-Precision Microsyringe Pump | For controlled, pulseless perfusion of microdialysis probes. Flow rate stability is critical for accurate relative recovery calculations. |
The selection of a neurochemical sampling technique is fundamentally governed by its inherent invasiveness and the subsequent biological response it elicits. This comparison is central to the thesis evaluating Fast-Scan Cyclic Voltammetry (FSCV) and Microdialysis for adenosine measurement. FSCV, typically employing acute, small-diameter carbon-fiber microelectrodes, causes minimal initial trauma but may still trigger a localized, transient acute response. In contrast, microdialysis requires the chronic implantation of a larger probe membrane, inducing a more substantial and sustained chronic tissue response, including gliosis and inflammation, which can alter analyte diffusion and local physiology. The temporal profile of adenosine—a rapid, phasic signaling molecule versus a slower tonic modulator—directly interfaces with these measurement considerations.
Comparative Performance: FSCV vs. Microdialysis for Adenosine
Table 1: Core Performance Comparison for Adenosine Measurement
| Feature | Fast-Scan Cyclic Voltammetry (FSCV) | Conventional Microdialysis |
|---|---|---|
| Temporal Resolution | Sub-second to seconds (Real-time) | Minutes (5-20 min typical) |
| Spatial Resolution | Micrometer (single cell/process scale) | Millimeter (tissue volume scale) |
| Probe Size (Diameter) | ~7 µm (carbon fiber) | 200-500 µm (canula + membrane) |
| Invasiveness (Acute) | Low (minimal tissue displacement) | High (significant tissue trauma) |
| Chronic Tissue Response | Mild, localized glial encapsulation | Significant, forming a fibrotic sheath |
| Adenosine Measurement Type | Phasic, rapid release/clearance events | Tonic, basal extracellular concentration |
| Recovery/Efficiency | Not applicable (direct detection) | Low & variable (requires calibration) |
| In Vivo Applicability | Acute, brief recordings favored | Suited for chronic/long-term implants |
Table 2: Experimental Data Summary from Recent Studies (2020-2023)
| Study Focus | FSCV Key Data | Microdialysis Key Data | Implication for Adenosine Research |
|---|---|---|---|
| Basal Adenosine | Challenging to quantify due to adsorption | Reported basal levels: 50-300 nM in rodent brain | Microdialysis provides tonic levels; FSCV may miss low basal signals. |
| Evoked Adenosine Release | Transient peaks (~1-2 sec) reaching µM concentrations post-stimulus. | Slow rise over minutes, often undetected for brief stimuli. | FSCV captures rapid adenosine signaling relevant to neural plasticity. |
| Inflammation Impact | Signal attenuation ~40% after 2 hrs post-implant in inflamed tissue. | Analyte recovery drops ~60% by 24 hrs due to gliosis and barrier formation. | Both techniques compromised by response; timing critical for FSCV. |
| Co-detection with Dopamine | Direct, simultaneous detection with sub-second kinetics. | Possible only with HPLC, losing temporal correlation. | FSCV is superior for studying purine-catecholamine interactions. |
Experimental Protocols for Key Cited Studies
Protocol A: FSCV for Acute Adenosine Transients in Rodent Striatum
- Electrode Fabrication: Pull a single carbon fiber (7 µm diameter) into a glass capillary, seal with epoxy, and bevel at ~45°.
- Waveform Application: Use a triangular waveform (-0.4 V to +1.5 V vs. Ag/AgCl, 400 V/s, 10 Hz).
- Surgical Implantation: Anesthetize rat, perform craniotomy, and stereotaxically lower the carbon-fiber microelectrode into the striatum.
- Stimulation: Place a bipolar stimulating electrode in the nearby forelimb area. Apply a brief electrical train (60 Hz, 2 sec, 300 µA).
- Data Acquisition: Record current changes at the oxidation peak for adenosine (~1.3-1.5 V). Use principal component analysis (PCA) for chemometric separation from co-released species.
- Post-experiment: Confirm placement via histological examination.
Protocol B: Microdialysis for Tonic Adenosine in Chronic Mouse Model
- Probe Preparation: Use a concentric style microdialysis probe with 3 mm polyethersulfone membrane (300 kDa MWCO). Perfuse with artificial cerebrospinal fluid (aCSF) at 1 µL/min overnight.
- Chronic Implantation: Stereotaxically implant guide cannula under aseptic surgery. Allow 48-hour recovery for acute inflammation to subside.
- Dialysate Collection: Insert probe, begin perfusion at 0.2 µL/min (to increase relative recovery). After 2-hour equilibrium, collect samples every 15-20 minutes into vials containing EDTA.
- Adenosine Analysis: Quantify dialysate adenosine via Ultra-Performance Liquid Chromatography with tandem mass spectrometry (UPLC-MS/MS).
- Recovery Calibration: Perform retrodialysis post-experiment: perfuse with known adenosine concentration and calculate relative loss.
- Histology: Perfuse-fix brain, section, and stain for GFAP (astrocytes) and IBA1 (microglia) to assess glial scarring.
Visualization of Key Concepts
Title: Tissue Response Timeline: FSCV vs. Microdialysis
Title: Adenosine Dynamics and Technique Alignment
The Scientist's Toolkit: Research Reagent Solutions
Table 3: Essential Materials for FSCV and Microdialysis Adenosine Research
| Item | Function/Application | Key Consideration for Tissue Response |
|---|---|---|
| Carbon Fiber Microelectrodes (FSCV) | Direct electrochemical detection of adenosine. Small size minimizes acute trauma. | Pre-coating with Nafion can improve selectivity but may increase tip size. |
| Triangular Waveform Generator (FSCV) | Applies the voltage sweep for redox cycling of adenosine. | Optimized "adenosine waveform" reduces adsorption and fouling. |
| Concentric Microdialysis Probes (MD) | Semi-permeable membrane for in vivo sampling of extracellular fluid. | Membrane material (e.g., polyethersulfone) influences protein fouling and glial attachment. |
| Artificial Cerebrospinal Fluid (aCSF) | Perfusate for microdialysis; physiological buffer for FSCV reference. | Must include adenosine deaminase inhibitors (e.g., EHNA) to prevent degradation. |
| EHNA (Erythro-9-AHA) | Adenosine deaminase inhibitor. Used in perfusate to stabilize sampled adenosine. | Critical for accurate measurement; affects only sampled analyte, not tissue. |
| UPLC-MS/MS System | High-sensitivity quantification of adenosine from dialysate. | Enables low flow rate microdialysis, improving recovery and reducing invasiveness. |
| GFAP & IBA1 Antibodies | Histological markers for astrocytes and microglia, respectively. | Essential for quantifying glial scarring and chronic tissue response post-implant. |
| Local Anesthetic/Anti-inflammatory (e.g., Lidocaine, Dexamethasone) | Used during/immediately after surgery to mitigate acute inflammatory response. | Can confound pharmacological studies; use must be consistent and reported. |
Thesis Context: This guide compares the performance of Fast-Scan Cyclic Voltammetry (FSCV) and Microdialysis in measuring extracellular adenosine across three distinct neurobiological domains: cerebral ischemia, sleep/wake regulation, and substance use disorders. The evaluation is framed within the broader thesis that the choice of methodology critically shapes the temporal and chemical resolution of adenosine data, thereby influencing mechanistic interpretations.
Methodological Comparison: FSCV vs. Microdialysis for Adenosine
Table 1: Core Technical Specifications and Performance Comparison
| Feature | Fast-Scan Cyclic Voltammetry (FSCV) | Microdialysis |
|---|---|---|
| Temporal Resolution | Sub-second to seconds (Real-time) | Minutes to tens of minutes (Averaged) |
| Spatial Resolution | Excellent (Micron-scale at carbon fiber) | Good (Millimeter-scale probe membrane) |
| Chemical Specificity | Challenge: Requires waveform optimization to separate adenosine from metabolites (e.g., inosine, guanosine) and other electroactive interferents (e.g., adenosine monophosphate). | Strength: High via post-sample analysis (e.g., HPLC, LC-MS). Separates adenosine, its metabolites, and purines. |
| Invasiveness | Low (Thin carbon fiber electrode, ~7µm diameter) | High (Larger probe implantation, ~200+µm diameter) |
| Key Measurable | Rapid, transient release events (e.g., during ischemia, behavior). | Stable, tonic levels and metabolite ratios. |
| Primary Data | Adenosine concentration changes relative to baseline. | Absolute extracellular adenosine concentration. |
| Best Application | Phasic signaling, transient release kinetics, behavioral correlates. | Steady-state monitoring, metabolic profiling, pharmacodynamics. |
Table 2: Comparative Insights from Key Research Domains
| Research Domain | Key Insight from FSCV Studies | Key Insight from Microdialysis Studies | Methodological Implication |
|---|---|---|---|
| Cerebral Ischemia | Rapid, massive (µM) adenosine release occurs within seconds of an ischemic event (e.g., vessel occlusion), acting as an immediate neuroprotective signal. | Shows sustained elevated adenosine levels over minutes to hours post-ischemia, correlating with infarct size and metabolic crisis. | FSCV captures the triggering event; microdialysis profiles the prolonged consequence. |
| Sleep/Wake Regulation | Detects transient (seconds) adenosine surges in sleep-regulating nuclei (e.g., basal forebrain) immediately following spontaneous wakefulness or motor activity. | Documents a gradual tonic increase in adenosine levels in key brain regions across prolonged wakefulness, decreasing during sleep. | FSCV links adenosine to moment-to-moment state transitions; microdialysis links it to homeostatic sleep pressure. |
| Addiction (e.g., Cocaine) | Reveals fast (sub-second) dopamine-like release of adenosine in reward circuits (e.g., NAc) concurrent with drug-related cues or administration. | Shows slower, persistent alterations in baseline adenosine and metabolite levels during withdrawal and reinstatement phases. | FSCV identifies adenosine's role in acute reinforcement signaling; microdialysis in long-term neuroadaptation. |
Experimental Protocols
Protocol 1: FSCV for Transient Adenosine in Ischemia
- Electrode Preparation: A carbon-fiber microelectrode (diameter ~7 µm) is prepared and inserted into the brain region of interest (e.g., striatum) in an anesthetized rat.
- Waveform Application: A triangular waveform (-0.4V to +1.5V to -0.4V, 400 V/s) is applied at 10 Hz. This waveform oxidizes adenosine at ~1.4V.
- Ischemia Induction: Focal ischemia is induced via transient middle cerebral artery occlusion (MCAO).
- Data Acquisition: Current changes at adenosine's oxidation potential are recorded in real-time, converted to concentration via in vitro calibration.
- Data Analysis: The peak amplitude and kinetics (rise time, decay) of the adenosine transient are analyzed.
Protocol 2: Microdialysis for Tonic Adenosine in Sleep Homeostasis
- Probe Implantation: A guide cannula is implanted above the basal forebrain in a rat. After recovery, a microdialysis probe (2-4 mm membrane) is inserted.
- Perfusion: Artificial cerebrospinal fluid (aCSF) is perfused through the probe at 0.5-2 µL/min.
- Sample Collection: Dialysate is collected in 10-30 minute fractions across the sleep-wake cycle (polysomnographically verified).
- Analysis: Samples are analyzed via high-performance liquid chromatography coupled with ultraviolet or mass spectrometric detection (HPLC-UV/LC-MS).
- Quantification: Adenosine concentrations are quantified by comparing peak areas/ions to external standards. Data are often expressed relative to baseline or across behavioral states.
Signaling and Workflow Diagrams
Title: Adenosine Signaling Pathway in Cerebral Ischemia
Title: Complementary Workflow of FSCV and Microdialysis
The Scientist's Toolkit: Key Research Reagent Solutions
| Item | Function in Adenosine Research |
|---|---|
| Carbon-Fiber Microelectrode | The sensing element for FSCV. Provides high spatial/temporal resolution for detecting adenosine oxidation current. |
| Triangular Waveform (e.g., -0.4V to +1.5V) | The applied voltage protocol for FSCV that defines electrochemical selectivity, optimizing separation of adenosine from interferents. |
| Microdialysis Probe (e.g., BR-style) | Semi-permeable membrane implanted in tissue to collect analytes from the extracellular space via diffusion for later analysis. |
| Artificial Cerebrospinal Fluid (aCSF) | The physiological perfusion fluid for microdialysis, maintaining ionic balance and minimizing tissue disturbance during sampling. |
| Ectonucleotidase Inhibitors (e.g., ARL67156) | Pharmacological tool used to block the enzymatic breakdown of ATP/ADP/AMP to adenosine, helping to isolate release mechanisms. |
| Adenosine Receptor Antagonists (e.g., DPCPX, SCH58261) | Selective blockers for A1 and A2A receptors, respectively, used to dissect the functional outcomes of adenosine signaling. |
| HPLC-UV/LC-MS System | The analytical backbone for microdialysis. Separates and quantifies adenosine and its metabolites (inosine, hypoxanthine) with high specificity. |
| Calibration Solutions (Adenosine standards) | Essential for both methods: in vitro calibration converts FSCV current to concentration and provides standard curves for HPLC/LC-MS quantification. |
For researchers investigating the neuromodulator adenosine, selecting the appropriate in vivo sampling technique is a critical methodological decision. Fast-scan cyclic voltammetry (FSCV) and microdialysis represent two dominant yet philosophically distinct approaches. This guide objectively compares their performance within adenosine research, framing the discussion around a central thesis: FSCV and microdialysis are not simply competing alternatives but are fundamentally complementary, with their optimal application dictated by the specific spatiotemporal and biochemical questions being asked.
Performance Comparison: FSCV vs. Microdialysis for Adenosine
The table below summarizes the core comparative performance data based on established experimental literature and recent studies.
Table 1: Quantitative Comparison of FSCV and Microdialysis for Adenosine Measurement
| Feature | Fast-Scan Cyclic Voltammetry (FSCV) | Microdialysis |
|---|---|---|
| Temporal Resolution | Sub-second to seconds (≤ 100 ms) | Minutes to tens of minutes (5-20 min typical) |
| Spatial Resolution | Excellent (micron-scale at carbon fiber) | Good (mm-scale probe membrane length) |
| Measurement Type | Direct, real-time detection of oxidation/reduction. | Offline analysis of collected dialysate (HPLC, MS). |
| Invasiveness | Lower (single or few carbon fibers). | Higher (larger probe implantation, greater tissue disruption). |
| Chemical Specificity | Moderate (relies on waveform & background subtraction). | High (coupling with separations like HPLC). |
| Absolute Concentration | Semi-quantitative; measures relative change. | Quantitative with calibration (in vitro recovery). |
| Primary Output | Rapid phasic fluctuations (e.g., adenosine transients). | Tonic, baseline extracellular levels. |
| Key Limitation | Cannot directly distinguish some oxidizable interferents (e.g., adenosine vs. guanosine). | Misses rapid transient signaling; low temporal fidelity. |
| Best For | Real-time kinetics of adenosine release/clearance evoked by stimuli (e.g., electrical, behavioral). | Measuring steady-state levels, drug-induced slow shifts, and multiplexing with other analytes. |
Experimental Protocols & Methodologies
Key Protocol 1: FSCV for Detecting Adenosine Transients
- Carbon Fiber Electrode Preparation: A single cylindrical carbon fiber (Ø 5–7 µm) is sealed in a glass capillary and polished.
- Waveform Application: A triangular waveform (e.g., -0.4 V to 1.5 V and back at 400 V/s) is applied at 10 Hz.
- Background Subtraction: Current is continuously measured. A background current (stable capacitive current) is subtracted, highlighting Faradaic changes.
- In Vivo Implantation: The electrode is implanted into the brain region of interest (e.g., striatum, hippocampus) alongside a reference Ag/AgCl electrode.
- Stimulation & Detection: A bipolar stimulating electrode is placed nearby. Electrical stimulation (e.g., 60 Hz, 2 s) evokes rapid adenosine release, detected as a characteristic oxidation peak at ~1.5 V on the cyclic voltammogram.
- Data Analysis: Current at the adenosine oxidation potential is converted to relative concentration via in vitro calibration. Transient timing and amplitude are analyzed.
Key Protocol 2: Microdialysis for Basal Adenosine Quantification
- Probe Implantation: A concentric microdialysis probe with a semi-permeable membrane (2–4 mm length, 20 kDa MWCO) is stereotaxically implanted 24+ hours prior to experiment to mitigate acute injury effects.
- Perfusion: The probe is perfused with artificial cerebrospinal fluid (aCSF) at a low flow rate (1–2 µL/min) to achieve high relative recovery.
- Dialysate Collection: After a stabilization period (~90 min), sequential dialysate samples are collected into vials containing EDTA to prevent degradation every 10-20 minutes.
- Analysis (HPLC-MS/MS):
- Sample Injection: Dialysate is injected onto a reverse-phase HPLC column.
- Separation: Adenosine is separated from other purines (inosine, hypoxanthine) and matrix components.
- Detection & Quantification: Mass spectrometry in MRM mode provides high-specificity detection. Absolute concentration is calculated against a standard curve.
- In Vivo Recovery Calibration: After collection, in vivo recovery (relative loss/gain) is estimated via retrodialysis or zero-flow methods to estimate true extracellular concentration.
Visualizing Complementary Workflows and Pathways
Diagram 1: Decision logic for method selection in adenosine research.
Diagram 2: Complementary experimental workflows for adenosine.
The Scientist's Toolkit: Research Reagent Solutions
Table 2: Essential Materials for FSCV and Microdialysis Adenosine Research
| Item | Function | Typical Application |
|---|---|---|
| Cylindrical Carbon Fiber Microelectrode | Sensing element for FSCV. Provides high temporal and spatial resolution for electrochemical detection of adenosine oxidation. | FSCV |
| Triangle Waveform Generator | Applies the specific voltage sweep to the electrode, defining the redox window for adenosine detection. | FSCV |
| High-speed Potentiostat (Nanoamp) | Measures minute Faraday currents at the carbon fiber surface during voltage application. | FSCV |
| Concentric Microdialysis Probe (20 kDa MWCO) | Semi-permeable membrane allows diffusion of adenosine from extracellular fluid into the perfusate. | Microdialysis |
| Micro-syringe Pump | Provides pulseless, precise low flow rate (µL/min) perfusion of aCSF through the microdialysis probe. | Microdialysis |
| Fraction Collector | Automates time-based collection of microdialysate into vials for offline analysis. | Microdialysis |
| Artificial CSF (aCSF) | Physiological perfusion fluid for microdialysis; ion composition matches brain ECF to minimize perturbation. | Microdialysis, FSCV (for calibration) |
| HPLC System with C18 Column | Separates adenosine from other purines and contaminants in dialysate prior to detection. | Microdialysis |
| Tandem Mass Spectrometer (MS/MS) | Provides gold-standard specificity and sensitivity for quantifying adenosine concentration in dialysate. | Microdialysis |
| Adenosine Standard & Stable Isotope Labeled Internal Standard | Critical for creating calibration curves and correcting for matrix effects in MS quantification. | Microdialysis (Primary), FSCV (Calibration) |
Conclusion
The choice between FSCV and microdialysis for adenosine measurement is not a matter of one technique being universally superior, but of aligning methodological strengths with specific research intents. FSCV is unparalleled for investigating the rapid, phasic dynamics of adenosine signaling on a sub-second timescale, crucial for understanding its moment-to-moment neuromodulatory actions. In contrast, microdialysis provides a robust platform for measuring tonic levels, assessing neurochemical panels, and performing pharmacological manipulations over longer durations with high chemical specificity. For comprehensive studies, these methods can be complementary. Future directions will involve further miniaturization and biocompatibility of FSCV sensors, integration with wireless technology, and the development of novel biosensors or hybrid approaches that combine the temporal resolution of FSCV with the molecular specificity of chromatography. Ultimately, this methodological precision is foundational for advancing our understanding of adenosine in brain health and disease, directly informing targeted therapeutic development for neurological and psychiatric disorders.