AAV Delivery for Biosensors: A Complete Guide to Viral Vector Strategies, Optimization & In Vivo Application
This article provides a comprehensive overview of adeno-associated virus (AAV)-mediated delivery for genetically encoded biosensors, targeting researchers and drug development professionals.
AAV Delivery for Biosensors: A Complete Guide to Viral Vector Strategies, Optimization & In Vivo Application
Abstract
This article provides a comprehensive overview of adeno-associated virus (AAV)-mediated delivery for genetically encoded biosensors, targeting researchers and drug development professionals. It covers the foundational principles of AAV serotype selection and biosensor design, detailed methodological protocols for in vivo and in vitro applications, critical troubleshooting steps for optimizing transduction efficiency and biosensor function, and rigorous validation frameworks for comparing performance. The guide synthesizes current best practices to enable reliable, high-signal biosensor deployment in complex biological systems.
Foundations of AAV-Biosensor Systems: Understanding Serotypes, Construct Design, and Expression Principles
1. Introduction: AAVs in the Context of Genetically Encoded Biosensors Research The efficacy of genetically encoded biosensors for in vivo monitoring of cellular dynamics hinges on efficient, safe, and sustained delivery. Within the broader thesis on viral delivery methods, Adeno-Associated Virus (AAV) vectors have emerged as the premier platform, offering a unique confluence of safety, cell-type specificity (tropism), and durable transgene expression. These core advantages directly address the critical requirements for biosensor research: minimal perturbation of the biological system, precise targeting of relevant cell populations, and stable signal acquisition over physiologically relevant timescales.
2. Core Advantage Analysis: Quantitative Comparison The table below summarizes key quantitative attributes of AAV vectors that underpin their utility for biosensor delivery, compared to other common viral vectors.
Table 1: Quantitative Comparison of Viral Vectors for Biosensor Delivery
| Vector Attribute | AAV | Lentivirus (LV) | Adenovirus (AdV) |
|---|---|---|---|
| Packaging Capacity | ~4.7 kb | ~8 kb | ~8-36 kb |
| Integration Profile | Predominantly episomal; rare non-homologous integration | Stable integration into host genome | Non-integrating, episomal |
| Typical In Vivo Expression Onset | 1-2 weeks | 2-5 days | 1-3 days |
| Peak Expression Duration | Months to years* | Long-term (due to integration) | 1-4 weeks (transient) |
| Immunogenicity Risk | Low | Moderate | Very High |
| Common Serotype Diversity | >100 (e.g., AAV1, AAV2, AAV5, AAV6, AAV8, AAV9, AAV-PHP.eB, AAV-Rh10) | Limited (VSV-G pseudotyping common) | Multiple serotypes |
| Primary Biosensor Application | Long-term expression in post-mitotic cells (neurons, cardiomyocytes) | Long-term expression in dividing cells | Rapid, high-level transient expression |
*Duration is tissue and serotype-dependent.
3. Detailed Protocols for Key Experiments
Protocol 3.1: In Vivo Tropism Validation for AAV-Biosensor Constructs Objective: To empirically determine the cellular tropism and expression efficiency of a novel AAV serotype carrying a genetically encoded calcium indicator (e.g., jGCaMP8s) in the mouse brain. Materials: Purified AAV (serotype of interest, e.g., AAV9 or AAV-PHP.eB) harboring jGCaMP8s under a pan-neuronal promoter (e.g., hSyn1); Sterile PBS; Adult C57BL/6 mice; Stereotaxic apparatus; Hamilton syringe; Isoflurane anesthesia system; Post-operative analgesics. Procedure:
- Virus Preparation: Thaw AAV on ice and dilute to working titer (e.g., 1x10^13 vg/mL) in sterile PBS.
- Stereotaxic Surgery: Anesthetize mouse and secure in stereotaxic frame. Perform a craniotomy at the target coordinate (e.g., primary visual cortex: AP -3.5 mm, ML +2.5 mm from Bregma).
- Microinjection: Lower a 33-gauge Hamilton syringe to DV -0.5 mm from the brain surface. Inject 300 nL of AAV solution at a rate of 100 nL/min. Wait 5 minutes post-injection before slowly retracting the syringe.
- Recovery & Expression: Allow animal to recover with analgesia. Permit 3-4 weeks for optimal biosensor expression.
- Validation: Perfuse-fix the brain, section, and immunostain for neuronal (NeuN) and glial (GFAP) markers. Image using confocal microscopy. Quantify colocalization of jGCaMP8s fluorescence with cell-specific markers to determine tropism and specificity.
Protocol 3.2: Assessing Long-term Biosensor Expression Stability Objective: To quantify the stability of biosensor fluorescence intensity over an extended period post-AAV delivery. Materials: Mice injected with AAV-biosensor (from Protocol 3.1); In vivo two-photon microscopy setup; Image analysis software (e.g., ImageJ, Python). Procedure:
- Baseline Imaging: At 4 weeks post-injection, perform initial two-photon imaging of the transfected region. Use identical laser power, gain, and detection settings for all subsequent sessions.
- Longitudinal Imaging: Re-image the same field of view (using vascular landmarks) at regular intervals (e.g., 2, 4, 6, and 12 months post-injection).
- Quantitative Analysis: For each session, measure the mean fluorescence intensity (F) of biosensor-positive somata in the field of view. Normalize all values to the baseline (F0) measurement.
- Data Presentation: Plot normalized fluorescence (F/F0) over time. A stable plateau indicates long-term expression. Monitor for signal decay or inflammatory changes.
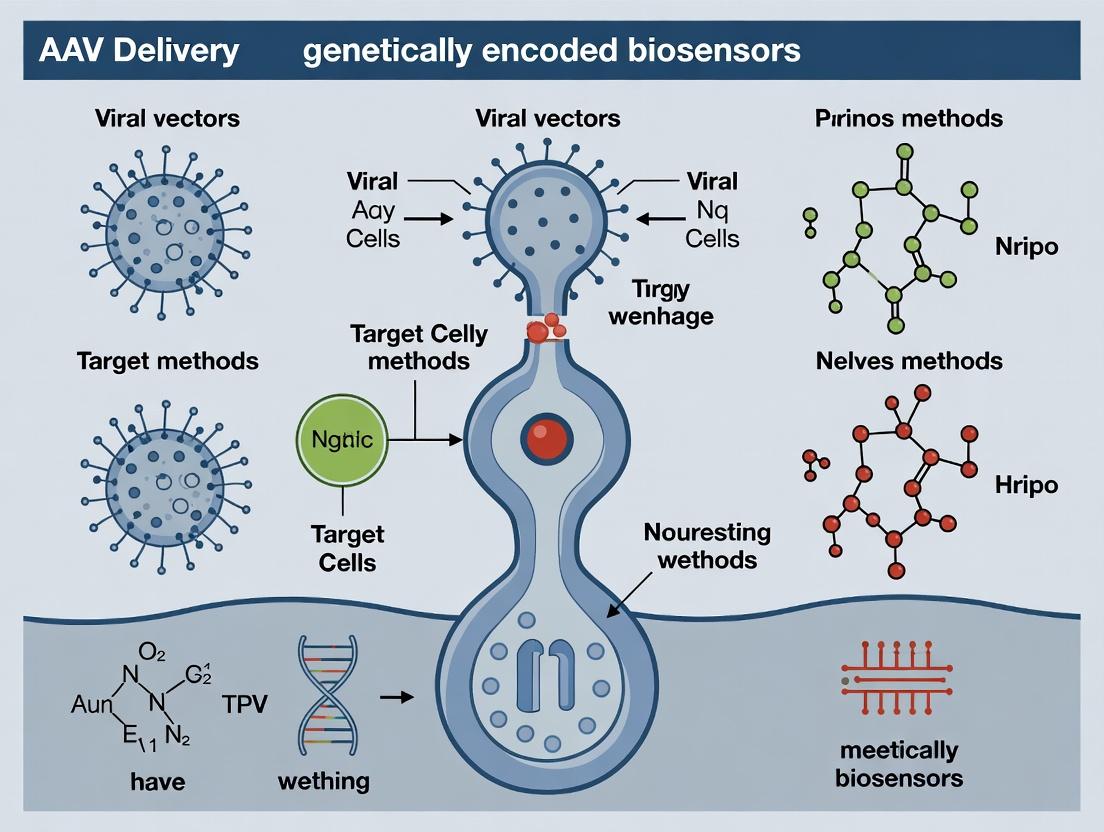
4. Visualizing Key Concepts and Workflows
Title: AAV Biosensor Delivery & Expression Workflow
Title: AAV Cellular Entry and Biosensor Expression Pathway
5. The Scientist's Toolkit: Key Research Reagent Solutions Table 2: Essential Materials for AAV-Biosensor Research
| Item | Function & Application |
|---|---|
| AAV Serotype Libraries (e.g., AAV1, AAV8, AAV9, PHP variants) | Enable empirical testing of tissue/cell tropism for optimal biosensor targeting. |
| Cell-Type Specific Promoters (e.g., hSyn1 (neuronal), GFAP (astrocyte), CAG (ubiquitous)) | Restrict biosensor expression to cell populations of interest, enhancing signal specificity. |
| High-Titer AAV Purification Kits (Iodixanol gradient, affinity chromatography) | Produce clean, concentrated viral stocks essential for in vivo efficacy and reduced immunogenicity. |
| Genetically Encoded Biosensor Plasmids (e.g., GCaMP, iGluSnFR, jRGECO1a) | Donor plasmids for packaging into AAV; the core molecular tool for sensing physiological parameters. |
| Helper Plasmid Systems (e.g., pXX6-80 for adenovirus genes) | Provide necessary replication and packaging functions in trans during AAV production in HEK293 cells. |
| In Vivo Imaging-Compatible Cranial Windows | Allow chronic optical access to the brain for longitudinal biosensor imaging post-AAV delivery. |
| Stereotaxic Injection Apparatus | Enables precise, repeatable delivery of AAV vectors to deep brain structures or specific tissue regions. |
| Tropism Validation Antibodies (e.g., anti-NeuN, anti-GFAP, anti-Iba1) | Used for immunohistochemistry to confirm cell-type specificity of AAV-driven biosensor expression. |
Within the critical research framework of deploying genetically encoded biosensors, selecting the optimal adeno-associated virus (AAV) serotype and engineered capsid is paramount. This selection dictates the efficiency and specificity of biosensor delivery to target cells in vivo, directly influencing experimental readout fidelity. This application note details the principles of AAV tropism and provides protocols for matching capsids to experimental goals in the central nervous system (CNS), peripheral tissues, and specific organs.
The natural and engineered tropisms of AAV capsids are quantified by transduction efficiency, often measured as vector genome (vg) copies per cell or relative expression units (e.g., fluorescence). The following table summarizes key data for common serotypes and selected engineered variants.
Table 1: AAV Serotype & Capsid Tropism Profiles for Biosensor Delivery
| Serotype / Capsid | Primary Tropism (High Efficiency) | Common Administration Route(s) | Typical Dose Range (vg/kg) | Reported Transduction Efficiency (Relative) | Key Receptor/Mechanism |
|---|---|---|---|---|---|
| AAV9 | CNS (neurons, astrocytes), Heart, Liver, Muscle | Intravenous (IV), Intracerebroventricular (ICV), Intrathecal (IT) | 1e11 - 1e13 | High (pan-neuronal), Moderate (other tissues) | Galactose, LamR |
| AAV-PHP.eB | CNS (neurons) - Enhanced BBB crossing in C57BL/6 mice | IV, Intraperitoneal (IP) | 1e11 - 1e12 | Very High (CNS after systemic) | Ly6a (mouse-specific) |
| AAV-PHP.S | Peripheral Nervous System (PNS) | IV, IP | 1e11 - 1e12 | High (PNS ganglia), Low (CNS) | Unknown |
| AAVrh.10 | CNS (neurons), Retina | ICV, Intravitreal, IV | 1e11 - 1e13 | High (CNS), Moderate (Retina) | Unknown |
| AAV-DJ | Liver, Kidney, in vitro (broad) | IV, Local injection | 5e10 - 1e12 | High (Hepatocytes), Broad in vitro | HSPG, others |
| AAV8 | Liver, Pancreas, Muscle | IV, Intraductal (pancreatic) | 1e11 - 1e13 | Very High (Hepatocytes) | LDLR? |
| AAV2retro | Efficient retrograde transport in CNS & PNS | Local injection (muscle, brain region) | 5e10 - 1e11 | High (Projection neurons) | Unknown |
| AAV6 | Heart, Lung, Muscle | IV, Intramuscular, Intratracheal | 1e11 - 1e13 | High (Cardiomyocytes, Airway) | HSPG, Sialic acid |
| AAV1 | Skeletal Muscle, Heart | Intramuscular, IV | 1e10 - 1e12 | High (Muscle fibers) | Sialic acid |
| AAV5 | CNS (neurons, photoreceptors), Lung | ICV, Intravitreal, Intratracheal | 1e11 - 1e13 | Moderate-High (specific cell types) | PDGFR, Sialic acid |
Core Experimental Protocols
Protocol 1:In VivoScreening of AAV Capsids for CNS Biosensor Delivery
Goal: Identify the optimal capsid for robust neuronal biosensor expression after systemic administration. Materials: See "Scientist's Toolkit" Section 5. Procedure:
- Virus Preparation: Aliquot high-titer (>1e13 vg/mL) AAVs encoding a ubiquitous promoter (e.g., CAG, CBA) driving a fluorescent reporter (e.g., GFP). Test serotypes: AAV9, AAV-PHP.eB, AAV-PHP.S, AAVrh.10.
- Animal Preparation: Use adult C57BL/6 mice (n=4-5 per group). Ensure proper IACUC protocols are followed.
- Systemic Injection: Administer virus via tail vein IV injection at a dose of 1e11 vg per mouse in a 100 µL sterile saline volume.
- Perfusion & Tissue Collection: At 3-4 weeks post-injection, deeply anesthetize animals and transcardially perfuse with PBS followed by 4% PFA. Harvest brain, spinal cord, liver, and dorsal root ganglia (DRG).
- Tissue Processing: Post-fix tissue in 4% PFA (4-6 hrs), then cryoprotect in 30% sucrose. Section brains and DRG at 40 µm using a cryostat.
- Imaging & Analysis: Perform fluorescence microscopy (widefield or confocal). Quantify transduction efficiency by:
- Counting GFP+ cells in defined brain regions (cortex, striatum, cerebellum).
- Measuring mean fluorescence intensity in the liver.
- Assessing DRG neuronal labeling.
- Data Interpretation: The capsid yielding the highest neuronal signal with minimal off-target liver expression is optimal for systemic CNS biosensor delivery in this model.
Protocol 2: Local Delivery for Organ-Specific Biosensor Expression
Goal: Achieve high-density biosensor expression in a specific organ (e.g., liver, pancreas) via direct injection. Materials: See "Scientist's Toolkit" Section 5. Procedure:
- Virus & Model Selection: Use AAV8 or AAV-DJ for liver; AAV8 for pancreas. Use adult mice or rats.
- Surgical Exposure:
- Liver: Perform a midline laparotomy. Gently exteriorize the left lateral lobe.
- Pancreas: Perform a laparotomy and carefully locate the pancreas adjacent to the duodenum and spleen.
- Local Injection: Using a 33-gauge Hamilton syringe, slowly inject 20-50 µL of AAV (1e12 vg/mL) at multiple sites within the target tissue. Avoid leakage and vessel damage. Allow 1-2 minutes for pressure dissipation before needle withdrawal.
- Closure & Recovery: Return the organ to the abdominal cavity. Close the muscle and skin layers with sutures/clips. Monitor animals post-operatively.
- Validation: Harvest tissue at 2-3 weeks post-injection. Process for fluorescence imaging or immunohistochemistry. For biosensor function, prepare acute tissue slices for functional imaging (e.g., calcium imaging with GCamp).
Visualization of Key Concepts
Diagram 1: AAV Capsid Selection Workflow for Biosensor Research
Diagram 2: AAV Cellular Entry & Biosensor Expression Pathway
The Scientist's Toolkit
Table 2: Essential Research Reagents & Materials for AAV Biosensor Delivery Experiments
| Item Category | Specific Example / Product | Function in Protocol |
|---|---|---|
| AAV Capsids | AAV9, AAV-PHP.eB, AAV8, AAV-DJ, AAV2retro (commercially available or from core facilities) | The delivery vector; serotype dictates tissue tropism and entry pathway. |
| Biosensor Construct | Plasmid with biosensor gene (e.g., jGCaMP8, iGluSnFR) under cell-specific promoter (e.g., hSyn, CAG). | Genetic payload to be delivered; defines the biological parameter measured. |
| Purification Kit | Iodixanol gradient reagents or affinity chromatography columns (e.g., AVB Sepharose). | For purifying high-titer, high-quality AAV particles from producer cell lysates. |
| Titration Kit | ddPCR AAV Titration Kit (probe-based for ITR or transgene). | Accurately quantifies vector genome titer (vg/mL), critical for dosing. |
| In Vivo Injection Supplies | Sterile saline, 29-33G insulin syringes (IP/SC), Hamilton syringe (ICV/IT), heating lamp for tail vein. | For safe and accurate delivery of AAV preparation into the animal model. |
| Perfusion & Fixation | 1X PBS, 4% Paraformaldehyde (PFA) solution, peristaltic pump. | For animal transcardial perfusion to preserve tissue morphology for analysis. |
| Cryoprotection & Sectioning | 30% Sucrose in PBS, Optimal Cutting Temperature (O.C.T.) compound, cryostat. | Prepares fixed tissues for thin-sectioning to analyze transduction distribution. |
| Imaging & Analysis Software | Confocal/microscope, ImageJ/Fiji, Cell counter plugins. | For visualizing and quantitatively analyzing biosensor expression patterns. |
This document provides application notes and protocols for the design of genetic constructs for genetically encoded biosensors, specifically within the framework of adeno-associated virus (AAV)-based delivery for neuroscience and drug development research. The optimization of promoters, inclusion of introns, and overall cassette architecture are critical for achieving high, specific, and consistent expression of biosensors (e.g., GPCR-activation based (GRAB), Ca2+ indicators (GCaMP), voltage indicators) in target cells in vivo.
Promoter Selection: Quantitative Comparison
The choice of promoter dictates expression level, specificity, and temporal profile. For AAV-delivered biosensors, the limited packaging capacity (~4.7 kb) is a key constraint.
Table 1: Comparison of Ubiquitous vs. Cell-Type Specific Promoters for AAV Biosensors
| Promoter Name | Type | Approx. Size (bp) | Key Characteristics | Optimal Use Case in Biosensor Research |
|---|---|---|---|---|
| CAG (CBA + ß-actin intron) | Synthetic Ubiquitous | ~1.7 kb | Very strong, sustained expression in most mammalian cells. Can lead to overexpression artifacts. | Broad expression in diverse tissues; when maximum signal is prioritized over specificity. |
| hSyn (Human Synapsin I) | Neuron-Specific | ~0.45 kb | Drives strong expression in neurons (primarily excitatory and inhibitory). Minimal expression in glia. | Standard for pan-neuronal biosensor expression in the central and peripheral nervous system. |
| CaMKIIα | Cell-Type Specific | ~1.3 kb | Preferentially active in excitatory forebrain neurons (e.g., cortex, hippocampus). | Targeting biosensors to excitatory pyramidal neurons for circuit-specific studies. |
| GFAP (gfaABCD) | Cell-Type Specific | ~0.68 kb (minimal) | Astrocyte-specific promoter. Variants (e.g., gfaABCD) offer enhanced specificity and strength. | Expressing biosensors (e.g., GRAB neurotransmitters) in astrocytes to study gliotransmission. |
| EF1α | Ubiquitous | ~1.2 kb | Strong, consistent expression across many mammalian cell types. Often used in vitro. | In vitro screening and validation of biosensor constructs before in vivo AAV use. |
| Thy1 | Cell-Type Specific | ~6.5 kb (full) | Neuron-specific, but large genomic fragment. Often used in transgenic mice. | Not AAV-compatible in full form; shortened versions (~1.1 kb) are less specific. |
The Role of Introns in Expression Enhancement
Introns, particularly hybrid or synthetic introns placed 5' of the biosensor coding sequence, can significantly boost translational efficiency and expression levels in mammalian systems. This is crucial for biosensors where protein yield directly impacts signal-to-noise ratio.
Protocol 1: Insertion and Testing of a Synthetic Intron Objective: To enhance biosensor expression by cloning a synthetic intron into the 5' UTR of the AAV expression cassette. Materials:
- AAV transfer plasmid backbone (e.g., pAAV-Promoter-MCS).
- Biosensor cDNA (e.g., jGCaMP8s).
- Synthetic intron (e.g., derived from ß-globin or a hybrid like chimeric intron).
- Standard molecular biology reagents (restriction enzymes, ligase, competent cells). Method:
- Design: Select a well-characterized synthetic intron (typically 100-200 bp). Ensure it contains consensus splice donor (GT), branch point, and splice acceptor (AG) sites.
- Cloning: Use Gibson Assembly or restriction/ligation to insert the intron sequence immediately downstream of the promoter and upstream of the Kozak sequence and biosensor start codon.
- Validation: Sequence the final construct to confirm intron insertion and absence of mutations.
- Testing: Co-transfect the intron-containing and intron-less AAV plasmid constructs (with AAV Rep/Cap and Helper plasmids) into HEK293T cells for AAV production. Purify AAVs and transduce in vitro neuronal culture or in vivo target region. Compare biosensor fluorescence intensity and kinetics.
Expression Cassette Optimization Strategy
The optimal biosensor cassette balances promoter specificity, translational efficiency (introns), biosensor performance, and AAV packaging limits.
Protocol 2: Systematic AAV Biosensor Cassette Assembly & Testing Objective: To assemble and validate an optimized AAV biosensor construct for in vivo delivery. Workflow:
- Component Selection: Choose: a) Cell-specific promoter (e.g., hSyn for neurons), b) 5' synthetic intron, c) Biosensor cDNA (optimized codon usage for mammals), d) Optional: short epitope tag (e.g., HA, FLAG) at C-terminus for validation, e) PolyA signal (e.g., bovine growth hormone (bGH) or WPRE-SV40 for enhanced stability).
- Modular Assembly: Assemble components in a AAV-MCS plasmid using Golden Gate or Gibson Assembly. Critical: Verify total cassette size ≤ 4.7 kb.
- In Vitro Validation: Transfect plasmid into relevant cell line (e.g., Neuro2A for neuronal promoters). Confirm expression via fluorescence microscopy and functional validation (e.g., apply ligand for GRAB sensors).
- AAV Production: Package the cassette into AAV serotype of choice (e.g., AAV9 for broad CNS transduction, AAV-PHP.eB for enhanced blood-brain barrier crossing in mice) using PEI transfection in HEK293T cells and purify via iodixanol gradient.
- In Vivo Evaluation: Stereotactically inject AAV (e.g., 200-500 nL of 1e12-1e13 vg/mL) into target brain region of adult mice. Allow 3-6 weeks for expression. Perform histology to confirm cell-type specificity and functional imaging (e.g., two-photon microscopy) to assess biosensor performance.
Research Reagent Solutions
Table 2: Essential Toolkit for AAV Biosensor Construct Development
| Item | Function & Rationale |
|---|---|
| Modular AAV Cloning Vectors (e.g., pAAV from Addgene) | Backbone plasmids with inverted terminal repeats (ITRs) for packaging, allowing easy swapping of promoters, introns, and transgenes. |
| Promoter & Intron Plasmid Libraries | Repository of pre-cloned, sequence-verified ubiquitous and cell-specific promoters/introns for rapid construct assembly. |
| Biosensor cDNA Plasmids | Source plasmids for latest-generation biosensors (GCaMP, jRGECO, GRAB, dLight, ASAP). |
| AAV Serotype-specific Rep/Cap Plasmid | Provides viral replication and capsid proteins for packaging (e.g., AAV2/9 for Rep2/Cap9). |
| Adenoviral Helper Plasmid | Supplies necessary non-AAV genes (E4, E2a, VA) for AAV production in HEK293T cells. |
| Iodixanol (OptiPrep) | Used for gradient ultracentrifugation, yielding high-purity, high-titer AAV preparations suitable for in vivo use. |
| HEK293T/AAV-293 Cells | Standard cell line for high-titer AAV production via transient transfection. |
| In Vivo Sterotaxic Injection Setup | Precision apparatus for delivering AAV vectors to specific brain coordinates in rodent models. |
Visualized Workflows and Pathways
Title: AAV Biosensor Design and Delivery Workflow
Title: Cassette Design Determines Cell-Type Specific Expression
Within the broader thesis on optimizing Adeno-Associated Virus (AAV) delivery methods for neuroscience and systems biology research, genetically encoded biosensors (GEBs) represent the critical payloads that enable real-time, in vivo measurement of cellular dynamics. The selection of an appropriate biosensor class, coupled with a tailored AAV serotype, promoter, and delivery protocol, is fundamental to experimental success. This document provides application notes and detailed protocols for five key classes of biosensors, framing their use within AAV-based research paradigms.
GCaMP Calcium Sensors
Application Note: GCaMP sensors, fusions of GFP, calmodulin, and M13 peptide, are the gold standard for monitoring neuronal activity via calcium transients. Latest iterations (e.g., jGCaMP8s, XCaMPs) offer improved kinetics and signal-to-noise. AAV delivery requires careful consideration of expression level to avoid calcium buffering.
Protocol: AAV-mediated GCaMP Expression and In Vivo 2-Photon Imaging
- AAV Preparation: Utilize AAV-PHP.eB or AAV9 for robust brain-wide transduction in mice. Use a neuron-specific promoter (e.g., hSyn1, CaMKIIα). Tier viral titer to ≥ 1x10^13 gc/mL.
- Stereotaxic Injection: Anesthetize mouse and secure in stereotaxic frame. Inject 300-500 nL of AAV-GCaMP suspension into target region (e.g., primary visual cortex) at a rate of 100 nL/min.
- Window Implantation: After 2-3 weeks for expression, implant a cranial window. Perform a 5-mm craniotomy, replace bone with a glass coverslip, and secure with dental cement.
- Imaging: Under light anesthesia, image using a 2-photon microscope at 920-1000 nm excitation. Record baseline fluorescence (F0) and dynamic signals (F). Analyze ΔF/F = (F - F0)/F0.
Table 1: GCaMP Variant Characteristics
| Variant | Kinetics (τ decay, ms) | Relative Brightness | Dynamic Range (ΔF/F) | Primary Use Case |
|---|---|---|---|---|
| jGCaMP7f | ~550 | 1.0 | ~20 | Fast, frequent firing |
| jGCaMP8s | ~350 | 1.5 | ~40 | High SNR for single spikes |
| XCaMP-G | ~100 | 0.8 | ~15 | Ultra-fast presynaptic imaging |
Diagram Title: AAV-GCaMP In Vivo Imaging Workflow
iGluSnFR Glutamate Sensors
Application Note: iGluSnFR sensors are GFP-based reporters for extracellular glutamate. iGluSnFR variants (e.g., iGluSnFR3) offer nanomolar affinity. Optimal for probing synaptic release and astrocytic glutamate uptake. AAV tropism must be matched to target cell type (neurons vs. astrocytes).
Protocol: Measuring Presynaptic Glutamate Release in Slice
- AAV Transduction: Inject AAV1 (high presynaptic tropism) encoding iGluSnFR3v under the hSyn promoter into the mouse hippocampus.
- Acute Slice Preparation: After 3 weeks, prepare 300-µm acute hippocampal slices in ice-cold, sucrose-based cutting ACSF.
- Imaging Setup: Perfuse slices with oxygenated ACSF at 32°C in a perfusion chamber on an epifluorescence or confocal microscope.
- Stimulation & Recording: Place a bipolar stimulating electrode in Schaffer collaterals. Deliver a single or train of electrical pulses (100 µs, 10-100 µA). Record iGluSnFR fluorescence at 488 nm excitation.
- Analysis: Measure peak ΔF/F, rise time, and decay tau. Calibrate using known glutamate puffs.
Table 2: iGluSnFR Variant Properties
| Variant | Apparent KD (µM) | ΔF/F (%) | τ off (ms) | Localization |
|---|---|---|---|---|
| iGluSnFR3s | 2.7 | ~500 | ~70 | Synaptic (slower) |
| iGluSnFR3f | 4.3 | ~350 | ~20 | Extrasynaptic (faster) |
| SF-iGluSnFR.A184S | 0.2 | ~1000 | ~200 | High affinity, slow |
Diagram Title: iGluSnFR Glutamate Sensing Pathway
pH Sensors (pHluorin, pHRed)
Application Note: pH-sensitive GFPs (e.g., pHluorin, pHTomato) report vesicular exocytosis (synaptopHluorin) or intracellular pH compartments. pHRed is a rationetric, pH-sensitive mCherry/mOrange fusion. AAV expression should target specific organelles using signal peptides.
Protocol: Monitoring Synaptic Vesicle Exocytosis with synaptopHluorin
- AAV Delivery: Package synaptopHluorin (sypHy) in AAV-DJ for broad tropism. Inject into mouse primary visual cortex.
- Slice Imaging: Prepare acute cortical slices. Image using rapid wide-field microscopy.
- Stimulation: Apply field stimulation at 10-40 Hz for 5-10s. The alkaline synaptic cleft upon vesicle fusion increases pHluorin fluorescence.
- Quantification: Trace fluorescence at individual puncta. Calculate the rate of fluorescence increase (exocytosis) and decay (endocytosis/ re-acidification).
Redox Sensors (roGFP, Grx1-roGFP2)
Application Note: roGFP sensors are rationetric probes for glutathione redox potential (EGSH) or H2O2. Grx1-roGFP2 is specific for the glutathione redox couple. Critical for studying oxidative stress in neurodegeneration. AAV delivery allows chronic monitoring in disease models.
Protocol: Rationetric Imaging of Mitochondrial Redox State
- Targeting: Clone mito-roGFP2-Orp1 (for H2O2) or mito-Grx1-roGFP2 into an AAV vector with a mito-targeting sequence and a ubiquitous promoter (CAG).
- Transduction: Infect cultured neurons or inject AAV9 into mouse brain.
- Rationetric Imaging: Acquire two excitation images (400 nm and 485 nm) with a 525/50 nm emission filter.
- Calibration: In situ calibrate with 2mM DTT (fully reduced) and 1mM H2O2 with aldrithiol (fully oxidized). Calculate redox ratio = I400 / I485.
- Calculation: Compute the degree of oxidation = (R - Rred) / (Rox - Rred).
Table 3: Redox Sensor Characteristics
| Sensor | Target | Excitation Rationetric | Dynamic Range (Rox/Rred) | Response Time |
|---|---|---|---|---|
| roGFP2 | General Thiol | 400/490 nm | ~5-7 | Slow (min) |
| Grx1-roGFP2 | Glutathione (EGSH) | 400/490 nm | ~5 | Fast (s) |
| roGFP2-Orp1 | H2O2 | 400/490 nm | ~3-4 | Fast (s) |
Metabolic Sensors (NADH/NADPH, ATP, Lactate)
Application Note: SoNar and FiNad sensors report NAD+/NADH ratio. ATeam sensors report ATP:ADP ratio. These are vital for studying metabolic shifts in cancer, aging, and neuronal activity. AAVs enable tissue-specific expression in complex organisms.
Protocol: Imaging ATP Dynamics with ATeam in Live Cells
- AAV Transduction: Use AAV2 for in vitro neuronal culture transduction with ATeam1.03YEMK under a neuronal promoter.
- FRET Imaging: On a confocal or epifluorescence microscope equipped with a FRET filter set, excite CFP at 433 nm.
- Channel Acquisition: Simultaneously collect CFP emission (475 nm) and YFP FRET emission (527 nm).
- Stimulation: Apply metabolic challenge (e.g., 2-deoxyglucose, oligomycin) or neuronal stimulation (e.g., high K+).
- Analysis: Calculate FRET ratio (YFP/CFP). Higher ratio indicates increased ATP. Normalize to baseline.
Diagram Title: Metabolic Biosensor Operating Logic
The Scientist's Toolkit: Research Reagent Solutions
Table 4: Essential Reagents for AAV-Biosensor Research
| Item | Function & Rationale |
|---|---|
| AAV Serotype (e.g., PHP.eB, AAV9, AAV1) | Determines tropism and transduction efficiency for target cell type (neurons, astrocytes, systemic). |
| Cell-Type Specific Promoter (e.g., hSyn, GFAP, CAG) | Drives biosensor expression in defined cellular populations, reducing off-target artifacts. |
| High-Titer AAV Purification Kit | Ensures viral preps reach >10^13 gc/mL, crucial for in vivo efficacy and reducing injection volume. |
| Stereotaxic Injector & Microsyringe | Enables precise, reproducible intracranial delivery of AAV vector to deep brain structures. |
| Cranial Window Kit & Dental Cement | Allows chronic optical access to the brain for longitudinal imaging sessions post-AAV expression. |
| 2-Photon/Confocal Microscope with DAQ | High-sensitivity imaging system for detecting biosensor fluorescence changes in vivo or in vitro. |
| Artificial CSF (aCSF) & Perfusion System | Maintains physiological conditions for acute slice health during biosensor imaging experiments. |
| Calibration Reagents (DTT, H2O2, Ionophores, Glutamate) | Essential for converting biosensor fluorescence ratios into absolute physiological concentrations. |
| In Vivo Imaging Software (e.g., Suite2p, Fiji) | For motion correction, ROI extraction, and ΔF/F or rationetric calculation from raw video data. |
Within the broader thesis exploring optimized Adeno-Associated Virus (AAV) delivery methods for genetically encoded biosensors, this document details the critical biosensor properties that determine in vivo success. AAV's ~4.7 kb cargo limit imposes a stringent design constraint, while biosensor dimerization can lead to artifactual signaling, and insufficient dynamic range limits physiological relevance. These interconnected properties must be optimized in tandem for robust biosensor function following AAV-mediated gene delivery.
Table 1: Size Constraints of Common Biosensor Components & AAV Serotypes
| Component | Typical Size (bp) | Notes |
|---|---|---|
| Minimal Promoter (e.g., Synapsin, hSyn) | ~450 - 500 bp | Neuron-specific; crucial for AAV space saving. |
| Ubiquitous Promoter (e.g., CAG, CBA) | ~1.2 - 1.7 kb | Strong, broad expression; consumes significant cargo space. |
| Fluorescent Protein (e.g., GFP) | ~720 bp | Standard reporter. |
| Circularly Permuted FP (cpFP) | ~720 bp | Core of many biosensors (e.g., GCaMP). |
| Calmodulin (CaM) & M13 Peptide | ~450 bp | Calcium sensor domain. |
| Wild-Type AAV Capsid Cargo Limit | ~4700 bp | Optimal packaging efficiency. Capacity can extend to ~5.2 kb with reduced titer. |
| AAV Serotype | Tropism | Common Use in Neuroscience |
| AAV9 | Broad CNS, peripheral | Crosses BBB effectively. |
| AAV-PHP.eB | Enhanced CNS (mouse) | Selective for murine brain. |
| AAV-DJ | Broad in vitro | High transduction efficiency cell lines. |
| AAVrh.10 | Broad CNS | Used in clinical trials. |
Table 2: Dimerization Propensity of Common Fluorescent Proteins
| Fluorescent Protein | Oligomeric State | Risk of Artifactual Clustering | Common Use in Biosensors |
|---|---|---|---|
| Wild-Type GFP | Weak dimer | Moderate | Baseline, but not ideal. |
| EGFP/A206K GFP | Monomeric | Low | Standard mutation (A206K) to prevent dimerization. |
| cpEGFP | Monomeric (if derived from mEGFP) | Low | Core of GCaMP, GEVI. |
| tdTomato | Tandem dimer | Very Low | Bright, but ~1.4 kb; used as reporter. |
| mCherry | Monomeric | Low | Red fluorescent reporter. |
| Venus | Weak dimer | Moderate | Often used in FRET sensors; requires monomerizing mutations. |
| miRFP670 | Monomeric | Low | Near-infrared; for deep-tissue imaging. |
Table 3: Dynamic Range of Exemplar Biosensors
| Biosensor | Sensing Target | Dynamic Range (ΔF/F0 or ΔR/R0) | Key Limiting Factor |
|---|---|---|---|
| GCaMP6f | Ca²⁺ | ~200% in vivo | Affinity (Kd), kinetics, brightness. |
| jRGECO1a | Ca²⁺ | ~600% in vitro | Maturation, pH sensitivity. |
| GRABDA2h | Dopamine | ~90% in vivo | Receptor domain selectivity, membrane trafficking. |
| iGluSnFR | Glutamate | ~400% in vitro | Affinity (Kd), slow-off kinetics can limit temporal resolution. |
| AT1.03 | cAMP | ~400% ΔR/R0 (FRET) | FRET efficiency, expression level. |
| ArcLight | Voltage | ~35% ΔF/F0 per 100 mV | Kinetics, sensitivity to subthreshold potentials. |
Experimental Protocols
Protocol 1: Assessing Biosensor Size Compatibility with AAV Packaging
Objective: Determine if a biosensor expression cassette fits within the AAV cargo limit without compromising titer. Materials: Plasmid DNA of biosensor construct, restriction enzymes, agarose gel equipment, qPCR system, ITR-flanked AAV vector plasmid, pHelper and Rep/Cap plasmids, HEK293T cells, iodixanol gradient solutions. Procedure:
- Linearize & Measure: Digest the final biosensor plasmid (containing AAV2 ITRs, promoter, biosensor, and polyA) with a single-cut restriction enzyme outside the ITRs. Run on a high-resolution agarose gel alongside a DNA ladder to precisely measure the total size of the ITR-flanked cassette.
- Package AAV: If size ≤5.2 kb, proceed with triple transfection in HEK293T cells.
- Day 1: Seed HEK293T cells in 10 cm dishes.
- Day 2: Transfect using PEI with: i) ITR-biosensor plasmid, ii) pHelper plasmid, iii) Rep/Cap plasmid for desired serotype (e.g., AAV9).
- Harvest & Purify: 72h post-transfection, harvest cells and medium. Lyse cells via freeze-thaw, treat with Benzonase, and purify via iodixanol density gradient ultracentrifugation.
- Titer & Compare: Determine genomic titer (vg/mL) via qPCR using ITR-specific primers. Compare the titer to a control AAV expressing a small cargo (e.g., GFP only). A ≥10-fold reduction in titer suggests packaging inefficiency due to oversized cargo.
Protocol 2: Testing for Dimerization-Induced Artifacts via FRAP
Objective: Evaluate if a membrane-targeted biosensor exhibits anomalous clustering due to dimerization. Materials: Cells (e.g., HEK293, primary neurons), AAV or plasmid encoding the biosensor, confocal microscope with FRAP module, imaging chamber. Procedure:
- Express Biosensor: Transduce/transfect cells with the biosensor (e.g., a membrane-targeted GFP-based sensor).
- FRAP Imaging:
- Select a region of interest (ROI) on the plasma membrane and a control background ROI.
- Acquire 5 pre-bleach images at low laser power.
- Bleach the membrane ROI with a high-intensity 488 nm laser pulse.
- Acquire post-bleach recovery images every 0.5-1 second for 1-2 minutes.
- Analysis:
- Normalize fluorescence intensity in the bleached ROI to the background and pre-bleach levels.
- Plot recovery curve over time. A monomeric, freely diffusing sensor will show rapid, complete recovery. Incomplete recovery (<80%) suggests a significant immobile fraction, potentially due to dimerization/oligomerization-induced trapping or aggregation.
Protocol 3: Quantifying Dynamic RangeIn Vitro
Objective: Measure the maximal fluorescence response (ΔF/F0) of a biosensor to a saturating concentration of its ligand. Materials: Cultured cells expressing the biosensor, imaging system (epifluorescence/confocal), ligand stock solution, perfusion system, data analysis software (e.g., ImageJ, Python). Procedure:
- Calibrate Imaging: Plate cells expressing the biosensor on glass-bottom dishes. Establish stable imaging conditions (e.g., 488nm ex, 510-550nm em for GFP).
- Acquire Baseline (F0): Record fluorescence for 30-60 seconds in ligand-free buffer.
- Apply Saturating Ligand: Perfuse with a saturating concentration of ligand (e.g., 100 μM ATP for P2Y receptor-based sensors; 80 mM KCl for calcium sensors).
- Record Response: Continue imaging until fluorescence plateaus (F_max).
- Calculate Dynamic Range: For intensity-based sensors: ΔF/F0 = (Fmax - F0) / F0. For ratiometric/FRET sensors: ΔR/R0 = (Rmax - R0) / R0.
- Repeat across multiple cells (n>20) to obtain mean and standard deviation.
Visualizations
Title: AAV Cargo Size Constraint Workflow
Title: Biosensor Dimerization Risk Pathway
Title: Factors Determining Biosensor Dynamic Range
The Scientist's Toolkit: Research Reagent Solutions
Table 4: Essential Reagents for AAV Biosensor Development & Testing
| Reagent/Material | Supplier Examples | Function in Context |
|---|---|---|
| AAV Helper-Free System (pAAV, pHelper, Rep/Cap) | Addgene, Vector Biolabs, Cell Biolabs | Provides all necessary components for AAV production in trans; Rep/Cap defines serotype. |
| ITR-flanked Cloning Vector (e.g., pAAV) | Addgene, Agilent | Plasmid backbone containing AAV2 inverted terminal repeats (ITRs) essential for genome packaging. |
| Monomeric FP Variants (mEGFP, mCherry) | Addgene (from labs), FP databases | Core scaffold for biosensor engineering; monomeric mutants prevent dimerization artifacts. |
| Neuronal Promoter Plasmids (hSyn, CaMKIIα) | Addgene | Compact, cell-type specific promoters to save cargo space and target expression. |
| HEK293T Cells | ATCC, ECACC | Standard cell line for high-titer AAV production via triple transfection. |
| Iodixanol (OptiPrep) | Sigma-Aldrich, Axis-Shield | Medium for density gradient ultracentrifugation, enabling high-purity AAV purification. |
| Benzonase Nuclease | Sigma-Aldrich, Millipore | Degrades unpackaged nucleic acids during AAV purification, reducing contaminants. |
| AAV Titration ELISA/qPCR Kits | Progen, Thermo Fisher | Quantifies physical (capsid) or genomic (vector) titer of purified AAV prep. |
| Primary Neuronal Culture Systems | BrainBits, ScienCell | Physiologically relevant in vitro system for testing biosensor function and AAV transduction. |
| FRAP-Compatible Confocal Microscope | Leica, Zeiss, Nikon | Equipment for performing Fluorescence Recovery After Photobleaching to assess diffusion/clustering. |
From Theory to Bench: A Step-by-Step Protocol for AAV Biosensor Production and In Vivo Delivery
Within the broader thesis investigating optimal AAV delivery methods for genetically encoded biosensors in neuroscience and cellular physiology research, the production pipeline is a critical determinant of experimental success. High-purity, high-titer AAV vectors encoding biosensors (e.g., GCamp, iGluSnFR) are essential for achieving specific, sensitive, and reproducible sensor expression with minimal cellular toxicity. This application note details a robust pipeline from packaging to titer analysis, comparing the two predominant purification methodologies: Iodixanol Gradient Ultracentrifugation and Size-Exclusion Chromatography (SEC).
AAV Biosensor Packaging & Crude Lysate Preparation
Protocol: Triple-Transfection in HEK293T/293 Cells
Objective: Package AAV vectors containing the genetically encoded biosensor transgene.
Materials:
- HEK293T/293 Cells: High-transfection efficiency, adherent variant.
- Rep/Cap Plasmid: Serotype-defining (e.g., AAV1, AAV2, AAV5, AAV9, PHP.eB).
- Helper Plasmid: Provides adenoviral helper functions (E4, E2a, VA RNA).
- ITR-flanked Biosensor Plasmid: Contains biosensor transgene (e.g., GCamp6f, jRGECO1a) driven by desired promoter (hSyn, CAG).
- Transfection Reagent: PEI MAX or similar.
- Opti-MEM or serum-free medium.
Methodology:
- Seed HEK293T cells at ~70% confluency in cell factories or multilayer flasks.
- At time of transfection, ensure cell viability >95%.
- For a 10-layer cell factory, prepare a plasmid mix in Opti-MEM: ITR-Biosensor plasmid (1.25 mg), Rep/Cap plasmid (1.25 mg), Helper plasmid (2.5 mg). Total DNA = 5 mg.
- Add PEI MAX at a 3:1 ratio (PEI:DNA, w/w). Incubate 15-20 min.
- Add complex dropwise to cells in serum-containing medium.
- Incubate for 60-72 hours at 37°C, 5% CO₂.
- Harvest cells and media. Pellet cells via centrifugation (2000 x g, 15 min). Retain both cell pellet and supernatant.
- Resuspend cell pellet in lysis buffer (150 mM NaCl, 50 mM Tris-HCl, pH 8.5). Perform 3-5 freeze-thaw cycles (liquid N₂/37°C) or use detergent lysis.
- Treat combined cell lysate and supernatant with Benzonase (50 U/mL, 37°C, 1 hour) to digest unpackaged nucleic acids.
- Clarify lysate by centrifugation (4000 x g, 30 min). Filter through a 0.8/0.45 µm PES filter. This is the Crude Lysate.
Purification: Iodixanol Gradient Ultracentrifugation vs. SEC
Protocol A: Iodixanol Gradient Ultracentrifugation
Objective: Purify AAV particles based on buoyant density (~1.22 g/mL in iodixanol).
Materials:
- OptiPrep (60% Iodixanol solution)
- Gradient Buffer: PBS-MK (1 mM MgCl₂, 2.5 mM KCl)
- Ultracentrifuge, Fixed-Angle Rotor (e.g., Type 70 Ti)
- Quick-Seal polypropylene tubes
Methodology:
- Prepare iodixanol step gradients in Quick-Seal tubes from bottom to top:
- 3 mL 54% Iodixanol (in PBS-MK)
- 4 mL 40% Iodixanol (in PBS-MK)
- 4 mL 25% Iodixanol (in PBS-MK)
- 5 mL 15% Iodixanol (in PBS-MK)
- Carefully layer up to 12 mL of clarified, Benzonase-treated lysate on top of the gradient.
- Seal tubes and centrifuge at 350,000 x g (avg), 18°C for 2 hours.
- Puncture tube side just below the 40-54% interface (visible opaque band). Collect ~2-3 mL containing AAV.
- Desalt/concentrate using 100K MWCO Amicon Ultra centrifugal filters into final formulation buffer (e.g., DPBS).
Protocol B: Size-Exclusion Chromatography (SEC)
Objective: Purify AAV particles based on hydrodynamic radius, removing empty capsids and contaminants.
Materials:
- ÄKTA pure or FPLC system
- SEC Column: Superose 6 Increase 10/300 or similar
- SEC Buffer: DPBS + 0.001% Pluronic F-68
- 0.22 µm syringe filter
Methodology:
- Concentrate and buffer-exchange the clarified lysate into SEC buffer using tangential flow filtration (TFF) or centrifugal concentrators to a volume ≤500 µL.
- Filter sample through a 0.22 µm filter.
- Equilibrate SEC column with ≥1.5 column volumes (CV) of SEC buffer at 0.5 mL/min.
- Inject sample (≤2% of CV). Run isocratic elution at 0.5 mL/min, collecting 0.5 mL fractions.
- Monitor UV 260 nm (nucleic acid) and 280 nm (protein) absorbance. The primary AAV peak (full capsids) elutes first, followed by empty capsids.
- Pool fractions corresponding to the full AAV peak. Concentrate if necessary.
Titer Determination: Key Metrics & Comparative Analysis
Titer analysis is critical for dosing in biosensor experiments. The chosen purification method impacts the full/empty capsid ratio, affecting functional titer.
Table 1: Comparison of Iodixanol vs. SEC Purification for AAV Biosensor Vectors
| Parameter | Iodixanol Gradient Ultracentrifugation | Size-Exclusion Chromatography (SEC) |
|---|---|---|
| Primary Separation Principle | Buoyant Density | Hydrodynamic Radius |
| Speed | ~4-6 hours (post-lysate) | ~2-3 hours (post-concentrated lysate) |
| Scalability | Moderate (batch process) | High (easily scalable) |
| Full/Empty Capsid Resolution | Poor. Co-purifies empty capsids. | Excellent. Resolves full (>90%) from empty capsids. |
| Recovery Yield | 50-70% | 60-80% |
| Chemical Residue | Requires iodixanol removal | Buffer-only, no chemical contaminants |
| General Capsid Purity | Moderate-High (removes most proteins/nucleic acids) | Very High (removes host proteins, empty capsids, aggregates) |
| Recommended Titer Assay | ddPCR (genome titer); ELISA (capsid titer) | ddPCR + AUC or TEM (for full/empty ratio) |
| Suitability for In Vivo Biosensor Delivery | Good, but empty capsids may cause immune reactions. | Excellent. High purity reduces off-target effects and immunogenicity. |
Table 2: Standard Titer Determination Methods
| Method | Target | Principle | Typical Output for Biosensor AAV Preps |
|---|---|---|---|
| Digital Droplet PCR (ddPCR) | Genome Titer (VG/mL) | Absolute quantification of ITR-flanked genome | 1e12 - 1e14 VG/mL (post-concentration) |
| ELISA | Capsid Titer (CP/mL) | Immunoassay for intact capsids | 1e12 - 1e14 CP/mL |
| SDS-PAGE/Coomassie | Protein Purity | Visual assessment of VP1/2/3 ratio & contaminants | VP1:VP2:VP3 ~5:5:90 ratio |
| Analytical Ultracentrifugation (AUC) | Full/Empty Ratio | Sedimentation velocity differentiation | SEC Prep: >90% full; Iodixanol: 30-70% full |
| Transmission EM (TEM) | Morphology & Full/Empty | Direct visualization | Qualitative confirmation of SEC separation |
Protocol: ddPCR for Genome Titer (Critical for Biosensor Dosing)
Objective: Precisely quantify packaged, intact biosensor genomes.
Materials:
- ddPCR Supermix for Probes (no dUTP)
- ITR-specific or biosensor transgene-specific primer/probe set
- Droplet generator & reader
- QX200 or similar system
Methodology:
- Treat purified AAV sample with DNase I (to remove un-packaged DNA).
- Inactivate DNase (EDTA, 65°C), then digest capsids with Proteinase K.
- Heat-inactivate Proteinase K. Serially dilute sample (e.g., 1e-4 to 1e-6).
- Prepare 20 µL ddPCR reaction: Supermix, primers/probe, template (2 µL of dilution).
- Generate droplets (~20,000/ sample) using droplet generator.
- Perform PCR: 95°C (10 min), 40 cycles of 94°C (30s) & 58-60°C (1 min), 98°C (10 min).
- Read droplets. Set threshold to distinguish positive (fluorescent) from negative droplets.
- Calculate titer: [Titer (VG/mL) = (Concentration from software (copies/µL) * Dilution Factor) / Volume of template in µL] * 1000.
The Scientist's Toolkit: Research Reagent Solutions
Table 3: Essential Materials for AAV Biosensor Production Pipeline
| Item | Function & Rationale |
|---|---|
| PEI MAX 40K | High-efficiency, low-cost transfection polymer for large-scale plasmid delivery in HEK293 cells. |
| OptiPrep (Iodixanol) | Iso-osmotic, inert density gradient medium for buoyant density purification of AAV particles. |
| Superose 6 Increase 10/300 GL | High-resolution SEC column for resolving full AAV capsids from empty capsids and aggregates. |
| Benzonase Nuclease | Digests host cell and unpackaged plasmid DNA/RNA, reducing viscosity and increasing purity. |
| Pluronic F-68 | Non-ionic surfactant added to formulation buffers to prevent AAV aggregation and adhesion. |
| ddPCR ITR-specific Assay | Provides absolute quantification of packaged genomes without standard curves; resistant to enzyme inhibitors. |
| AAV Capsid ELISA Kit (Serotype-specific) | Quantifies total intact physical capsids, essential for determining full/empty ratios. |
| Amicon Ultra-15 (100K MWCO) | Centrifugal concentrator for rapid buffer exchange and volume reduction post-purification. |
| DNase I (RNase-free) | Critical for ddPCR sample prep to ensure only packaged, DNase-resistant genomes are quantified. |
| Proteinase K | Digests the AAV protein capsid to release the packaged genome for downstream ddPCR analysis. |
Visualizations
Iodixanol Gradient Purification Workflow
SEC vs Iodixanol: Capsid Purity & Resolution
AAV Biosensor Pipeline in Thesis Context
Within the broader thesis on optimizing Adeno-Associated Virus (AAV) delivery for genetically encoded biosensor research, selecting the appropriate in vivo administration route is paramount. The choice determines biosensor expression specificity, signal-to-noise ratio, and experimental outcome. This application note details three core methodologies: stereotaxic intracranial injection for precise targeting, intravenous systemic delivery for broad distribution, and ancillary local administration techniques. Each method presents a unique trade-off between invasiveness, biosensor expression field, and translational relevance.
Table 1: Quantitative Comparison of AAV Delivery Methods for Biosensor Research
| Parameter | Stereotaxic Intracranial Injection | Intravenous Systemic Delivery | Local Administration (e.g., Topical, Intramuscular) |
|---|---|---|---|
| Primary Target | Specific brain regions (e.g., hippocampus, cortex) | Whole body; crosses blood-brain barrier (BBB) with specific serotypes | Peripheral organs, skin, muscles, eyes |
| Invasiveness | High (craniotomy required) | Low (tail vein, retro-orbital) | Variable (low to moderate) |
| Typical Injection Volume | 50 nL - 2 µL | 50 - 200 µL (in mice) | 5 - 50 µL |
| AAV Dose (vg) | 1e8 - 1e10 vg/site | 1e11 - 1e13 vg total | 1e9 - 1e11 vg/site |
| Time to Peak Expression | 2-4 weeks | 3-6 weeks | 1-4 weeks |
| Key Advantage | High local concentration; minimal off-target expression in CNS | Broad, non-invasive access; suitable for whole-brain or body imaging | Organ-specific; often minimally invasive |
| Major Limitation | Invasive; limited coverage | Potential peripheral toxicity; requires BBB-crossing serotype (e.g., AAV-PHP.eB, AAV9) | Limited to accessible organs; not for deep brain |
Table 2: Recommended AAV Serotypes for Biosensor Delivery by Route
| Delivery Method | Preferred AAV Serotypes | Rationale |
|---|---|---|
| Stereotaxic Intracranial | AAV1, AAV2, AAV5, AAV8, AAV9 | Efficient neuronal transduction; varying tropism for specific cell types (e.g., neurons, astrocytes). |
| Intravenous Systemic | AAV-PHP.eB, AAV9, AAVrh.10 | Enhanced CNS tropism and BBB crossing in rodents (PHP.eB) or broad tissue tropism. |
| Local Administration | AAV2, AAV8, AAV9, Anc80L65 | Depends on target tissue (e.g., AAV8 for liver, AAV2 for retina). |
Experimental Protocols
Protocol 1: Stereotaxic Intracranial Injection of AAV Biosensors
Objective: To deliver AAV encoding a genetically encoded biosensor (e.g., jGCaMP8 for calcium) into a specific mouse brain region (e.g., primary visual cortex, V1).
Materials & Reagents: See The Scientist's Toolkit below. Procedure:
- Anesthesia & Setup: Anesthetize the mouse (e.g., using 1-2% isoflurane) and secure it in a stereotaxic frame. Apply ophthalmic ointment. Shave and aseptically prepare the scalp.
- Craniotomy: Make a midline scalp incision. Using stereotaxic coordinates (e.g., from Paxinos & Franklin atlas for V1: AP: -3.5 mm, ML: ±2.5 mm from Bregma), mark the injection site. Perform a small craniotomy (~0.5 mm diameter) with a dental drill.
- Virus Loading: Thaw AAV on ice. Back-fill a clean glass micropipette or a 33-gauge Hamilton syringe with mineral oil. Front-fill with ~2 µL of AAV suspension (titer: ~5x10^12 vg/mL). Ensure no air bubbles.
- Injection: Lower the needle slowly to the target depth (DV: -0.5 mm from dura). Wait 2 minutes for tissue settlement. Inject 500 nL of virus at a rate of 100 nL/min using a microinjection pump.
- Post-injection: Leave the needle in place for 10 minutes post-injection to prevent backflow. Slowly retract the needle. Suture the scalp and administer analgesia (e.g., carprofen). Monitor animal until fully recovered.
- Expression & Imaging: Allow 3-4 weeks for optimal biosensor expression. Perform in vivo two-photon imaging through a cranial window implanted separately.
Protocol 2: Intravenous Systemic Delivery via Tail Vein Injection
Objective: To achieve widespread expression of a biosensor (e.g., a glutamate sensor iGluSnFR) across the brain and/or body.
Procedure:
- Virus Preparation: Thaw high-titer AAV stock (e.g., AAV-PHP.eB, >1e13 vg/mL) on ice. Dilute if necessary in sterile PBS to a final volume of 100 µL for a mouse.
- Animal Preparation: Place mouse in a restrainer with tail exposed. Gently warm the tail with a heat lamp or warm water to dilate the veins.
- Injection: Wipe tail with alcohol. Using a 29-30 gauge insulin syringe, insert the needle parallel to and into a lateral tail vein. Inject 100 µL of AAV solution steadily over ~30 seconds. A successful injection shows no blanching or resistance.
- Post-injection: Apply gentle pressure to the site for hemostasis. Return animal to cage and monitor.
- Expression & Validation: Allow 5-6 weeks for robust expression. Confirm expression via ex vivo histology or in vivo widefield imaging. Note: Systemic delivery often requires higher doses, raising cost and potential immune response concerns.
Protocol 3: Local Administration: Intramuscular Injection for Peripheral Biosensing
Objective: To express a biosensor (e.g., a pH sensor) specifically within skeletal muscle tissue.
Procedure:
- Targeting: Anesthetize the mouse. Shave and clean the hindlimb area to expose the tibialis anterior (TA) muscle.
- Injection: Using a 31-gauge insulin syringe, inject 20 µL of AAV (e.g., AAV6 or AAV9, ~1e12 vg/mL) directly into the belly of the TA muscle. Avoid major blood vessels.
- Recovery: Allow animal to recover. Biosensor expression can typically be assessed via in vivo microscopy or explanted tissue imaging after 2-3 weeks.
Visualization of Workflows and Considerations
Flow: Choosing an In Vivo Delivery Method
Path: Systemic Delivery from Injection to Expression
The Scientist's Toolkit
Table 3: Essential Research Reagent Solutions for AAV Biosensor Delivery
| Item | Function & Relevance | Example Product/Catalog |
|---|---|---|
| High-Titer AAV Prep | Purified virus carrying the biosensor gene. Quality (titer, purity) is critical for efficiency and reproducibility. | Self-produced via PEI transfection & iodixanol gradient or commercial source (Addgene, Virovek). |
| Stereotaxic Frame | Provides millimeter-precision 3D stabilization for targeting specific brain coordinates in rodents. | David Kopf Instruments Model 940, RWD Life Science. |
| Microinjection Pump | Ensures ultra-slow, precise, and consistent volume delivery during intracranial injections to minimize tissue damage. | World Precision Instruments UltraMicroPump, Nanoject III. |
| Glass Micropipettes | Fine, beveled tips for precise intracranial virus delivery with minimal tissue trauma. | Drummond Scientific Wiretrol II, Sutter Instrument borosilicate glass. |
| Isoflurane Anesthesia System | Safe and controllable inhalation anesthesia for prolonged surgical procedures (stereotaxy). | VetEquip or Parkland Scientific systems. |
| Serotype-Specific Antibodies | For validating AAV tropism and biosensor expression patterns via immunohistochemistry. | Anti-AAV VP1/2/3 (Progen), anti-GFP (for GFP-based biosensors). |
| In Vivo Imaging Setup | To read out biosensor signals post-delivery (e.g., two-photon, fiber photometry, widefield). | Two-photon microscope (e.g., Bruker, Scientifica), fiber photometry system (Doric, Neurophotometrics). |
| PBS (sterile, pH 7.4) | Standard diluent for AAV stocks prior to injection to maintain stability and isotonicity. | Thermo Fisher Scientific 10010023. |
| Analgesics/Antibiotics | Post-operative care to minimize pain and prevent infection, ensuring animal welfare and data quality. | Carprofen (analgesic), Baytril (antibiotic). |
Within the broader thesis on AAV delivery methods for genetically encoded biosensors, optimizing the injected dose and volume is paramount. The central challenge is achieving sufficient biosensor expression for robust signal detection while minimizing cellular toxicity, immune responses, and uncontrolled spread beyond the target region. This application note provides a consolidated framework and protocols for determining this critical balance, leveraging current best practices and data.
Table 1: Representative AAV Dosage Guidelines for Common CNS Targets (Biosensor Expression)
| Target Region | Serotype (Example) | Typical Titer (vg/mL) | Injection Volume (µL) | Total Dose Range (vg) | Key Considerations for Biosensors |
|---|---|---|---|---|---|
| Mouse Cortex (layer 2/3) | AAV9, AAV1, PHP.eB | 1e12 - 5e12 | 0.5 - 1.0 | 5e11 - 5e12 | High expression needed for imaging; volume critical for laminar specificity. |
| Mouse Striatum | AAV5, AAVdj | 5e12 - 1e13 | 0.5 - 1.0 | 2.5e12 - 1e13 | Avoid ventricular leakage; moderate volumes for confined expression. |
| Mouse Hippocampus (CA1) | AAV9, AAV1 | 1e12 - 2e12 | 0.2 - 0.5 | 2e11 - 1e12 | Small volumes essential for structure integrity; lower doses often sufficient. |
| Rat Cortex | AAV9, AAVrg | 1e12 - 5e12 | 1.0 - 3.0 | 1e12 - 1.5e13 | Scale volume/dose proportionally to brain size; monitor inflammation. |
| Non-Human Primate Cortex | AAV1, AAVrh10 | 1e12 - 1e13 | 20 - 100 µL per site | 2e13 - 1e15 | Multi-site injections required; total dose is primary toxicity driver. |
Table 2: Effects of Over- and Under-Dosing AAV Biosensors
| Parameter | Under-Dosing Consequences | Over-Dosing Consequences |
|---|---|---|
| Expression Level | Insufficient signal-to-noise ratio for detection. | Saturation, potential aggregation, aberrant cellular localization. |
| Cellular Toxicity | Minimal. | ER stress, proteostatic burden, apoptotic signaling activation. |
| Immune Response | Minimal. | Capsid-driven and transgene-driven adaptive immune activation. |
| Spread & Specificity | Confined to injection site, but may not cover ROI. | Leakage into CSF, axonal transport to non-target areas, loss of cellular specificity. |
| Functional Readout | False negatives, unreliable kinetics. | Artifactual signals (e.g., calcium buffering), impaired physiology. |
Experimental Protocols
Protocol 1: Tiered Dosage Pilot Study for a New Biosensor
Objective: Establish the minimum effective dose and maximum tolerable dose for a novel genetically encoded biosensor in a target tissue.
- AAV Preparation: Aliquot the same AAV biosensor prep (e.g., AAV9-hSyn-jGCaMP8s) at a high titer (≥1e13 vg/mL). Perform serial dilutions in sterile PBS + 0.001% Pluronic F-68 to generate 4-5 dosing solutions spanning 1-log (e.g., 1e11, 5e11, 1e12, 5e12 vg/mL).
- Stereotaxic Injection: Use a target cohort of animals (n=4-6 per dose group). Under aseptic surgery, inject each dose at a fixed volume (e.g., 0.5 µL for mouse cortex) using a calibrated microsyringe pump (rate: 50 nL/min). Allow the needle to sit for 5-10 min post-injection before withdrawal.
- Expression & Health Monitoring:
- Days 3-7: Monitor animals for acute distress.
- Weeks 2-4: Peak expression window. Perform in vivo imaging or terminal histology.
- Assessment: Quantify (a) % of target cells expressing, (b) biosensor fluorescence intensity (AU), (c) signs of gliosis (Iba1, GFAP staining), and (d) any behavioral deficits.
- Analysis: Plot expression level and toxicity markers against total delivered dose (vg). Identify the optimal window.
Protocol 2: Volume-Spread Relationship Mapping
Objective: Determine the injection volume that maximizes coverage of the target structure while minimizing extra-target spread.
- Tracer Co-Injection: Prepare AAV biosensor with a fixed, mid-range titer (e.g., 1e12 vg/mL). Spike it with a fixed concentration of an inert fluorescent tracer (e.g., 0.1% Alexa Fluor 594 hydrazide).
- Variable Volume Injection: In cohorts of animals, inject the identical viral+tracer mixture at different volumes (e.g., 0.2, 0.5, 1.0, 1.5 µL) into the same stereotaxic coordinates. Maintain identical infusion rate.
- Tissue Processing & Imaging: Euthanize animals 48-72 hours post-injection (before extensive axonal transport). Perfuse-fix, section brain, and image using a slide scanner or confocal microscope.
- Quantitative Analysis: For each section, measure (a) Core Injection Zone (high tracer density), (b) Viral Spread Zone (biosensor signal beyond tracer), and (c) Leakage into ventricles or white matter tracts. Correlate zones with injection volume.
Protocol 3: Assessing Functional Toxicity via Electrophysiology
Objective: Evaluate if optimal imaging doses compromise neuronal health and function.
- Slice Preparation: 3-4 weeks post-injection of optimal biosensor dose (from Protocol 1), prepare acute brain slices from injected animals and wild-type controls.
- Electrophysiological Recordings: Perform whole-cell patch-clamp recordings from fluorescent (biosensor-expressing) and neighboring non-fluorescent neurons.
- Key Metrics: Measure resting membrane potential, input resistance, action potential firing threshold and frequency, and synaptic activity (mEPSCs/mIPSCs).
- Outcome: Compare metrics between biosensor+, biosensor-, and control neurons. Significant deviations indicate functional toxicity at the cellular level.
Visualizations
Title: AAV Biosensor Dose & Volume Optimization Workflow
Title: Dose-Dependent Outcomes in AAV Biosensor Delivery
The Scientist's Toolkit: Research Reagent Solutions
Table 3: Essential Materials for AAV Dosage Optimization Studies
| Item | Function in Optimization | Example Product/Catalog |
|---|---|---|
| High-Titer AAV Prep | Provides stock for precise dilution series to test dose-response. | Custom production (e.g., Addgene, Vigene), titer ≥1e13 vg/mL. |
| Pluronic F-68 | Surfactant added to viral aliquots to reduce adhesion to tubes/pipettes, ensuring accurate dosing. | Sigma-Aldrich P1300. |
| Fluorescent Tracer Dye | Inert co-injection marker to visually define the physical spread of the injectate. | Thermo Fisher A10438 (Alexa Fluor 594 hydrazide). |
| Microsyringe Pump | Provides ultra-precise, computer-controlled infusion of variable volumes at slow, consistent rates. | World Precision Instruments UMP3 with Micro4 controller. |
| Hamilton Syringe | Glass, gas-tight syringes for accurate loading and injection of small volumes. | Hamilton 7000 Series, 10 µL. |
| Iba1 & GFAP Antibodies | Key immunohistochemistry markers to assess microglial and astrocytic activation (toxicity/immune response). | Fujifilm Wako 019-19741 (Iba1), Agilent Z0334 (GFAP). |
| Patch-Clamp Rig | For functional toxicity assessment (Protocol 3) of neuronal health post-biosensor expression. | Setup with amplifier (e.g., Multiclamp 700B), micromanipulator, and imaging. |
Within the broader thesis exploring Adeno-Associated Virus (AAV) delivery methods for genetically encoded biosensors, a critical and often variable determinant of experimental success is the post-injection incubation period. This protocol details the application notes for determining the optimal time window for robust, stable, and functional biosensor expression in vivo, prior to experimental interrogation (e.g., imaging, electrophysiology, behavioral assays). Premature readout can lead to false negatives due to low expression, while excessively long incubation risks promoter silencing, cytotoxicity, or immune response, confounding data interpretation.
Table 1: Representative Incubation Times for Common AAV-Biosensor Preparations In Vivo
| Biosensor Class | Target (Example) | AAV Serotype | Tissue | Time to Initial Detection | Time to Robust Expression (Recommended Min.) | Reported Peak & Stable Window | Key Citations (Examples) |
|---|---|---|---|---|---|---|---|
| GCaMP (Ca²⁺) | Neurons (CamKIIα) | AAV9, AAV-PHP.eB | Mouse Cortex | 3-5 days | 14 days | 3-6 weeks | Dana et al., 2019 |
| jRGECO1a (Ca²⁺) | Neurons (Syn1) | AAV1 | Mouse Visual Cortex | 5-7 days | 21 days | 4-8 weeks | Inoue et al., 2021 |
| GRAB (Neurotransmitter) | DA (GRAB_DA2m) | AAV9 | Mouse Striatum | 7-10 days | 21 days | 4-10 weeks | Sun et al., 2020 |
| iGluSnFR (Glutamate) | Astrocytes (GFAP) | AAV5 | Mouse Cortex | 10-14 days | 28 days | 5-12 weeks | Marvin et al., 2018 |
| Archon (Voltage) | Cortical Neurons | AAV1 | Mouse Cortex | 10-14 days | 28 days | 6-12 weeks | Piatkevich et al., 2019 |
Table 2: Factors Influencing Optimal Incubation Time
| Factor | Impact on Expression Kinetics | Protocol Adjustment Consideration |
|---|---|---|
| AAV Serotype | Alters cellular tropism & transduction efficiency. | Slower tropism (e.g., some native AAVs) may require +1-2 weeks vs. engineered capsids (e.g., PHP.eB). |
| Promoter Strength/Specificity | Strong ubiquitous (CAG) > cell-specific (Syn1, GFAP). | Strong promoters yield earlier detection; cell-specific may be slower but cleaner. |
| Titer & Injection Volume | Higher titer can accelerate saturation but risks inflammation. | Standardize titer (e.g., 1e12 - 1e13 vg/mL); pilot dose-response for new sensor. |
| Target Tissue & Route | Slow diffusion in dense tissue (e.g., striatum) vs. CSF-assisted spread (ICV). | Intraparenchymal injections require local diffusion time; systemic/ICV require longer whole-body distribution. |
| Biosensor Size/Complexity | Multi-subunit or large constructs may express/assemble slower. | Add 1-2 weeks for complex indicators (e.g., dimeric voltage sensors). |
| Animal Model/Age | Mature CNS has slower expression dynamics than neonatal. | Neonatal injections allow for longer incubation (weeks-months); adult models follow standard windows. |
Experimental Protocols
Protocol 1: Longitudinal Characterization of Biosensor Expression Timeline Objective: To empirically determine the optimal incubation window for a novel AAV-biosensor construct in your model system. Materials: See "The Scientist's Toolkit" below. Procedure:
- Cohort Design: Inject a standardized AAV-biosensor preparation (e.g., AAV9-Syn1-jRGECO1a) into a cohort of animals (n≥3 per time point).
- Time Points: Sacrifice subgroups at post-injection days: 3, 7, 14, 21, 28, 42, and 56.
- Tissue Processing: Perfuse-fix with 4% PFA. Collect and section target tissue (e.g., 50 µm coronal sections).
- Immunohistochemistry (IHC): Perform IHC using an anti-GFP primary antibody (biosensor is GFP-based) and a suitable fluorescent secondary. Counterstain with DAPI.
- Image Acquisition & Analysis: Acquire high-resolution, consistent images across all samples.
- Quantification: Measure (a) Transduction Volume: Area/volume of fluorescence above background threshold. (b) Expression Intensity: Mean fluorescence intensity within transduced cells/region. (c) Cellular Specificity: Co-localization with cell-type markers (e.g., NeuN for neurons).
- Functional Validation (Live Preparation): For a parallel cohort, perform in vivo or ex vivo imaging (e.g., 2-photon) at matched time points during relevant stimulation to confirm biosensor functionality, not just presence.
Protocol 2: Assessing Experimental Readiness via Pilot Functional Imaging Objective: To confirm biosensor is functionally mature and system is ready for definitive experiments. Materials: As per Protocol 1, plus live imaging setup. Procedure:
- Incubation: Allow the primary experimental cohort to incubate for the predetermined minimum robust expression time (e.g., 21 days).
- Pilot Surgery/Preparation: Perform any required cranial window implantation or preparation for live imaging 5-7 days before the planned experiment.
- Baseline Imaging Session: Conduct a short, non-survival imaging session in a subset of animals (n=2-3).
- Acquire baseline biosensor fluorescence.
- Apply a defined, moderate physiological stimulus (e.g., visual stimulus for V1, gentle air puff for somatosensory cortex).
- Readiness Criteria: The system is deemed ready if:
- Signal-to-Noise Ratio (SNR): ΔF/F0 > 10% for calcium sensors under stimulus.
- Responsive Fraction: >30% of transduced cells show stimulus-locked activity.
- Photostability: No significant bleaching (>50% signal loss) during a typical planned acquisition period.
- Proceed or Wait: If criteria are unmet, allow additional 1-week incubation and re-test.
Visualization Diagrams
Title: AAV Biosensor Expression Timeline Progression
Title: Workflow for Determining Optimal Incubation Time
The Scientist's Toolkit: Research Reagent Solutions
Table 3: Essential Materials for Incubation Time Studies
| Item | Function & Rationale | Example Product/Catalog |
|---|---|---|
| High-Titer, QC'd AAV Prep | Consistent viral particle number is paramount for reproducible expression kinetics. Use aliquots from same prep for timeline study. | Custom production from core facility (e.g., Virovek, Addgene AAV Service); titer ≥ 1e13 vg/mL. |
| Cell-Type Specific Promoter Plasmid | Drives expression in target cells; critical for biosensor relevance and signal-to-noise. | pAAV-Syn1 (neurons), pAAV-GFAP (astrocytes), pAAV-CAG (ubiquitous strong). |
| Stereotaxic Injector & Micropump | Precise, reproducible delivery to target brain region. | Nanoject III (Drummond), UltraMicroPump (World Precision Instruments). |
| Anti-GFP Antibody (Chicken or Rabbit) | For IHC detection of GFP-based biosensors; high affinity for robust quantification. | Chicken anti-GFP (Abcam ab13970), Rabbit anti-GFP (Invitrogen A-11122). |
| Confocal/Multiphoton Microscope | High-resolution imaging for quantification of expression spread and intensity in fixed/live tissue. | Zeiss LSM 900, Olympus FV3000, or custom two-photon rig. |
| Image Analysis Software | To quantify fluorescence intensity, transduction volume, and cell counts objectively. | FIJI/ImageJ, Imaris, CellProfiler. |
| In Vivo Imaging Setup | For functional pilot studies (Protocol 2). Includes microscope, laser, and behavioral control. | Two-photon system (e.g., Bruker, Neurolabware) with integrated stimulus delivery. |
Within the broader thesis on AAV delivery methods for genetically encoded biosensors, achieving multiplexed interrogation of neural circuits is a paramount goal. Combining biosensors (e.g., for calcium, glutamate, dopamine) with effectors (optogenetic actuators or pharmacogenetic receptors) enables simultaneous readout and manipulation of cellular activity in vivo. This application note details strategies and protocols for effective co-delivery, addressing key challenges in vector design, rationing, and experimental validation.
Co-delivery Strategies: A Comparative Analysis
Effective multiplexing relies on strategic packaging of genetic cargo. The table below summarizes the primary approaches.
Table 1: Multiplexed AAV Co-delivery Strategies
| Strategy | Description | Typical Ratio (Effector:Sensor) | Max Combined Capacity | Key Advantage | Key Limitation |
|---|---|---|---|---|---|
| Dual AAV Co-infection | Separate AAVs for effector and sensor. | 1:1 to 3:1 (titer-dependent) | ~4.8 kb per vector | Flexibility; use of optimized serotypes/promoters. | Requires precise titer optimization; potential for variable co-expression. |
| Single AAV, Dual Expression | Single vector with two expression cassettes (e.g., using 2A peptides or IRES). | Fixed at ~1:1 | ~4.7 kb total | Guaranteed co-expression in infected cells. | Reduced cargo capacity; potential for unequal expression from IRES. |
| Bicistronic Single Promoter | Single open reading frame linking effector and sensor via self-cleaving peptide (P2A, T2A). | Fixed at 1:1 | ~4.4 kb total | Stoichiometric expression; highly compact. | Fusion protein artifacts possible if cleavage is incomplete. |
| Dual/Multipromoter in Single AAV | Two separate promoters in one vector (e.g., short synthetic promoters). | Tunable via promoter strength | ~4.0 kb total | Potential for independent expression level tuning. | Very limited capacity; promoter interference/crosstalk. |
| Overlapping Genes | Exploiting dual-coding sequences within a single transcript. | Fixed by design | Highly compact (~2.5 kb for two proteins) | Maximizes use of limited cargo space. | Complex design; limited to specific protein pairs; risk of mutation. |
Protocol: Co-infection with Dual AAVs (Flexible Strategy)
This protocol is for the most commonly used and flexible approach: co-injection of two separate AAVs.
I. Materials & Pre-injection Planning
- AAV Vectors: AAVs harboring biosensor (e.g., jGCaMP8m) and effector (e.g., Chronos-GFP or DREADD-mCherry). Serotypes: Often PHP.eB (mice), Retro/AAV hybrid (retrograde), or AAV9 for broad expression.
- Titration: Determine genome copies/mL (GC/mL) for each vial via qPCR.
- Target Region: Define stereotaxic coordinates (e.g., Primary Motor Cortex, M1: AP +1.8 mm, ML +1.5 mm, DV -0.8 mm from Bregma in adult mouse).
II. Titer Optimization and Mixture Preparation
- Calculate Injection Volumes: For a 300 nL injection, typical final titers are 1–5 x 10^12 GC/mL for each component. A 1:1 ratio is a standard starting point.
- Prepare Co-mix: Combine AAVs in a sterile microcentrifuge tube. Example for a 1:1 ratio:
- AAV-Biosensor (2e12 GC/mL): 7.5 µL
- AAV-Effector (2e12 GC/mL): 7.5 µL
- Optional Tracer: Add 1 µL of 10% Fluoro-Gold or PBS-based AAV with a constitutively expressed fluorophore (e.g., AAV-hSyn-mRuby) at 1e11 GC/mL to visualize injection core.
- Mix gently by pipetting. Centrifuge briefly before loading.
III. Stereotaxic Surgery and Intracranial Injection
- Anesthetize animal (e.g., 1–3% isoflurane in O2) and secure in stereotaxic frame.
- Perform craniotomy at target coordinates.
- Load injection syringe (e.g., NanoFil, World Precision Instruments) with viral mix.
- Lower needle at 200 µm/min to target depth. Wait 5 min for tissue settling.
- Inject 300 nL at 100 nL/min using an ultra-micro syringe pump.
- Wait 10 min post-injection before slowly withdrawing the needle (100 µm/min).
- Suture and provide postoperative care.
IV. Expression Time and Validation
- Expression Time: Allow 3–4 weeks for robust expression (AAV9, PHP.eB). DREADDs require 3+ weeks; opsins and sensors often stable by 2–3 weeks.
- Histological Validation:
- Perfuse and section brain.
- Image using a fluorescence microscope to confirm co-localization.
- Quantification: Calculate co-expression efficiency (% of effector-positive cells expressing the sensor, and vice versa) in minimum 3 brain sections from n≥3 animals. Aim for >70% co-expression for robust experiments.
Protocol: Validation of Functional MultiplexingIn Vivo
This protocol validates that the co-delivered tools are functionally operational.
I. Materials
- Animal prepared as in Section 2.
- Optical fibers (for optogenetic+biosensor combinations) or ligand (e.g., CNO, 1 mg/kg for DREADDs; JHU37160 for newer DREADDs).
- Fluorescence microscope or fiber photometry/endoscopy system.
II. Experimental Workflow for Optogenetic Stimulation + Calcium Imaging
- Implant optic fiber (400 µm core) above the injection site during the initial surgery or in a second procedure.
- Connect animal to a combined fiber photometry system under freely moving conditions.
- Baseline Recording: Record biosensor fluorescence (e.g., GCaMP) for 5–10 min.
- Stimulation-Evoked Recording: Deliver optogenetic stimulation (e.g., 470 nm, 10 ms pulses, 20 Hz for 2s) while concurrently recording GCaMP emission (525 nm). Include inter-trial intervals (>30s).
- Data Analysis:
- Calculate ΔF/F for sensor fluorescence.
- Compare peak ΔF/F during stimulation epochs vs. baseline periods using a paired t-test (p < 0.05).
- Expected Outcome: A significant increase in biosensor signal (ΔF/F) following optogenetic stimulation confirms successful functional multiplexing.
The Scientist's Toolkit: Research Reagent Solutions
Table 2: Essential Reagents for Multiplexed Co-delivery Experiments
| Reagent / Material | Function & Purpose | Example (Supplier/Reference) |
|---|---|---|
| AAV Helper-Free System | Production of high-titer, pure AAV vectors for co-delivery. | AAVpro Kit (Takara Bio); pAAV plasmids (Addgene). |
| Serotype-specific Antibodies | Purification and quantification of AAVs with specific tropism (e.g., AAV9, PHP.eB). | AAV9 Antibody (Progen); PHP.eB purification resin. |
| Self-cleaving Peptide Linkers | For constructing bicistronic expression cassettes within single AAV. | P2A, T2A, E2A sequences (synthesized as gBlocks, IDT). |
| Titer Quantification Kit | Accurate measurement of viral genome concentration for rationing. | AAVpro Titration Kit (qPCR) (Takara Bio). |
| Stereotaxic Injector | Precise intracranial delivery of viral mixtures. | NanoFil Syringe + UMP3 Pump (World Precision Instruments). |
| Fluorescent Tracer | Visual confirmation of injection site and spread. | Fluoro-Gold (Fluorochrome LLC); AAV-hSyn-mRuby3. |
| DREADD Agonist | Chemogenetic actuator for validating pharmacogenetic tool function. | CNO (Hello Bio); JHU37160 (more potent, inert metabolite). |
| Dual-Channel Fiber Photometry System | Simultaneous optogenetic stimulation and biosensor fluorescence recording. | Doric Lenses; Neurophotometrics FP3002. |
| Cell-type Specific Promoters | Restrict expression of sensor/effector to target populations. | pAAV-hSyn (neurons); pAAV-GFAP (astrocytes); pAAV-CaMKIIα (excitatory neurons). |
Visualizations
Diagram 1: Two Primary AAV Co-delivery Strategies (100 chars)
Diagram 2: Optogenetic Stimulation & Biosensor Readout (99 chars)
Diagram 3: Multiplexed Co-delivery Experimental Workflow (100 chars)
Solving Common Challenges: Optimizing Expression, Signal-to-Noise, and Specificity in AAV-Biosensor Experiments
Within the broader thesis on optimizing AAV delivery methods for genetically encoded biosensors, a critical and frequent roadblock is low transgene expression in target tissues. This outcome compromises the biosensor's signal-to-noise ratio and experimental utility. Low expression can stem from multiple, often interconnected, factors: inaccurate viral vector dosing (titer), insufficient promoter activity in the target cell type, or host innate/adaptive immune responses that silence or eliminate transduced cells. These Application Notes and Protocols provide a systematic framework for diagnosing and addressing these core issues, ensuring robust biosensor expression for in vivo neuroscience and physiology research.
Titer Verification: The Foundation of Reliable Dosing
Inaccurate AAV titer is a primary source of variability. Relying solely on manufacturer-provided titers (genome copies/mL, GC/mL) can lead to under- or over-dosing.
Protocol: In-house qPCR Titer Verification
Objective: To independently quantify the genomic titer of an AAV preparation. Materials: AAV sample, qPCR instrument, SYBR Green or TaqMan master mix, primers/probe targeting the vector genome (e.g., polyA signal, promoter region), DNase I, linearized plasmid standard matching the vector construct.
Steps:
- DNase Treatment: Treat 5 µL of AAV sample with DNase I (1 U/µL, 37°C, 30 min) to degrade unpackaged DNA. Inactivate DNase (65°C, 10 min).
- Viral Genome Release: Dilute treated sample 1:10 in 0.1% SDS solution and incubate at 95°C for 10 min to disrupt capsids and release viral genomes.
- Standard Curve Preparation: Serially dilute (e.g., 10^8 to 10^1 copies/µL) the linearized plasmid standard in nuclease-free water.
- qPCR Setup: Prepare reactions in triplicate for samples and standards. Use 2 µL of released genome or standard per 20 µL reaction. Use the following cycle: 95°C for 3 min; 40 cycles of 95°C for 15 sec, 60°C for 1 min.
- Analysis: Generate a standard curve from the Ct values of the standards. Use the curve to calculate the GC/µL in the original, untreated AAV sample, accounting for all dilution factors.
Table 1: Common Discrepancies in Titer Measurement Methods
| Method | Principle | Measures | Potential Overestimation Cause |
|---|---|---|---|
| qPCR (post-DNase) | Quantifies packaged genomes | Functional, packaged GC/mL | Minimal if protocol includes DNase step. |
| Droplet Digital PCR | Absolute quantification without standard curve | Functional, packaged GC/mL | Minimal. Considered gold standard. |
| UV Spectrophotometry | Absorbance at 260nm | Total nucleic acid (packaged + unpackaged) | Residual plasmid DNA, free nucleic acids. |
| ELISA | Antibody detection of capsid proteins | Physical particle titer | Empty capsids (lacking genome). |
Research Reagent Solutions: Titer Verification
| Item | Function/Explanation |
|---|---|
| DNase I (RNase-free) | Degrades unpackaged plasmid DNA in AAV preps to ensure qPCR measures only packaged genomes. |
| AAVpro Titration Kit (Takara) | Ready-to-use qPCR kit with standards and primers for common serotypes. |
| Linearized Plasmid Standard | Quantified standard identical to the packaged vector genome for accurate absolute qPCR. |
| AAV Empty Capsid ELISA | Quantifies total capsids; ratio of genomic titer (GC) to ELISA titer indicates % full particles. |
Diagnosing Promoter Issues
Promoter choice is paramount for cell-type-specific biosensor expression. A promoter deemed "strong" in one context may be weak or silent in another.
Protocol: In Vitro Promoter Screening with Dual-Luciferase Assay
Objective: Compare relative strength and specificity of candidate promoters in relevant cell lines. Materials: Cultured target cells (e.g., HEK293, primary neurons), candidate promoter constructs cloned into a dual-luciferase reporter plasmid (e.g., pGL4), transfection reagent, Dual-Luciferase Reporter Assay System.
Steps:
- Clone each candidate promoter to drive firefly luciferase in the reporter vector. A constitutively active promoter (e.g., SV40) drives Renilla luciferase on the same plasmid for normalization.
- Seed cells in 24-well plates. Transfect each promoter construct in triplicate.
- At 48 hours post-transfection, lyse cells and assay using the Dual-Luciferase system per manufacturer instructions.
- Measure luminescence. Calculate the ratio of Firefly to Renilla luminescence for each well. Normalize the average ratio for each test promoter to that of a ubiquitous control promoter (e.g., CAG or CMV) set to 100%.
Diagram: Workflow for Diagnosing Promoter Issues
Diagram Title: Promoter Suitability Testing Workflow
Investigating Host Immune Responses
Host immunity can clear transduced cells or silence transgene expression. Innate responses are triggered by the AAV capsid, while adaptive responses target both capsid and transgene product.
Protocol: Assessing Humoral Immune Response (Anti-AAV Neutralizing Antibodies)
Objective: Determine if pre-existing neutralizing antibodies (NAbs) in host serum are inhibiting AAV transduction. Materials: Target host serum (mouse, primate), HEK293 cells, AAV vector encoding a fluorescent reporter (e.g., GFP), control (naive) serum, cell culture medium.
Steps:
- Serially dilute test and control sera in culture medium (e.g., 1:1 to 1:50).
- Incubate a fixed, known titer of AAV-GFP (e.g., 1e4 GC/cell) with each serum dilution for 1 hour at 37°C.
- Add serum-AAV mixtures to pre-seeded HEK293 cells. Include an AAV-only (no serum) control.
- After 48-72 hours, analyze cells via flow cytometry for % GFP-positive cells.
- Calculate the NAb titer as the serum dilution that reduces transduction (GFP+ cells) by 50% (IC50) compared to the AAV-only control.
Protocol: Detecting Cellular Immune Response (IFN-γ ELISpot)
Objective: Detect T-cell responses against AAV capsid or transgene in splenocytes from injected animals. Materials: ELISpot plate (IFN-γ coated), splenocytes from AAV-injected and control animals, peptide pools spanning the AAV capsid VP1 protein or the biosensor protein, cell culture medium, ELISpot development kit.
Steps:
- Harvest spleen from animals 2-4 weeks post-AAV injection. Prepare a single-cell suspension.
- Seed splenocytes (2e5-5e5 cells/well) in the ELISpot plate. Add capsid or transgene peptide pools (1-2 µg/mL/peptide). Include positive (ConA/PMA) and negative (no peptide) controls.
- Incubate plate for 24-48 hours at 37°C.
- Develop plate per kit instructions. Count spot-forming units (SFUs) using an automated reader.
- A significant increase in SFUs in peptide-stimulated wells vs. negative control indicates a antigen-specific T-cell response.
Diagram: Host Immune Responses to AAV-Biosensor
Diagram Title: Immune Pathways Limiting AAV Expression
Research Reagent Solutions: Immune Analysis
| Item | Function/Explanation |
|---|---|
| AAV Neutralizing Antibody Assay Kit | Standardized in vitro kit using reporter AAV and cells to quantify serum NAb titers. |
| Mouse/Rhesus IFN-γ ELISpot Kit | For detecting cellular immune responses to capsid or transgene antigens. |
| Capsid-Specific Peptide Megapools | Overlapping peptides covering the entire VP1 sequence for T-cell epitope mapping. |
| Immunosuppressants (e.g., Dexamethasone, Rapamycin) | Used in co-administration protocols to dampen immune responses and prolong expression. |
Integrated Diagnostic Workflow
A systematic approach is required to pinpoint the cause of low expression.
Table 2: Integrated Diagnostic Decision Matrix
| Symptom | Titer Check Result | Promoter Check (In Vitro) | NAb Assay Result | Likely Primary Cause | Recommended Action |
|---|---|---|---|---|---|
| Low/no signal in all animals | Titer significantly lower than expected | Strong | Negative | Under-dosing | Re-quantify and re-dose with verified titer. |
| Variable signal between animals | Titer as expected | Strong | Variable between animals | Pre-existing NAbs | Screen hosts for NAbs; use NAb-negative cohorts or different serotype. |
| Signal declines over time (weeks) | Titer as expected | Strong | Negative at baseline | Cellular Immune Response | Perform ELISpot; consider immunosuppression or immune-stealth capsids. |
| Consistently low signal in target cell type only | Titer as expected | Weak in target cell line | Negative | Promoter Incompatibility | Switch to a cell-type-specific or stronger promoter for that cell type. |
Protocol: Comprehensive In Vivo Expression Troubleshooting
Objective: Systematically test the main hypotheses in a controlled animal cohort. Materials: Mice or rats, AAV-biosensor (test batch), AAV-biosensor with control promoter (e.g., CAG), AAV-GFP (same serotype), ELISA/ELISpot kits, tissue homogenization and imaging equipment.
Steps:
- Cohort Design: Divide animals into groups:
- Group 1: Standard AAV-biosensor dose.
- Group 2: High dose (5x) of AAV-biosensor.
- Group 3: AAV-biosensor with control promoter.
- Group 4: AAV-GFP (to control for serotype tropism/immunity).
- Pre-injection: Collect baseline serum from all animals for NAb testing.
- Injection: Administer vectors stereotaxically or systemically as per study design.
- Terminal Analysis (3-4 weeks post-injection):
- Image biosensor signal in vivo/ex vivo.
- Collect terminal serum for NAb re-testing.
- Harvest spleen for ELISpot (Group 1 vs. naive controls).
- Homogenize target tissue for Western blot to quantify biosensor protein levels.
- Interpretation:
- If Group 2 shows higher signal than Group 1 → Under-dosing likely.
- If Group 3 shows strong signal but Group 1 does not → Promoter issue confirmed.
- If AAV-GFP (Group 4) expresses well but AAV-biosensor does not → Transgene-specific immune response suspected (check ELISpot).
- Rising NAb titers correlate with signal loss → Humoral response implicated.
Within the broader thesis investigating Adeno-Associated Virus (AAV) delivery methods for genetically encoded biosensors, a paramount challenge is achieving a high signal-to-noise ratio (SNR). This document provides detailed application notes and protocols focused on three synergistic strategies: selecting optimal biosensor variants, configuring appropriate optical filter sets, and implementing techniques to reduce background fluorescence. Enhanced SNR is critical for in vivo imaging, high-throughput screening in drug development, and precise quantification of biochemical events.
Biosensor Variant Selection for Enhanced SNR
Genetically encoded biosensors, such as GCaMP for calcium or ASAP for voltage, are continually engineered for improved performance. Key variant characteristics directly influence SNR.
Key Variant Properties
- Brightness: Total photon output affects signal strength.
- Dynamic Range (ΔF/F0): The maximum fractional change in fluorescence upon sensing the target analyte.
- Apparent Affinity (Kd): Must match the expected physiological concentration range of the target.
- Maturation Efficiency & Stability: Affects expression uniformity and temporal stability.
- Excitation/Emission Peaks: Determines compatibility with light sources and filters, and potential for spectral crosstalk.
Quantitative Comparison of Common Biosensor Variants
Table 1: Comparative properties of selected genetically encoded biosensor variants (2023-2024 data).
| Biosensor (Target) | Variant | Brightness (Relative to EGFP) | Dynamic Range (ΔF/F0) in vitro | Apparent Kd / Voltage Sensitivity | Primary Ex/Em (nm) | Key Advantage for SNR |
|---|---|---|---|---|---|---|
| GCaMP (Ca²⁺) | jGCaMP8s | 1.5x GCaMP6s | ~20 | ~100 nM | 488/509 | Ultra-sensitive, large ΔF/F |
| XCaMP-G | 1.2x GCaMP6f | ~10 | ~300 nM | 472/495 | Green emission; less phototoxic | |
| jRGECO (Ca²⁺) | jRGECO1a | 0.9x mRuby2 | ~12 | ~150 nM | 561/590 | Red-shifted; reduces tissue autofluorescence |
| ASAP (Voltage) | ASAP3 | 1.8x ASAP1 | ~50% ΔF/F | 109 ms response | 488/516 | High brightness, fast kinetics |
| iGluSnFR (Glutamate) | iGluSnFR3 | High | ~5.3 | ~4.5 μM | 488/510 | Excellent membrane trafficking, stable expression |
Protocol: RapidIn VitroSNR Assessment for Variant Screening
Objective: Quantify brightness, dynamic range, and baseline noise of biosensor variants expressed in cultured cells prior to AAV production. Materials: HEK293T cells, plasmid DNA of biosensor variants, appropriate agonist/analyte, fluorescence plate reader or imaging system. Procedure:
- Transfection: Seed HEK293T cells in a 96-well black-walled, clear-bottom plate. Transfect each well with a fixed amount (e.g., 200 ng) of plasmid for each biosensor variant using a standardized method (e.g., PEI). Include untransfected wells for background measurement.
- Expression: Incubate for 24-48 hours to allow biosensor expression and maturation.
- Baseline Measurement (F0): Using a plate reader/imaging system with appropriate filter sets, measure the fluorescence intensity of each well. Perform 10 rapid sequential reads to assess baseline noise (standard deviation, σ0). Calculate mean F0 per variant.
- Stimulation (ΔF): Add a saturating concentration of the target analyte (e.g., ionomycin for Ca²⁺ sensors, high KCl for voltage sensors). Immediately measure the maximum fluorescence intensity (Fmax).
- Data Analysis:
- Dynamic Range: ΔF/F0 = (Fmax - F0) / F0.
- Baseline Noise: σ0.
- Preliminary SNR Estimate: SNR = (Fmax - F0) / σ0.
- Normalize all values to a common reference variant (e.g., GCaMP6s).
Optical Filter Set Configuration
Optimal filter selection maximizes signal collection and minimizes bleed-through and background.
Filter Set Components & Strategy
- Excitation Filter: Selects the wavelength band to illuminate the biosensor.
- Dichroic Mirror (Beamsplitter): Reflects excitation light and transmits emission light.
- Emission Filter: Selects the fluorescence photons from the biosensor, rejecting scattered excitation light and autofluorescence.
Quantitative Filter Selection Guide
Table 2: Recommended filter sets for common biosensor emission colors (based on Semrock and Chroma 2024 catalogs).
| Biosensor Emission Color | Optimal Ex Filter (Center/BW) | Recommended Dichroic | Optimal Em Filter (Center/BW) | Critical for Reducing: |
|---|---|---|---|---|
| Green (e.g., GCaMP) | 482/18 nm | FF495-Di03 | 525/45 nm | Blue-green tissue autofluorescence |
| Yellow (e.g., YFP) | 500/20 nm | FF520-Di03 | 542/27 nm | Green emission bleed-through |
| Red (e.g., jRGECO) | 562/40 nm | FF593-Di03 | 624/40 nm | Red-shifted autofluorescence (use narrow band) |
| Far-Red | 640/30 nm | FF660-Di02 | 705/72 nm | General background |
Protocol: Filter Set Validation & Spectral Bleed-Through Test
Objective: Empirically confirm filter set efficiency and quantify cross-talk in multi-color biosensor experiments. Materials: Microscope, filter sets to test, control samples (cells expressing single biosensors or fluorescent beads). Procedure:
- Prepare Control Samples: Use cells singly expressing Biosensor A (Green) and Biosensor B (Red), or suitable fluorescent beads with matched spectra.
- Image with Set A (Green): Image the "Green only" sample using the green filter set. Record intensity (Igreengreen). Then, without moving the sample, image the "Red only" sample using the same green filter set. Record intensity (Iredgreen). This measures bleed-through of red signal into the green channel.
- Image with Set B (Red): Repeat step 2, imaging both samples with the red filter set to get Iredred and Igreenred.
- Calculate Bleed-Through Coefficient:
- Bleed-Through (Green←Red) = Iredgreen / Iredred.
- Bleed-Through (Red←Green) = Igreenred / Igreengreen.
- Validation: A coefficient < 1-2% is excellent for simultaneous dual imaging. If higher, consider narrower bandpass filters or sequential imaging.
Background Fluorescence Reduction Strategies
Background arises from autofluorescence, non-specific biosensor expression, and optical system impurities.
- Tissue/Cell Autofluorescence: Use red-shifted biosensors (>600 nm); employ spectral unmixing; use time-gated detection for fluorescent lifetime imaging (FLIM).
- Non-Specific Expression: Utilize cell-type specific promoters in AAV constructs; improve AAV serotype tropism (e.g., AAV-PHP.eB for mouse CNS, AAV9 for heart).
- System Background: Use high-quality, autofluorescence-free optics and immersion oil; ensure complete darkness in camera shots.
Protocol:In VivoBackground Subtraction via Quenching
Objective: Measure and subtract non-biosensor background fluorescence in an in vivo AAV experiment. Materials: AAV-biosensor, control AAV expressing a static fluorophore (e.g., eGFP) or untransduced animal, site-specific quenching agent (e.g., Mn²⁺ for calcium sensors). Procedure:
- Experimental Groups: Inject AAV-biosensor into target tissue (Group 1). Inject AAV-eGFP (Group 2) or keep a naive animal (Group 3) as a background control.
- Baseline Imaging: Perform in vivo imaging (e.g., two-photon) of all groups under identical parameters. Record baseline fluorescence (F_total).
- Quenching Step (for Group 1 only): Apply a treatment that permanently quenches the biosensor signal without altering background. For calcium sensors, this can be topical/ systemic application of MnCl₂ (which quenches fluorescence and blocks channels) followed by ionomycin to saturate. For other sensors, consider photobleaching a reference region or using a specific inhibitor.
- Post-Quench Imaging: Image the same field of view. The remaining signal is background (F_bg).
- Calculate Corrected Signal: True biosensor fluorescence Fcorrected = Ftotal - Fbg. Use Fbg from Group 1 or the average from Groups 2 & 3.
The Scientist's Toolkit
Table 3: Essential research reagent solutions for biosensor SNR optimization in AAV-based research.
| Item | Function/Application in SNR Context |
|---|---|
| AAV Serotype Library (e.g., PHP.eB, AAV9, AAVrh10) | Enables cell-type-specific targeting, reducing off-target expression and background. |
| Cell-Type Specific Promoters (e.g., hSyn, CAG, CaMKIIα) | Restricts biosensor expression to relevant cell populations, enhancing specific signal. |
| Spectral Unmixing Software (e.g., Zen, ImageJ LAS X) | Computationally separates biosensor signal from overlapping autofluorescence spectra. |
| High-Quantum Efficiency sCMOS Cameras | Maximizes detection of emitted photons, improving signal strength and reducing required exposure. |
| Two-Photon Microscopy | Reduces out-of-focus background and tissue scattering, superior for deep-tissue in vivo imaging. |
| In Vitro Calibration Kits (Ionomycin, buffers) | Allows precise determination of biosensor dynamic range and affinity before in vivo use. |
| Anti-Quenching Mounting Media | Preserves fluorescence signal during fixed-tissue imaging, maintaining SNR post-processing. |
Experimental Workflow & Signaling Pathway Diagrams
Biosensor SNR Optimization Workflow
Biosensor Signaling to Detection Pathway
Within the broader thesis on AAV delivery methods for genetically encoded biosensors, achieving precise cell-type specificity is paramount. Off-target expression compromises data interpretation and therapeutic development. This application note details three cornerstone genetic strategies—Cre-dependent, FLEx, and intersectional approaches—enabling researchers to restrict biosensor expression to defined neuronal or cellular populations using recombinant AAV vectors.
Core Strategies & Quantitative Comparison
Table 1: Comparison of Cell-Type Specificity Strategies
| Strategy | Core Principle | Typical Specificity (Leakiness) | AAV Capacity Fit | Key Advantage | Key Limitation |
|---|---|---|---|---|---|
| Cre-Dependent | Inversion or excision of a STOP cassette by Cre recombinase. | High (<1% leak)* | Excellent for biosensors <~4.7 kb. | Simplicity; wide availability of Cre driver lines. | Dependent on single promoter; potential recombination in off-target cells. |
| FLEx (DIO) | Double-floxed inverted orientation; requires two Cre recombination events. | Very High (<0.1% leak)* | Good, but construct is larger. | Drastically reduced leaky expression; stable inversion. | Larger construct size; slower onset of expression. |
| Intersectional | Requires two independent recombinases (e.g., Cre AND Flp). | Highest (Theoretical ~0%)* | Challenging; often requires dual or co-injection. | Unparalleled specificity for defined cell subpopulations. | Complex breeding or delivery; limited toolbox of robust driver lines. |
*Leakiness estimates based on published data from somatic AAV delivery in rodent models (e.g., Madison et al., 2015; Fenno et al., 2014).
Detailed Protocols
Protocol 3.1: AAV Preparation for Cre-Dependent Biosensor Expression
Objective: Package a FLExed genetically encoded calcium indicator (e.g., jGCaMP8s) into AAV9 for in vivo expression. Materials: See "Scientist's Toolkit" below. Procedure:
- Vector Design: Clone your biosensor (e.g., jGCaMP8s) into a FLEx switch vector (e.g., pAAV-FLEX-jGCaMP8s). Ensure the transgene is in the antisense orientation, flanked by paired, antiparallel loxP variants (e.g., loxP and lox2272).
- Vector Production: Produce recombinant AAV9 via triple transfection in HEK293T cells.
- Day 1: Plate HEK293T cells at 70% confluency in 15-cm dishes.
- Day 2: Transfect using PEIpro with three plasmids: i) AAV rep/cap (serotype 9) plasmid, ii) Adenovirus helper plasmid (pHelper), and iii) Your pAAV-FLEX-biosensor plasmid. Use a 1:1:1 molar ratio, total DNA 20 µg per dish.
- Harvest & Purification: 72h post-transfection, harvest cells and media. Lyse cells via freeze-thaw cycles, treat with Benzonase, and purify via iodixanol density gradient ultracentrifugation.
- Titering: Quantify genomic titer (vg/mL) via ddPCR using primers/probes specific to the WPRE or polyA sequence.
Protocol 3.2: Stereotaxic Co-injection for Intersectional Targeting
Objective: Express a biosensor specifically in cells defined by Cre AND Flp expression. Materials: Stereotaxic apparatus, AAVs (see Toolkit), beveled glass micropipettes. Procedure:
- Virus Preparation: Mix two AAVs:
- AAV1-hSyn-Con/Fon-GFP (or biosensor): Expresses GFP only in presence of Cre AND Flp.
- AAV1-EF1a-FlpO: Provides Flp recombinase. Final titer: each virus at ≥ 1e12 vg/mL, 1:1 mix.
- Stereotaxic Surgery: Anesthetize and secure a double-transgenic Cre+/Flp+ mouse in the stereotax frame.
- Injection: Load virus mix into a pipette. Target the brain region (e.g., mPFC: AP +1.9 mm, ML +0.4 mm, DV -2.3 mm from Bregma). Inject 300 nL at 50 nL/min using a nanojector.
- Post-op: Allow 3-4 weeks for optimal biosensor expression before imaging or recording.
Visualizing Experimental Workflows
Title: Strategy Selection Workflow for Specificity
Title: FLEx/DIO AAV Recombination Mechanism
The Scientist's Toolkit: Research Reagent Solutions
Table 2: Essential Reagents for AAV-Mediated Specific Targeting
| Reagent | Function & Role in Specificity | Example Source/Identifier |
|---|---|---|
| Cre-Driver Mouse Lines | Provides cell-type-specific Cre expression. Essential for all Cre-dependent strategies. | Jackson Laboratory (e.g., PV-IRES-Cre, Sst-IRES-Cre, CaMKIIa-Cre). |
| FLEX/DIO AAV Backbone Plasmids | Cloning vectors with antiparallel lox sites for Cre-dependent inversion. Standard for low-leak biosensor delivery. | Addgene #28304 (pAAV-FLEX), #37084 (pAAV-hSyn-DIO). |
| Intersectional AAV Vectors | Vectors requiring two recombinases for expression (e.g., Con/Fon, DF/FD). Enables highest specificity. | Addgene #55636 (AAV-EF1a-Con/Fon), #55639 (AAV-hSyn-DIO-FRT). |
| High-Titer AAV Serotypes | Capsid determines tropism, efficiency, and spread. Critical for in vivo delivery. | Serotypes: AAV9 (broad CNS), AAV-PHP.eB/S (enhanced brain penetration in mice), AAVrh10. |
| Recombinase AAVs | For delivering Cre or Flp in vivo when driver lines are unavailable or for intersectional approaches. | Addgene #55632 (AAV-EF1a-Cre), #55637 (AAV-EF1a-FlpO). |
| Titering ddPCR Kit | Accurately quantifies AAV genomic titer (vg/mL), essential for dosing reproducibility. | Bio-Rad ddPCR Advanced Kit for Probes (assay-specific). |
| Stereotaxic Injector | Precise, nanoliter-volume delivery of AAV into defined brain coordinates. | Nanoject III (Drummond), UMP3 (WPI). |
Application Notes
The successful application of genetically encoded biosensors delivered via Adeno-Associated Virus (AAV) hinges on achieving a balance between sufficient signal-to-noise ratio and minimal cellular perturbation. This document outlines critical strategies for mitigating cytotoxicity and functional interference, framed within a broader thesis on optimizing AAV delivery methods for biosensor research.
1. The Expression Level Paradox: High-level biosensor expression, often pursued to maximize fluorescence output, can lead to:
- Cytotoxicity: Overwhelming cellular machinery (e.g., transcription/translation, chromophore synthesis).
- Functional Interference: Buffering of the target analyte (e.g., calcium, cAMP), sequestration of interacting partners, or aberrant activation of signaling pathways.
- Aggregation and Mislocalization: Saturation of proper folding or trafficking pathways.
2. Establishing Expression Thresholds: Empirical determination of a "therapeutic window" for biosensor expression is essential. The optimal titer is the lowest that provides a robust, quantifiable signal without affecting the biological process under study. Table 1 summarizes cytotoxicity thresholds for common biosensor classes.
3. Strategic Subcellular Targeting: Restricting biosensor expression to specific compartments minimizes global interference and enhances physiological relevance. Targeting can:
- Reduce the total cellular burden of the expressed protein.
- Prevent aberrant signaling from cytosolic or nuclear pools.
- Increase local concentration at the site of measurement, improving signal.
Table 1: Cytotoxicity and Functional Interference Thresholds for Common Biosensor Classes
| Biosensor Class (Example) | Target Analyte | Typical AAV Serotype | Suggested Max MOI/VG per Cell* | Observed Interference (Above Threshold) | Key Reference (PMID) |
|---|---|---|---|---|---|
| GCaMP6f (Cortical Neurons) | Ca²⁺ | AAV9, AAV-PHP.eB | 5e3 - 1e4 VG | Altered intrinsic excitability, calcium buffering | 29753686 |
| jRGECO1a (Cardiomyocytes) | Ca²⁺ | AAV9, AAV6 | 1e4 - 5e4 VG | Pro-arrhythmic effects, contractility changes | 30531930 |
| cAMPr (HEK293 Cells) | cAMP | AAV-DJ | 1e5 - 5e5 VG | Basal PKA activation, altered GPCR responses | 32817601 |
| iGluSnFR (Astrocytes) | Glutamate | AAV5, AAVrg | 2e4 - 1e5 VG | Glutamate clearance impairment | 25009252 |
| GRAB_DA1h (Striatal Neurons) | Dopamine | AAV9, AAV2-retro | 1e4 - 5e4 VG | D2 receptor antagonism, altered diffusion | 32929266 |
| HyPer7 (MEFs) | H₂O₂ | AAV-DJ | 5e4 - 2e5 VG | Oxidative stress induction | 33116228 |
*VG: Vector Genomes. MOI guidelines are cell-type and promoter-dependent. Titration is required.
Protocols
Protocol 1: Determining the Expression Level Threshold for a Novel Biosensor
Objective: To empirically determine the maximum AAV dose that does not induce cytotoxicity or functional interference in your target cell system.
Materials:
- Research Reagent Solutions: See Table 2.
- Purified AAV biosensor construct (e.g., AAV9-CAG-GCaMP8s).
- Target cells (primary or cell line).
- Appropriate cell culture reagents.
- Functional assay reagents (e.g., calcium dye, ATP assay, electrophysiology setup).
- Microscope or flow cytometer.
Procedure:
- AAV Titration Series: Infect your target cells in vitro with a logarithmic dilution series of your AAV prep (e.g., 1e2, 1e3, 1e4, 1e5, 1e6 VG/cell). Include an uninfected control and a control expressing a fluorescent protein only (e.g., GFP).
- Incubation: Allow 5-7 days for robust expression in primary neurons (or 48-72 hrs for dividing cell lines).
- Viability Assessment (72 hrs post-infection):
- Perform an ATP-based cell viability assay (e.g., CellTiter-Glo) in a plate reader.
- Normalize luminescence to the uninfected control. A drop >20% indicates cytotoxicity.
- Expression Analysis (Day 5-7):
- Quantify mean fluorescence intensity (MFI) per cell using flow cytometry or high-content imaging.
- Plot MFI vs. AAV dose to establish the expression curve.
- Functional Validation (Day 5-7):
- Perform the key physiological assay relevant to your system (e.g., measure electrically evoked calcium transients, assess agonist-induced cAMP production, record spontaneous action potentials).
- Compare functional readouts from biosensor-expressing cells to both uninfected and fluorescent protein-only controls at each AAV dose.
- Threshold Identification: The maximum safe dose is the highest viral titer where:
- Viability is ≥85% of control.
- Key functional parameters are not statistically different from controls.
- Biosensor signal (MFI) is sufficiently above background.
Protocol 2: Implementing and Validating Subcellular Targeting
Objective: To enhance biosensor performance and reduce interference by targeting it to a specific organelle (e.g., plasma membrane, mitochondria).
Materials:
- Research Reagent Solutions: See Table 2.
- AAV prep encoding targeted biosensor (e.g., AAV1-hSyn-GCaMP6f-OMM for mitochondrial matrix).
- AAV prep encoding non-targeted (cytosolic) version.
- Immunocytochemistry (ICC) antibodies for the target organelle.
- Confocal microscope.
- Organelle-specific functional assay reagents (e.g., TMRM for mitochondrial membrane potential).
Procedure:
- Infection: Infect target cells with the targeted and non-targeted AAV biosensors at the "max safe dose" determined in Protocol 1.
- Localization Validation (Day 5-7):
- Fix cells and perform ICC for an organelle marker (e.g., Tom20 for mitochondria, Na⁺/K⁺ ATPase for plasma membrane).
- Acquire high-resolution z-stack images via confocal microscopy.
- Calculate Pearson's or Manders' colocalization coefficients between biosensor fluorescence and the organelle marker. Successful targeting yields coefficients >0.8.
- Functional Specificity Test:
- For organelle-targeted sensors: Apply an organelle-specific stimulus (e.g., FCCP for mitochondrial depolarization, receptor agonist for plasma membrane signaling).
- Record biosensor dynamics and compare to the response of a chemical indicator specific to that compartment (if available).
- The targeted biosensor should report changes specific to its compartment, with minimal cross-talk from cytosolic events.
- Interference Assessment: Repeat the functional validation from Protocol 1, Step 5. Properly targeted sensors should show reduced global functional interference compared to their cytosolic counterparts at equivalent expression levels.
Table 2: The Scientist's Toolkit: Key Research Reagent Solutions
| Item | Function in Protocol | Example Product/Catalog # |
|---|---|---|
| AAV Purification Kit | Purifies AAV vectors from cell lysates or media, essential for high-titer, clean preps. | AAVpro Purification Kit (Takara) |
| qPCR AAV Titration Kit | Accurately quantifies viral genome (VG) titer, critical for dose consistency. | AAV Genome Titration Kit (Applied Biological Materials) |
| Cell Viability Assay | Quantifies metabolic activity/cytotoxicity as a function of AAV dose (Protocol 1). | CellTiter-Glo 2.0 (Promega) |
| Organelle-Specific Dye | Validates subcellular targeting and provides a reference signal (Protocol 2). | MitoTracker Deep Red (Thermo Fisher) |
| Fixable Viability Stain | Allows exclusion of dead cells during flow cytometry analysis of expression. | Zombie NIR Fixable Viability Kit (BioLegend) |
| Colocalization Analysis Software | Quantifies the precision of subcellular targeting from confocal images (Protocol 2). | Fiji/ImageJ with JaCoP or Coloc2 plugin |
| GPCR Agonist Library | For functional validation of biosensors reporting second messengers (cAMP, Ca²⁺). | Tocriscreen Mini Library (Tocris) |
Visualizations
Title: Biosensor Expression Optimization Logic
Title: AAV Biosensor Validation Workflow
Application Notes
The development of genetically encoded biosensors for calcium, neurotransmitters, and metabolic activity has revolutionized neuroscience and physiology research. However, the ~4.7 kb packaging limit of adeno-associated virus (AAV), the premier delivery vector, severely constrains the application of larger, more complex biosensors. This note details strategies to overcome this barrier, enabling the delivery of biosensor expression cassettes exceeding the AAV cargo capacity.
Dual-Vector Trans-splicing (Split Intein) Systems: This method splits the biosensor coding sequence at a specific site into two separate AAV vectors. The split site is flanked by engineered intron fragments. Following co-infection, mRNA transcripts from the two vectors are spliced together via the trans-splicing mechanism, reconstituting the full-length biosensor mRNA. Efficiency depends heavily on the co-infection rate of the same cell by both vectors.
Dual-Vector Overlap (Homologous Recombination) Systems: The biosensor sequence is divided into two overlapping fragments, each packaged into separate AAV vectors. The overlap region contains homologous sequences (typically 200-500 bp). Inside the co-infected cell, the overlapping fragments undergo homologous recombination, reassembling the intact expression cassette. This method often shows higher efficiency than trans-splicing but risks generating concatemers.
Quantitative Comparison of Dual-Vector Strategies:
Table 1: Performance Metrics of Dual-Vector AAV Systems for Large Biosensor Delivery
| Parameter | Trans-splicing (Split Intein) | Overlap (Homologous Recombination) |
|---|---|---|
| Typical Reconstitution Efficiency | 10-30% of co-infected cells | 20-50% of co-infected cells |
| Minimum Overlap/Intein Size | ~150 bp (split intein) | 200-500 bp (homology region) |
| Risk of Incomplete/Truncated Products | Moderate | Lower (if homology region is internal) |
| Risk of Concatemer Formation | Low | Moderate to High |
| Key Dependency | mRNA splicing efficiency | DNA recombination machinery |
| Commonly Used Serotypes | AAV1, AAV2, AAV5, AAV9 | AAV2, AAV5, AAV8, AAV9 |
Recent Advances: Third-generation "hybrid" systems combine elements of both, using truncated introns and homologous arms to improve efficiency. Furthermore, the development of AAV serotypes with enhanced tropism for specific cell types (e.g., AAV-PHP.eB for mice, AAV9P1 for non-human primates) is critical for improving co-infection rates in vivo.
Protocols
Protocol 1: Design and Cloning for Dual-Vector Overlap System
Objective: To clone a 6.5 kb GFP-based calcium biosensor (e.g., jGCaMP8s) using a dual-vector overlap strategy.
Materials:
- Reagent Solutions: See "Research Reagent Solutions" table.
- Template DNA: Full-length jGCaMP8s in a plasmid backbone.
- Primers: Designed to split the gene with a 400 bp homologous overlap region in the middle of the sequence.
- Enzymes: High-fidelity DNA polymerase, restriction enzymes, T4 DNA Ligase.
- Vectors: AAV ITR-containing plasmids (e.g., pAAV-MCS).
Methodology:
- Fragment Amplification: Perform two separate PCRs to generate the 5' and 3' halves of jGCaMP8s. The 3' end of Fragment A (5' half) and the 5' end of Fragment B (3' half) must contain the designed 400 bp homologous sequence.
- Vector Preparation: Digest two pAAV-MCS plasmids with appropriate restriction enzymes to create compatible ends for each fragment.
- Assembly: Use Gibson Assembly or In-Fusion cloning to insert Fragment A into Vector 1 and Fragment B into Vector 2. Transform into competent E. coli.
- Validation: Confirm correct assembly by colony PCR, diagnostic restriction digest, and Sanger sequencing across the junction sites and homology region.
- Vector Production: Maxi-prep the two final plasmids (pAAV-Fragment A and pAAV-Fragment B) for AAV production.
Protocol 2:In VivoDelivery and Validation of Reconstituted Biosensor
Objective: To express the full-length jGCaMP8s in mouse cortical neurons via co-injection of two overlapping AAVs.
Materials:
- AAV Vectors: AAV9-Fragment A and AAV9-Fragment B (titer ≥ 1e13 vg/mL).
- Animal Model: Adult C57BL/6 mice.
- Surgical Equipment: Stereotaxic frame, micro-syringe pump.
- Validation Tools: Two-photon/confocal microscope, electrophysiology setup.
Methodology:
- Virus Mix Preparation: Combine AAV9-Fragment A and AAV9-Fragment B at a 1:1 volumetric ratio (total titer ~2e13 vg/mL) in sterile PBS.
- Stereotaxic Injection: Anesthetize the mouse and secure in the stereotaxic frame. Target the primary visual cortex (V1). Inject 300-500 nL of the virus mix at a rate of 100 nL/min. Wait 10 minutes before slowly retracting the needle.
- Incubation: Allow 4-6 weeks for optimal expression and biosensor maturation.
- Validation:
- Imaging: Perform in vivo two-photon imaging to detect GFP fluorescence. Compare signal to negative control (single vector injection).
- Functional Test: Present visual stimuli (drifting gratings) while recording fluorescence changes to confirm calcium-dependent dynamics.
- Histology: Perfuse and section the brain. Immunostain for neuronal markers (NeuN) to confirm neuronal expression and assess recombination efficiency by counting double-labeled cells.
Visualizations
Dual-Vector Homologous Recombination Workflow
GCaMP Biosensor Calcium Sensing Pathway
The Scientist's Toolkit
Table 2: Key Research Reagent Solutions for AAV Dual-Vector Biosensor Delivery
| Reagent / Material | Function & Application |
|---|---|
| pAAV-ITR Plasmids | Backbone vectors containing AAV2 inverted terminal repeats (ITRs) essential for viral packaging and replication. |
| Split Intein Sequences | Engineered protein-splicing elements (e.g., Npu DnaE) used to split the biosensor for trans-splicing vector systems. |
| High-Fidelity Polymerase | Enzyme for accurate PCR amplification of large biosensor fragments with minimal errors (e.g., Q5, Phusion). |
| Gibson/In-Fusion Master Mix | Enzymatic mix for seamless, restriction-free assembly of multiple DNA fragments into a vector (critical for overlap design). |
| HEK293T/AAV-293 Cells | Cell line for high-titer AAV production via triple transfection (AAV vector, rep/cap, helper plasmids). |
| Iodixanol Gradient Medium | Used for ultracentrifugation-based purification of AAV particles, yielding high-purity, high-infectivity preparations. |
| ITR-specific qPCR Primers | For accurate titration of packaged AAV genomes, avoiding plasmid DNA contamination. |
| NeuN / GFAP Antibodies | For immunohistochemical validation of cell-type-specific expression (neurons vs. astrocytes) post-injection. |
Benchmarking Performance: Validation Frameworks and Comparative Analysis of AAV-Biosensor Delivery
Within the broader thesis on optimizing Adeno-Associated Virus (AAV) delivery methods for genetically encoded biosensors (GEBs) in neuroscience and drug discovery, rigorous validation is paramount. AAVs offer versatile tropism but introduce variability in transduction efficiency, biosensor expression levels, and off-target expression. This document details application notes and protocols for three pillars of validation essential for interpreting biosensor data: establishing antibody specificity for immunohistochemical (IHC) verification, confirming biosensor functionality with defined positive control stimuli, and mapping expression patterns relative to target cell populations. These controls ensure that observed fluorescence signals faithfully report physiological events.
Validation Pillar I: Specificity (Immunohistochemistry)
Application Notes
IHC is critical for confirming that the expressed biosensor protein is localized to the intended cellular compartment and cell type. For GEBs like GCaMP (calcium) or iGluSnFR (glutamate), this involves validating the specificity of anti-GFP/RFP antibodies against the biosensor's fluorescent protein moiety, especially in wild-type tissues that may exhibit autofluorescence or non-specific binding.
Recent Findings (2023-2024): A systemic review highlighted that over 30% of commercially available antibodies fail specificity tests in knockout validation assays. For AAV-delivered biosensors, this underscores the need for parallel staining of AAV-injected tissue and non-injected or wild-type controls, as well as the use of knockout/knockdown tissue for antibody validation where possible.
Protocol: Specificity Validation for Biosensor IHC
Objective: To confirm the specificity of immunostaining for an AAV-delivered GEB in brain tissue slices.
Materials:
- Tissue from AAV-biosensor injected animal (Test).
- Tissue from non-injected wild-type animal (Negative Control).
- Tissue from animal injected with AAV expressing fluorescent protein only (e.g., eGFP) (Positive Control for antibody).
- Primary antibody: e.g., Chicken anti-GFP (1:1000).
- Validated cell-type marker antibody: e.g., Mouse anti-NeuN (neuronal nuclei).
- Appropriate fluorescent secondary antibodies.
- Blocking solution: 3% normal donkey serum, 0.3% Triton X-100 in PBS.
- Mounting medium with DAPI.
Methodology:
- Perfusion & Sectioning: Perfuse transcardially with PBS followed by 4% PFA. Post-fix brains for 24h at 4°C, then section at 40µm using a vibratome.
- Free-Floating Immunohistochemistry: a. Wash sections 3x in PBS. b. Block in blocking solution for 2h at RT. c. Incubate in primary antibody cocktail (anti-GFP + cell-type marker) in blocking solution for 48h at 4°C. d. Wash 6x over 90 minutes in PBS. e. Incubate in secondary antibodies (e.g., Donkey anti-Chicken 488, Donkey anti-Mouse 647) for 4h at RT. f. Wash 6x over 90 minutes in PBS. g. Mount slides, apply mounting medium with DAPI.
- Imaging & Analysis: Image using a confocal microscope. For specificity assessment:
- Test Sample: Co-localization of biosensor signal (anti-GFP) with cell-type marker is quantified (e.g., Mander's coefficient).
- Negative Control: Wild-type tissue should show no specific anti-GFP signal above background autofluorescence.
- Positive Control: Tissue expressing eGFP-only should show robust anti-GFP signal.
Table 1: Specificity Validation Metrics Example
| Sample Type | Mean GFP Signal Intensity (AU) | Co-localization with NeuN+ (%) | Background (Wild-type) Signal (AU) | Specificity Ratio (Test/Neg Ctrl) |
|---|---|---|---|---|
| AAV-GCaMP8f | 1250 ± 210 | 98.2 ± 1.1 | 105 ± 15 | 11.9 |
| Wild-type (No AAV) | 105 ± 15 | N/A | 105 ± 15 | 1.0 (baseline) |
| AAV-eGFP | 3100 ± 450 | 96.5 ± 2.3 | 110 ± 20 | 28.2 |
Validation Pillar II: Functionality (Positive Control Stimuli)
Application Notes
A biosensor must dynamically respond to its target analyte. Functionality validation requires application of a known, maximally effective stimulus to elicit a reproducible sensor response in situ. This establishes the dynamic range and confirms the sensor is properly folded and localized post-AAV delivery.
Recent Insights (2024): For neurotransmitter biosensors, the move towards in vivo positive controls via optogenetic stimulation of specific pathways is becoming best practice, as it validates functionality within the native synaptic architecture.
Protocol:In VivoPositive Control for Glutamate Biosensor
Objective: To validate the functionality of an AAV-delivered iGluSnFR in the mouse visual cortex using a defined visual stimulus.
Materials:
- Mouse expressing iGluSnFR in V1 via AAV injection.
- Craniotomy and chronic window implantation over V1.
- Two-photon microscopy setup.
- Visual stimulation system (monitor).
- Data acquisition software (e.g., ScanImage, Python).
Methodology:
- Surgical Preparation: Inject AAV1-hSyn-iGluSnFR into primary visual cortex (V1). Allow 3-4 weeks for expression. Implant a chronic cranial window.
- Two-Photon Imaging: Anesthetize or head-fix the awake mouse under the two-photon microscope. Identify expressing regions.
- Stimulus Protocol: Present full-field, high-contrast, drifting grating stimuli (100% contrast, 0.04 cycles/degree, 2Hz temporal frequency) for 2s, with 10s inter-trial interval. Repeat 20 times.
- Data Analysis: Extract fluorescence (F) from regions of interest (ROIs). Calculate ΔF/F0 = (F - F0) / F0, where F0 is the mean fluorescence during the 2s pre-stimulus baseline. Average responses across trials.
Table 2: Functionality Validation Data Example (iGluSnFR in V1)
| Stimulus Condition | Peak ΔF/F0 (%) | Time to Peak (ms) | Decay Tau (ms) | Trial-to-Trial Reliability (Pearson's r) |
|---|---|---|---|---|
| High-Contrast Grating | 35.2 ± 4.1 | 85 ± 12 | 320 ± 45 | 0.92 |
| No Stimulus (Baseline) | 0.5 ± 0.3 | N/A | N/A | N/A |
Diagram Title: In Vivo Positive Control Workflow for Biosensor Validation
Validation Pillar III: Expression Pattern Mapping
Application Notes
Mapping the spatial pattern of biosensor expression relative to target cell types is crucial for data interpretation, especially given AAV serotype and promoter tropism. Quantifying expression in on-target vs. off-target cells (e.g., neurons vs. astrocytes) determines the cellular source of the biosensor signal.
Current Data (2024): Studies using single-nucleus RNA sequencing (snRNA-seq) on AAV-transduced tissues show that even neuron-specific promoters (e.g., hSyn) can drive expression in 5-15% of non-neuronal cells depending on serotype and titer.
Protocol: Quantitative Expression Pattern Mapping
Objective: To quantify the cellular specificity of AAV-delivered biosensor expression using multiplexed FISH (RNAscope) and IHC.
Materials:
- Tissue from AAV-biosensor injected animal.
- RNAscope Multiplex Fluorescent V2 Assay kit.
- Target probes: Biosensor mRNA (custom), Slc17a7 (vGlut1, excitatory neurons), Gad1 (GABAergic neurons), Gfap (astrocytes).
- DAPI.
- Confocal or widefield microscope with appropriate filters.
- Image analysis software (e.g., QuPath, CellProfiler).
Methodology:
- Tissue Preparation: Fresh-frozen or fixed tissue sections (10-20 µm).
- Multiplex FISH: Perform RNAscope per manufacturer's protocol for 3-4 plex.
- Sequential IHC (Optional): After FISH, perform IHC for the biosensor protein using a spectrally distinct fluorophore to compare mRNA and protein distribution.
- High-Throughput Imaging: Acquire images from multiple, randomly selected fields of view.
- Automated Segmentation & Classification: Use DAPI to define nuclei. Use marker gene expression to classify cell types. Quantify biosensor mRNA or protein signal within each classified cell.
Table 3: Expression Pattern Mapping Results Example (AAV9-hSyn-GCaMP8f in Hippocampus)
| Cell Type Marker | Total Cells Counted | Cells Positive for Biosensor (%) | Mean Biosensor Intensity in Positive Cells (AU) | On-Target Specificity Index* |
|---|---|---|---|---|
| Slc17a7 (Excitatory) | 1250 | 89.4% | 1550 ± 320 | 8.7 |
| Gad1 (Inhibitory) | 580 | 82.1% | 1420 ± 290 | 8.0 |
| Gfap (Astrocytes) | 410 | 11.2% | 580 ± 150 | 0.6 |
| All DAPI+ Cells | 2450 | 72.5% | 1380 ± 350 | N/A |
Specificity Index = (% Biosensor+ in Marker+ cells) / (% Biosensor+ in Marker- cells).
Diagram Title: Expression Pattern Mapping via Multiplex FISH
The Scientist's Toolkit: Research Reagent Solutions
Table 4: Essential Materials for Biosensor Validation Experiments
| Item Name & Example | Category | Function in Validation | Key Consideration |
|---|---|---|---|
| Validated Primary Antibodies (e.g., Anti-GFP, Anti-RFP) | Reagent | Detects biosensor protein for IHC specificity and expression mapping. | Must be validated via knockout tissue; species compatibility for multiplexing. |
| AAV Serotype/Promoter Combo (e.g., AAV9-hSyn, AAV1-CaMKIIa) | Viral Vector | Determines tropism and expression level for the biosensor. | Choice dictates target cell population; requires empirical testing for each model. |
| Cell-Type Specific Marker Probes (e.g., RNAscope for Slc17a7, Gad1) | Reagent | Identifies specific cell populations for expression pattern mapping. | Requires high specificity and sensitivity; multiplexing capability is key. |
| Defined Positive Control Agonist (e.g., 50mM KCl, 100µM Glutamate, Optogenetic Actuator) | Stimulus | Elicits maximal biosensor response to validate functionality. | Must be reliable, reproducible, and target-specific. In vivo relevance is a plus. |
| Chronic Cranial Window & Imaging Setup (e.g., Two-Photon Microscope) | Equipment | Enables in vivo functionality testing and longitudinal expression monitoring. | Requires stable implantation and compatible anesthesia/awake imaging paradigms. |
| Image Analysis Suite (e.g., QuPath, CellProfiler, Suite2p) | Software | Quantifies co-localization, fluorescence dynamics, and cell-type specific expression. | Must handle large datasets and allow for custom pipeline development for analysis. |
Within the broader thesis on optimizing AAV delivery methods for genetically encoded biosensors, precise quantification of delivery efficiency is paramount. Efficient transduction, coupled with targeted expression (cellular somata versus neuropil processes), and broad yet controlled regional coverage, are critical determinants for the success of biosensor-based research in neuroscience and drug development. This application note details protocols and metrics for assessing these key parameters.
Table 1: Core Metrics for Quantifying AAV Delivery Efficiency
| Metric | Definition | Typical Measurement Method | Target Optimal Range (Cortical Biosensor Expression) |
|---|---|---|---|
| Transduction Rate | Percentage of target cell population expressing the biosensor. | (Fluorescent+ Cells / Total Target Cells) x 100% from IHC/IF. | >70% for homogeneous population studies. |
| Cellular Specificity Index (CSI) | Ratio of mean fluorescence intensity in cell bodies vs. local neuropil. | (MFIsoma / MFIneuropil) from high-res confocal images. | >2.0 for cell-body localized indicators. |
| Neuropil Expression Index (NEI) | Ratio of fluorescence in processes/synapses to somatic fluorescence. | (MFIneuropil / MFIsoma). Inverse of CSI. | <0.5 for soma-targeted biosensors; >1.5 for synaptically targeted. |
| Regional Coverage Density | Area fraction of the target brain region exhibiting biosensor signal above threshold. | (Areaabovethreshold / Totalregionarea) x 100% from widefield imaging. | >80% for bulk signal measurements. |
| Titer-Dependent Yield | Functional viral particles per volume resulting in expression. | Serial dilution & quantification of transduction foci in vitro. | 1x10^12 – 1x10^13 vg/mL for in vivo use. |
| Onset & Peak Expression Time | Time post-injection to first detectable and maximal biosensor signal. | Longitudinal in vivo imaging or terminal time-course studies. | Peak: 3-6 weeks for most AAV serotypes. |
Table 2: Comparison of AAV Serotypes for Biosensor Delivery
| AAV Serotype | Primary Cellular Tropism (CNS) | Relative Transduction Rate (Neurons) | Neuropil Expression Tendency | Notes for Biosensor Research |
|---|---|---|---|---|
| AAV9 | Neurons, Astrocytes | Very High | High | Broad coverage, but may require cell-specific promoters. |
| AAV-PHP.eB | Neurons (CNS-wide) | High | Moderate | Excellent for non-invasive systemic delivery in transgenic mice. |
| AAVrh10 | Neurons | High | Moderate | Alternative to AAV9 with similar profile. |
| AAV1 | Neurons | High | High | Often leads to strong neuropil staining; use with soma-targeting tags. |
| AAV2 | Neurons | Moderate | Low | More localized spread at injection site, lower neuropil. |
| AAV5 | Neurons, Astrocytes | Moderate | Very High | Pronounced neuropil patterning; ideal for synaptic biosensors. |
| AAV-DJ | Broad (Neurons, Glia) | High | Moderate | Chimeric capsid; good for hard-to-transduce cells. |
Detailed Experimental Protocols
Protocol 3.1: Stereotaxic Intracranial Injection for Biosensor Delivery
Objective: To deliver AAV encoding a genetically encoded biosensor into a specific brain region of a rodent model. Materials: Purified AAV biosensor vector (>1x10^12 vg/mL), stereotaxic apparatus, microsyringe (e.g., Hamilton), isoflurane anesthesia system, surgical tools, analgesic/antibiotic. Procedure:
- Anesthetize animal and secure head in stereotaxic frame.
- Aseptically expose the skull. Identify Bregma and Lambda.
- Calculate target coordinates (AP, ML, DV) relative to Bregma.
- Drill a small craniotomy at the AP/ML coordinate.
- Load viral solution into microsyringe. Lower needle to target DV coordinate at a slow, steady rate (e.g., 1 mm/min).
- Infuse virus at a controlled rate (e.g., 50 nL/min). Typical volume: 300-500 nL for focal expression, 1-2 µL for regional coverage.
- Wait 5-10 minutes post-infusion to minimize backflow.
- Withdraw needle slowly (e.g., 0.2 mm/min).
- Close the surgical site and provide post-operative care.
- Allow 3-6 weeks for optimal biosensor expression.
Protocol 3.2: Quantifying Transduction Rate and Cellular vs. Neuropil Expression
Objective: To histologically quantify the percentage of transduced cells and the subcellular localization of the biosensor. Materials: Perfused tissue sections, primary antibodies (e.g., NeuN, GFP for biosensor), fluorescent secondary antibodies, confocal microscope, image analysis software (e.g., ImageJ, Imaris). Procedure:
- Tissue Preparation: At endpoint, transcardially perfuse with PBS followed by 4% PFA. Extract brain, post-fix, section (40-50 µm) using vibratome.
- Immunohistochemistry: Block sections. Incubate with primary antibodies: anti-GFP (label biosensor) and anti-NeuN (label neuronal nuclei). Wash and incubate with fluorophore-conjugated secondaries.
- Confocal Imaging: Acquire high-resolution z-stacks (63x oil objective) from at least 3 random fields within the injection site/region of interest (ROI). Ensure identical acquisition settings across samples.
- Image Analysis for Transduction Rate: a. Use the NeuN channel to create a mask of all neuronal nuclei. b. Use the biosensor (GFP) channel to identify fluorescent-positive cells. Apply intensity threshold to define positive signal. c. Calculate: Transduction Rate = (Number of double-positive cells / Total NeuN+ cells) x 100%.
- Image Analysis for Cellular Specificity Index (CSI): a. For each transduced neuron, draw two ROIs: one encompassing the soma (excluding nucleus), and one in the adjacent neuropil (cell-free area within 20 µm of the soma). b. Measure Mean Fluorescence Intensity (MFI) for both ROIs in the biosensor channel. c. Calculate CSI per cell: CSI = MFIsoma / MFIneuropil. d. Report the median CSI for the sampled population.
Protocol 3.3: Mapping Regional Coverage Density
Objective: To assess the spatial extent and homogeneity of biosensor expression across a target brain region. Materials: Widefield fluorescence microscope or slide scanner, brain atlas registration software (e.g., Allen CCF, ImageJ plugins). Procedure:
- Low-Magnitude Imaging: Image entire coronal or sagittal sections containing the target region (e.g., striatum, hippocampus) using a 5x or 10x objective.
- Define Region of Interest (ROI): Manually or automatically outline the target anatomical region based on a reference atlas.
- Thresholding: Apply a consistent fluorescence intensity threshold to distinguish specific biosensor signal from background autofluorescence. This can be derived from control (non-injected) tissue sections.
- Calculate Coverage Density: Coverage Density = (Pixel area above threshold within ROI / Total pixel area of ROI) x 100%.
- Generate Heat Maps: Overlay the thresholded signal map onto the anatomical outline to visualize expression homogeneity.
Visualizations
Diagram 1: Workflow for AAV Biosensor Delivery Efficiency Analysis
Diagram 2: Factors Determining Cellular vs Neuropil Expression
The Scientist's Toolkit: Research Reagent Solutions
Table 3: Essential Materials for AAV Biosensor Delivery & Quantification
| Item | Function/Benefit | Example Vendor/Product |
|---|---|---|
| High-Titer AAV Prep | Ensures high transduction efficiency; purity critical for in vivo safety and consistency. | Custom production from core facilities (e.g., Virovek, Addgene AAV services). |
| Cell-Type Specific Promoters | Restricts biosensor expression to defined neuronal or glial populations, enhancing specificity. | Plasmids: pAAV-hSyn1 (neurons), pAAV-GFAP (astrocytes), pAAV-CaMKIIa (excitatory neurons). |
| Subcellular Targeting Tags | Directs biosensor to soma, nucleus, axons, or synapses, controlling CSI/NEI. | Sequences: Nuclear Localization Signal (NLS), Synaptophysin tag, PSD-95 tag, Dendritic targeting motif. |
| Stereotaxic Frame | Provides precise, reproducible targeting of specific brain coordinates for injection. | KOPF Model 940, RWD Life Science systems. |
| Microsyringe & Controller | Allows nanoliter-precise injection volumes and rates for controlled viral spread. | Hamilton Syringe (10 µL) + UltraMicroPump (World Precision Instruments). |
| Confocal Microscope | Enables high-resolution imaging for quantifying cellular and subcellular expression. | Zeiss LSM 900, Nikon A1R, Leica Stellaris. |
| Image Analysis Software | Essential for automated cell counting, intensity measurement, and regional coverage analysis. | ImageJ/FIJI, Imaris (Oxford Instruments), CellProfiler. |
| Brain Atlas Registration Software | Aligns experimental images to standard coordinates for accurate regional analysis. | Allen Brain Atlas API, QuickNII, BrainGlobe Atlas (brainreg). |
| Anti-GFP Antibody | Amplifies biosensor signal for robust detection, even for dim indicators. | Chicken anti-GFP (Aves Labs, GFP-1020), Rabbit anti-GFP (Invitrogen, A-11122). |
| NeuN/Antibody | Labels neuronal nuclei for definitive identification of target cell population. | Mouse anti-NeuN (Millipore Sigma, MAB377). |
This application note is framed within a broader thesis investigating Adeno-Associated Virus (AAV) delivery methods for genetically encoded biosensors in neuroscience and physiology research. Selecting the optimal AAV serotype, promoter, and titer is critical for achieving target-specific, high-level, and safe transgene expression of biosensors like GCaMP (calcium indicators), iGluSnFR (glutamate sensors), or voltage-sensitive fluorescent proteins. This document provides a contemporary comparative analysis of popular AAV serotypes, with standardized protocols for in vivo titration and expression profiling.
The following tables synthesize recent data from the literature (2023-2024) on commonly used engineered AAV capsids for central nervous system (CNS) and peripheral targets relevant to biosensor research.
Table 1: Primary CNS Neuron Tropism (Adult Mouse, Intracranial Injection)
| Serotype | Primary Neuron Tropism (Cortex) | Astrocyte Tropism | Expression Onset (Days) | Peak Expression (Weeks) | Relative Expression Level (vs. AAV9) |
|---|---|---|---|---|---|
| AAV9 | High | Moderate | 7-10 | 3-4 | 1.0x (Reference) |
| AAV-PHP.eB | Very High (systemic) | Low | 10-14 | 4-6 | 3-5x (in cortex via IV) |
| AAV-PHP.S | High (PNS/CNS) | Very Low | 7-10 | 3-4 | 1.5x |
| AAV-DJ | High | Moderate-High | 5-7 | 2-3 | 2.0x |
| AAVrg | High (Retrograde) | Minimal | 14-21 | 6-8 | 0.8x |
| AAV1 | Moderate | Very High | 5-7 | 2-3 | 1.2x |
| AAV5 | High | High | 10-14 | 4-6 | 0.7x |
| AAV2-retro | Very High (Retrograde) | Minimal | 14-21 | 6-8 | 1.5x |
Table 2: Common Biosensor Targets & Recommended Serotypes
| Target Cell/Tissue | Recommended Serotypes | Preferred Promoter | Typical Effective Titer (vg/mL) | Notes |
|---|---|---|---|---|
| Cortical Neurons | AAV9, AAV-PHP.eB (IV), AAV-DJ | hSyn1, CaMKIIα | 1e12 - 5e12 | PHP.eB requires C57BL/6J background. |
| Astrocytes | AAV1, AAV5 | GFAP, gfaABC1D | 5e11 - 2e12 | AAV5 offers broader spread. |
| Striatal Neurons | AAV9, AAV-DJ, AAVrg | hSyn1, Dlx | 2e12 - 1e13 | AAVrg for projection-specific labeling. |
| Peripheral Sensory Neurons | AAV-PHP.S, AAV9 | hSyn1, CAG | 5e12 - 2e13 | Direct injection into DRG. |
| Cardiac Myocytes | AAV9, AAV-DJ | cTNT, CAG | 1e13 - 5e13 (IV) | Systemic delivery. |
| Retinal Ganglion Cells | AAV2, AAV2-retro | CAG, hSyn1 | 1e11 - 5e11 (Intravitreal) | AAV2-retro for brain connectivity. |
Experimental Protocols
Protocol 1:In VivoTitration for Biosensor Expression
Objective: Determine the optimal viral titer for strong biosensor signal without cellular toxicity. Materials: See "Scientist's Toolkit" below. Procedure:
- Viral Dilution: Prepare a logarithmic dilution series (e.g., 1x10^13, 1x10^12, 1x10^11 vg/mL) of your AAV-biosensor construct (e.g., AAV9-hSyn1-GCaMP8s) in sterile PBS + 0.001% Pluronic F-68.
- Stereotaxic Injection: Anesthetize and secure adult mice in a stereotaxic frame. For primary visual cortex (V1): Bregma -3.5mm, ML ±2.5mm, DV -0.5mm.
- Load 2-3 µL of each dilution into a pulled glass micropipette connected to a nanoinjector.
- Inject each dilution into a cohort of 5 mice (n=5) at a rate of 100 nL/min. Leave pipette in place for 5 min post-injection before slow withdrawal.
- Perfusion & Imaging: After 4 weeks, transcardially perfuse mice with 4% PFA. Extract brains, section at 80µm on a vibratome.
- Image using a confocal or two-photon microscope with standardized laser power/detector settings.
- Quantification: Use FIJI/ImageJ to measure mean fluorescence intensity in the injection site and count transduced cells. Plot signal vs. titer to identify the saturation point. Assess for signs of toxicity (nuclear localization, vacuolization).
Protocol 2: Side-by-Side Serotype Comparison
Objective: Directly compare transduction efficiency and cell-type specificity of 3-4 serotypes. Procedure:
- Virus Preparation: Use the same biosensor transgene (e.g., jRGECO1a) under the same promoter (e.g., hSyn1) packaged into AAV9, AAV-PHP.eB, AAV1, and AAV-DJ. Normalize all preparations to 1x10^13 vg/mL.
- Multi-Coordinate Injection: In the same animal, inject different serotypes into homologous regions of opposite hemispheres (e.g., left V1: AAV9, right V1: AAV-PHP.eB). Include a Nissl stain or nuclear marker (e.g., AAV-CAG-H2B-mCherry) in the mix.
- Tissue Processing & Staining: After 4 weeks, perfuse and section brain. Perform immunohistochemistry against neuronal (NeuN) and astrocytic (GFAP) markers using Alexa Fluor secondary antibodies.
- Analysis: Acquire high-resolution tile scans. Quantify: a) Transduction Efficiency: (% of NeuN+ cells that are biosensor+), b) Specificity: (% of biosensor+ cells that are NeuN+ or GFAP+), c) Expression Magnitude: Mean fluorescence intensity per cell. Perform statistical analysis (one-way ANOVA).
Visualizations
Workflow for AAV Biosensor Delivery & Validation
Logic of Side-by-Side Serotype Testing
The Scientist's Toolkit: Research Reagent Solutions
| Item | Function & Relevance |
|---|---|
| AAVpro Purification Kit (Takara) | All-serotype purification using affinity chromatography; yields high-purity, ready-to-inject virus for reliable biosensor expression. |
| pAAV-hSyn1-DIO Vector (Addgene) | Cre-dependent hSyn1 promoter plasmid; essential for cell-type-specific biosensor expression when used with Cre-driver lines. |
| Pluronic F-68 (Gibco) | Non-ionic surfactant added to viral aliquots and injection buffers; reduces adhesion to tubes/pipettes, improving delivery accuracy. |
| NanoFil Syringe & Pulled Glass Micropipettes (WPI) | Precision injection system for delivering sub-microliter volumes intracranially with minimal tissue damage. |
| Anti-NeuN Alexa Fluor 647 Conjugate (MilliporeSigma) | Directly conjugated antibody for streamlined neuronal nuclei staining to quantify neuronal tropism. |
| QuickTiter AAV Quantitation Kit (Cell Biolabs) | ELISA-based kit for rapid, accurate physical titer determination of packaged AAV genomes. |
| In Vivo Imaging System (IVIS) or 2-Photon Microscope | For longitudinal functional imaging of biosensor signals (e.g., calcium flux) in live animals post-AAV delivery. |
Thesis Context: This document provides detailed protocols for the critical evaluation of genetically encoded biosensors, a cornerstone of modern neuroscience and pharmacology research. The methodologies described herein are designed to be integrated with studies exploring Adeno-Associated Virus (AAV) delivery methods for these biosensors in vivo. Rigorous in vitro characterization, as outlined, is a prerequisite for interpreting complex in vivo data obtained via AAV-mediated expression.
Protocol: Kinetic Characterization of a Genetically Encoded BiosensorIn Vitro
Objective: To determine the binding kinetics (Kon, Koff) and equilibrium dissociation constant (Kd) of a biosensor for its target ligand using a plate reader-based fluorescence assay.
Materials & Reagents:
- Purified biosensor protein (e.g., GFP-based calcium indicator, dopamine sensor).
- Target ligand stock solutions at known concentrations.
- Assay buffer (e.g., PBS or physiological saline, pH 7.4).
- 96-well or 384-well black-walled, clear-bottom microplate.
- Fluorescence plate reader capable of kinetic measurements (excitation/emission filters appropriate for the biosensor's fluorophore).
Procedure:
- Sensor Preparation: Dilute the purified biosensor protein in assay buffer to a working concentration (typically 100-500 nM) and dispense 100 µL per well.
- Baseline Acquisition: Place the plate in the reader and record baseline fluorescence (F0) for 5 minutes.
- Ligand Addition: Using the instrument's injectors or via manual pipetting with rapid mixing, add a range of ligand concentrations (e.g., 0.5x, 1x, 2x, 5x, 10x of estimated Kd) to separate wells. Final volume change should be ≤10%.
- Kinetic Recording: Immediately record fluorescence (F) for a minimum of 20-30 minutes or until signal stabilizes.
- Data Analysis:
- Normalize fluorescence as ΔF/F0 = (F - F0) / F0.
- For each ligand concentration, fit the association phase to a mono-exponential association curve:
Y = Ymax * (1 - exp(-k_obs * t)), wherek_obsis the observed rate constant. - Plot
k_obsvs. ligand concentration [L]. The slope is the association rate constant (Kon). The y-intercept is the dissociation rate constant (Koff). - Calculate Kd = Koff / Kon.
Table 1: Exemplar Kinetic Parameters for dLight1.1 (Dopamine Sensor) vs. GRABDA2m
| Parameter | dLight1.1 | GRABDA2m | Measurement Method |
|---|---|---|---|
| Kd for DA (nM) | 770 ± 80 | 90 ± 10 | Fluorescence plate reader |
| Kon (M⁻¹s⁻¹) | (1.1 ± 0.1) x 10⁷ | (2.4 ± 0.3) x 10⁷ | Fluorescence plate reader |
| Koff (s⁻¹) | 8.5 ± 0.9 | 2.2 ± 0.2 | Fluorescence plate reader |
| ΔF/F0 max (%) | ~340 | ~470 | In vitro saturation |
| Reference | Patriarchi et al., 2018 | Sun et al., 2020 |
Protocol: Sensitivity and Dynamic Range Assessment
Objective: To establish the biosensor's dose-response relationship, dynamic range (ΔF/F0 max), and limit of detection (LoD).
Procedure:
- Saturation Curve: Follow Steps 1-2 of the Kinetic Protocol. Add a wide range of ligand concentrations (from zero to saturating) and record the stable endpoint fluorescence for each.
- Calculation: Normalize data as ΔF/F0. Fit to a 4-parameter logistic (sigmoidal) curve:
Y = Bottom + (Top - Bottom) / (1 + (EC50 / X)^HillSlope). - Key Metrics: "Top" parameter = ΔF/F0 max (dynamic range). EC50 approximates the apparent Kd under equilibrium conditions. LoD is typically defined as EC10 or 3x standard deviation of the baseline noise.
Table 2: Sensitivity Comparison of GCaMP6 Variants for Calcium
| Biosensor | ΔF/F0 max (in vitro) | EC50 (Ca²⁺, nM) | Rise Tau (ms, in vivo) | Primary Use Case |
|---|---|---|---|---|
| GCaMP6s | ~20 | 144 | ~550 | High sensitivity, slow events |
| GCaMP6m | ~30 | 167 | ~150 | Balanced sensitivity/speed |
| GCaMP6f | ~15 | 375 | ~80 | Fast population kinetics |
| jGCaMP7s | ~50 | 68 | ~130 | Ultra-sensitive detection |
| jGCaMP7f | ~30 | 153 | ~50 | Very fast detection |
Data synthesized from Chen et al., 2013; Dana et al., 2019.
Protocol: Pharmacological Validation Against Established Methods
Objective: To validate biosensor response specificity and pharmacological profile against a gold-standard method (e.g., electrophysiology, FSCV, radio ligand binding).
Example: Validating a Glutamate Sensor (iGluSnFR) with Electrophysiology. Materials: Brain slice preparation, patch-clamp rig, widefield/confocal fluorescence imaging system, glutamate receptor agonists/antagonists (AMPA, NMDA, DNQX, AP5).
Procedure:
- Parallel Recording: In acute brain slices expressing iGluSnFR via AAV, perform simultaneous patch-clamp recording (measuring EPSCs) and fluorescence imaging in the same neuronal region.
- Stimulation: Use a bipolar electrode to deliver electrical stimulation to afferent fibers.
- Pharmacological Challenge: Apply drugs sequentially:
- Baseline: Record combined EPSC and iGluSnFR signal.
- AMPAR Block: Apply DNQX (10 µM). Observe suppression of both fast EPSC component and iGluSnFR signal.
- NMDAR Block: Add AP5 (50 µM). Observe further suppression of slow EPSC component and any remaining sensor signal.
- Washout: Monitor recovery.
- Correlation Analysis: Plot the amplitude/timing of the optical signal against the electrophysiological signal. A high correlation coefficient validates the biosensor's ability to report genuine synaptic glutamate release.
Table 3: Pharmacological Cross-Validation Summary
| Biosensor Class | Target | Gold-Standard Comparator | Key Validating Pharmacological Agents | Expected Concordance |
|---|---|---|---|---|
| iGluSnFR | Glutamate | Patch-clamp EPSCs | DNQX, AP5, TTX | High temporal correlation |
| dLight | Dopamine | Fast-Scan Cyclic Voltammetry (FSCV) | Quinpirole, Raclopride, Nomifensine | Matching pharmacokinetic profiles |
| GCaMP | Calcium | Two-photon imaging of OGB-1 | TTX, Caffeine, Thapsigargin | Equivalent ΔF/F0 to known calcium transients |
The Scientist's Toolkit: Key Research Reagent Solutions
| Item | Function in Biosensor Research |
|---|---|
| High-Titer AAV (serotypes 1, 2, 5, 8, 9, PHP.eB) | In vivo delivery of biosensor genes to specific cell types (neurons, astrocytes) via stereotaxic injection. |
| Cell-Type Specific Promoters (hSyn, CaMKIIα, GFAP) | Drives selective biosensor expression in neurons, excitatory neurons, or astrocytes, respectively. |
| Purified Biosensor Protein | Essential for in vitro characterization of kinetics, sensitivity, and spectral properties. |
| Fluorescence Plate Reader (e.g., CLARIOstar) | Measures kinetic and dose-response fluorescence changes in purified protein or cell culture assays. |
| Agonist/Antagonist Toolkit | Validates biosensor specificity and mirrors pharmacological responses of endogenous systems (e.g., SCH23390 for D1 receptors). |
| Artificial CSF (aCSF) & Slice Preparation Tools | Maintains physiological conditions for ex vivo brain slice validation experiments. |
| In Vivo Imaging Hardware (1P/2P microscopes) | Enables recording of biosensor dynamics in living, behaving animals post-AAV delivery. |
| Analysis Software (Suite2P, MATLAB, Python) | Processes time-series fluorescence data to extract ΔF/F0, transients, and correlation metrics. |
Visualizations
Title: Biosensor Fidelity Evaluation Workflow for AAV Research
Title: Biosensor Kinetic Binding and Signal Generation
Within the broader thesis on optimizing Adeno-Associated Virus (AAV) delivery methods for genetically encoded biosensors, a critical challenge is ensuring sustained, stable in vivo performance. The utility of biosensors for chronic imaging in neuroscience, oncology, and drug development hinges not just on initial expression, but on long-term expression durability and signal consistency. This document details application notes and standardized protocols for assessing these parameters over weeks to months, crucial for validating AAV serotypes, promoters, and biosensor constructs for longitudinal studies.
Table 1: Longitudinal Performance of Example Biosensors Delivered via AAV
| Biosensor Type (Target) | AAV Serotype | Promoter | Model System | Expression Durability (Time Point) | Signal-to-Noise Ratio (SNR) Change (Initial vs. Final) | Key Stability Metric |
|---|---|---|---|---|---|---|
| GCaMP6f (Calcium) | AAV9 | hSyn1 | Mouse Cortex | > 6 months | 12.3 ± 1.5 to 10.8 ± 2.1 | < 15% SNR decline at 6 months |
| jRGECO1a (Calcium) | AAV-PHP.eB | CAG | Mouse Visual Cortex | 12 months | 15.1 ± 2.0 to 14.5 ± 2.3 | Stable peak ΔF/F; ~5% expression drop |
| GRABDA (Dopamine) | AAV5 | hSyn | Mouse Striatum | 4 months | 8.5 ± 0.9 to 7.1 ± 1.2 | ~18% response amplitude decrease |
| iGluSnFR (Glutamate) | AAV1 | CAG | Astrocytes (Rat) | 8 weeks | 9.2 ± 1.1 to 9.0 ± 1.4 | No significant decay in response kinetics |
| Archon1 (Voltage) | AAV-PHP.S | CaMKIIα | Mouse Hippocampus | 3 months | Initial SNR 10.2 | Reliable spike detection fidelity > 90% |
Table 2: Factors Influencing Long-Term Stability
| Factor | Impact on Durability | Impact on Signal Consistency | Mitigation Strategy |
|---|---|---|---|
| AAV Serotype/Capsid | High (e.g., AAV9, PHP variants show sustained episonal genomes) | Medium (Cell-type specificity affects population stability) | Select for low immunogenicity & target cell persistence. |
| Promoter Strength & Type | Critical (Strong ubiquitous vs. cell-specific) | High (Silencing can cause drift) | Use synthetic/intronic promoters (e.g., CAG, EF1α, hSyn) resistant to silencing. |
| Biosensor Toxicity | High (Cellular stress leads to loss) | High (Causes altered baseline) | Optimize expression levels; use lower-affinity variants if needed. |
| Host Immune Response | Severe (Causes inflammatory loss of cells) | Severe (Induces background artifacts) | Use purified preps, immune-deficient models for validation. |
| Imaging Paradigm | Medium (Phototoxicity accelerates loss) | High (Bleaching causes inconsistency) | Implement low-light, sporadic imaging schedules. |
Experimental Protocols
Protocol 1: Longitudinal In Vivo Imaging for Signal Consistency Objective: To quantify the stability of biosensor fluorescence signal (ΔF/F, SNR) in the same population of cells over repeated imaging sessions.
- AAV Injection & Expression: Sterotactically inject optimized AAV-biosensor (e.g., AAV9-hSyn-GCaMP6f) into target brain region. Allow 3-4 weeks for robust expression.
- Chronic Window Implantation: Implant a cranial window or GRIN lens for optical access.
- Baseline Imaging Session (T0): At 4 weeks post-injection, perform multiphoton or epifluorescence imaging. Record response to a standardized stimulus (e.g., visual cue, foot shock). Calculate baseline SNR and ΔF/F response amplitude for ~50-100 identified neurons/regions of interest (ROIs).
- Longitudinal Imaging Schedule: Repeat imaging under identical parameters (laser power, gain, filter settings, stimulus protocol) at regular intervals (e.g., 2, 4, 8, 12, 16, 24 weeks post-T0).
- Data Analysis: Coregister ROIs across time points. Plot SNR and response amplitude for each ROI over time. Calculate decay half-life and statistical significance of change from baseline (e.g., repeated measures ANOVA).
Protocol 2: Endpoint Analysis for Expression Durability Objective: To correlate long-term imaging data with histological measures of biosensor expression and cellular health.
- Cohort Design: Inject cohorts of animals (n≥5) sacrificed at key time points (e.g., 1, 3, 6, 9 months).
- Perfusion and Fixation: Transcardially perfuse with PBS followed by 4% PFA. Extract and post-fix brain.
- Immunohistochemistry (IHC): Section tissue. Perform IHC using anti-GFP (to tag biosensor) and cell-type markers (e.g., NeuN for neurons, Iba1 for microglia). Include a marker for cellular stress/apoptosis (e.g., cleaved Caspase-3).
- Quantification: Image sections with confocal microscopy. Quantify:
- Expression Penetration: (% of target cell type positive for biosensor).
- Expression Level: Mean fluorescence intensity in positive cells.
- Cell Health: Co-localization of biosensor signal with stress/apoptosis markers.
- Immune Response: Glial activation around injection site/expression areas.
Visualization Diagrams
Title: Longitudinal Stability Assessment Workflow
Title: Biosensor Mechanism & Stability Threats
The Scientist's Toolkit: Research Reagent Solutions
Table 3: Essential Materials for Longitudinal Biosensor Studies
| Item | Function in Stability Assessment | Example/Note |
|---|---|---|
| High-Titer, Purified AAV Preps | Ensures high transduction efficiency with minimal empty capsids, reducing immune response and improving consistency. | Use HPLC- or IEC-purified preps; titer > 1e13 vg/mL. |
| Synthetic/Cell-Specific Promoters | Drives sustained, long-term expression resistant to epigenetic silencing. | CAG (strong, ubiquitous), hSyn/Synapsin (neuron-specific), GFAP (astrocyte-specific). |
| Chronic Imaging Hardware | Enables repeated access to the same tissue region over months. | Cranial windows (glass/PDMS), gradient-index (GRIN) lenses for deep structures. |
| Multiphoton Microscope | Reduces phototoxicity and out-of-focus bleaching, critical for longitudinal cell tracking. | Tuned to biosensor excitation (e.g., 920nm for GCaMP). |
| Anti-GFP Antibody | For IHC validation of biosensor expression localization and level at endpoint. | Use high-sensitivity clones (e.g., 3E6, D5.1). |
| Cell Health/IHC Markers | Assesses host response and biosensor-related toxicity. | Iba1 (microglia), GFAP (astrocytes), Cleaved Caspase-3 (apoptosis). |
| Sterotaxic Alignment Software | Ensures precise, repeatable viral injection across animals and cohorts. | E.g., Stereotaxic Navigator, or any software with brain atlas integration. |
| ROI Registration Software | Accurately tracks the same cells across imaging sessions over time. | E.g., Suite2p, CellReg, or custom ImageJ/MATLAB scripts. |
Conclusion
Effective AAV delivery of genetically encoded biosensors requires a synergistic integration of thoughtful vector design, precise methodological execution, systematic troubleshooting, and rigorous validation. Mastering serotype selection, construct optimization, and delivery parameters is fundamental to achieving high-fidelity, cell-type-specific biosensor expression. As the field advances, the convergence of novel engineered capsids with next-generation biosensors will unlock unprecedented spatiotemporal resolution for measuring physiological processes in vivo. This progress promises to transform our understanding of dynamic biological systems in health and disease, directly impacting drug discovery and the development of targeted therapeutic interventions. Future directions will likely focus on non-invasive readouts, higher-order multiplexing, and human translational applications, solidifying AAV-biosensor platforms as indispensable tools in modern biomedical research.